

Abstract
This study used the aggregate data meta-analytic approach to determine the combined effects of aerobic exercise and diet on lipids and lipoproteins in overweight and obese adults. Twelve studies representing 859 men and women (443 intervention, 416 control) were included. Using random-effects models, statistically significant, intervention minus control reductions were found for TC (−12.8 mg/dL, 95% CI, −19.9 to −5.7), TC : HDL-C (−0.5 mg/dL, 95% CI, −0.8 to −0.1), LDL-C (−6.8 mg/dL, 95% CI, −11.8 to −1.8), and TG (−13.1 mg/dL, 95% CI, −21.2 to −5.0) but not HDL-C (−0.4 mg/dL, 95% CI, −2.3 to 1.6). Results remained robust when adjusted for publication bias, deleting each study from the model once, and collapsing results for multiple groups from the same study into one effect size. These findings suggest that concurrent aerobic exercise and diet improve TC, LDL-C, TC : HDL-C, and TG, but not HDL-C, in overweight and obese adults.
1. Introduction
Overweight and obesity is a major public health problem worldwide. For example, the World Health Organization reported that the global prevalence of overweight and obesity in adults, defined as a body mass index (BMI) ≥25 kg/m2, is approximately 2 billion, and by the year 2015, will increase to approximately 3 billion [1]. In the United States (US), an estimated 68% of adults are either overweight or obese [2]. Less-than-optimal concentrations of lipids and lipoproteins, a major risk factor for cardiovascular disease [3], are more prevalent among overweight and obese versus normal weight adults. For example, using data from the United States Behavioral Risk Factor Surveillance System Survey, the age-adjusted prevalence of elevated total cholesterol (TC) was approximately 10% to 16% greater among overweight and obese versus normal weight adults [4]. Aerobic exercise combined with diet is commonly recommended for improving and maintaining optimal concentrations of lipids and lipoproteins in overweight and obese adults [5]. However, previous randomized controlled trials addressing the combined effects of aerobic exercise and diets aimed at improving TC, high-density lipoprotein cholesterol (HDL-C), ratio of TC : HDLC, low-density lipoprotein cholesterol (LDL-C), and triglycerides (TG) in adults have reached conflicting conclusions [6–17]. For example, using the vote-counting approach [18], the percentage of outcomes reported as statistically significant has been underwhelming: TC (43%), HDL-C (8%), TC : HDL-C (43%), LDL-C (25%), TG (46%). The between-study discrepancy in these findings may be related to such things as age, gender, baseline lipid and lipoprotein levels, intervention characteristics, changes in body composition, aerobic fitness, and nutrient intake. However, reliance on the vote-counting approach can be extremely misleading [18]. Meta-analysis is a quantitative approach for combining the results of studies. The strengths of meta-analysis include (1) increased power, (2) improved estimates of effect size, and (3) the potential to resolve disagreements between studies [19]. Thus, given the aforementioned conflicting findings, the purpose of this study was to use the meta-analytic approach to determine the combined effects of aerobic exercise and diet on lipid and lipoprotein concentrations in overweight and obese adults.
2. Methods
2.1. Data Sources
Studies for the current meta-analysis were retrieved from a large in-house aerobic exercise and diet database that includes 1401 citations (all references available upon request). The initial database was developed by searching nine electronic databases, (PubMed, EMBASE, CINAHL, Cochrane Central Register of Controlled Trials, SportDiscus, Dissertation Abstracts International, Physiotherapy Evidence Database (PEDRO), Latin American and Caribbean Health Sciences Database (LILACS), Web of Science), cross-referencing from retrieved studies, and expert review (SR, WH).
Per recent PRISMA recommendations [20], the search query used for one of the databases included in the original search (PubMed) is shown as follows.
User Query for PubMed Search —
(“1955/01/01” [PDAT]: “2009/05/01” [PDAT]) AND ((“exercise” [MeSH Terms] OR
“exercise” [All Fields]) AND (“diet” [MeSH Terms] OR “diet” [All Fields]) AND
(“lipids” [MeSH Terms] OR “lipids” [All Fields]) OR (“exercise” [MeSH Terms] OR
“exercise” [All Fields]) AND (“diet” [MeSH Terms] OR “diet” [All Fields]) AND
(“cholesterol” [MeSH Terms] OR “cholesterol” [All Fields])) AND
(“humans” [MeSH Terms] AND Randomized Controlled Trial[ptyp] AND “adult” [MeSH Terms]).
2.2. Study Selection
The inclusion criteria for this study were as follows: (1) randomized trials with a comparative control group (no intervention, usual care, attention control), (2) aerobic exercise along with any diet considered to improve lipids and lipoproteins (low saturated fat, caloric restriction, etc.), (3) combined aerobic exercise and diet intervention ≥4 weeks, (4) adult humans ≥18 years of age, (5) all participants considered to have a BMI ≥25 kg/m2, (6) published studies, including dissertations and Master's theses, (7) studies published in any language, (8) studies published between January 1, 1955 and May 1, 2009, and (9) assessment of one or more of the following lipids and lipoproteins: TC, HDL-C, TC : HDL-C, non-HDL-C, LDL-C, and TG. The year 1955 was chosen as the starting point for potential inclusion of studies since this appeared to be the first time that an intervention on aerobic exercise and diet had been reported [21]. Aerobic exercise was defined according to the recent Physical Activity Guidelines Activity Report, that is, “Exercise that primarily uses the aerobic energy-producing systems, can improve the capacity and efficiency of these systems, and is effective for improving cardiorespiratory endurance” [22]. Any studies not meeting all the criteria above were excluded from the study. All studies were selected by the first two authors. Discrepancies were resolved by consensus.
2.3. Data Abstraction
Electronic codebooks that could record up to 205 items per study were developed prior to data abstraction. The major categories that were coded included (1) study characteristics, (2) participant characteristics, (3) aerobic exercise and diet characteristics, and (4) changes in primary and secondary outcomes. The first two authors coded all studies independent of each other and then reviewed each item for accuracy and consistency. Disagreements were discussed until agreement could be reached.
Because of the lack of empirical evidence [23, 24], including validity [25, 26], to support the use of quality scales, the risk of bias assessment tool recently recommended by the Cochrane Collaboration was used [27]. Briefly, this instrument assesses bias across six domains: (1) sequence generation, (2) allocation concealment, (3) blinding to group assignment, (4) incomplete outcome data, (5) selective outcome reporting, and (6) other potential bias [27]. Each domain is categorized as having either a high, low, or unclear risk of bias [27]. Assessment for the potential risk of bias was limited to the study's primary outcomes. Given the methods used to assess lipids and lipoproteins versus a more qualitative measure such as self-reported quality of life, all studies were considered to be at a low risk of bias for blinding. Other potential bias included whether participants had been taking part in a regular exercise program, as defined by the study authors, prior to study enrollment. The first two authors conducted all bias assessments independent of each other and then met and reviewed every item for agreement. Disagreements were discussed until consensus could be reached.
2.4. Statistical Analysis
2.4.1. Calculation of Effect Sizes from Each Study
The primary outcomes of interest were TC, HDL-C, TC : HDL-C, non-HDL-C, LDL-C, and TG. The original metric (milligrams per deciliter) was chosen as the effect size (ES) for analysis. While somewhat arbitrary, at least 5 ESs per variable were required in order to be included in the meta-analysis. The ES for each lipid and lipoprotein variable for each group from each study were calculated by subtracting the change score difference in the aerobic exercise and diet group from the change score difference in the control group. The variance for each ES was calculated from the pooled standard deviations of change scores in the intervention (aerobic exercise and diet) and control groups. If change score standard deviations were not available, they were calculated from 95% confidence intervals or before and after standard deviation values according to previously developed procedures [28]. Each ES was then weighted by the inverse of its variance. Missing primary outcome data were requested and received from the authors of two studies [7, 8].
Secondary outcomes included changes in body weight, BMI in kg/m2, maximum oxygen consumption (VO2max mL·kg−1·min−1), and intake of kilocalories, carbohydrates, total fat, saturated fat, and cholesterol. A lack of data were available for the inclusion of non-HDL-C (dispersion statistics), percent body fat, lean body mass, waist circumference, energy expenditure, protein, fiber, and transfat.
2.4.2. Pooled Estimates of ESs for Primary and Secondary Outcomes
Random-effects, method of moments models that incorporates heterogeneity in the analysis, were used to pool primary and secondary outcomes [29]. The sole focus on random-effects models is based on the fact that random-effects models assume that the true effect size varies across studies while fixed-effects models assume one true effect size, the latter of which is almost never the case [30]. Multiple groups from the same study were analyzed separately as well as after collapsing groups so that one ES represented each study. Two-tailed 95% confidence intervals that did not cross zero were considered to be statistically significant. Effect sizes with standardized residuals greater than 3 were deleted from the final model.
Heterogeneity was assessed using Cochran's Q statistic and an alpha value for statistical significance of 0.10 [31]. Between-study inconsistency of ES was examined using an extension of the Q statistic, I2 [32]. Generally, I2 values of 25% to <50%, 50% to <75%, and ≥75% are considered to represent small, medium, and large amounts of inconsistency [32].
Publication bias was examined using the data imputation approach of Duval and Tweedie [33]. In addition, the influence of each study on the overall results was examined by deleting each study from the model once. Cumulative meta-analysis, ranked by year, was used to examine results over time [34] while 95% prediction intervals were used to determine treatment effects in a new trial [35]. Simple, random effects metaregression (method-of-moments approach) was conducted to examine the association between changes in lipids and lipoproteins and age, gender, baseline lipid and lipoprotein levels, length of the intervention in weeks and changes in body weight, BMI, VO2max in mL·kg−1·min−1, kilocalories, total fat, saturated fat, and cholesterol. In addition, meta-regression was conducted in order to examine the relationship between gender and changes in body weight, total kilocalories, total fat, saturated fat and cholesterol consumed. Nonoverlapping 95% confidence intervals for the slope (β1) were considered statistically significant. With the exception of the length of the intervention, we were unable to conduct any type of analyses with respect to dose-response associations.
Descriptive statistics were generated using PASW, version 18.0, reliability using Excel 2007 and all meta-analytic analyses using Comprehensive Meta-Analysis, version 2.2. Data are reported as mean ± standard deviation , medians (Mdn), percentages (%) and 95% confidence intervals (95% CI).
3. Results
3.1. Study Characteristics
Twelve studies representing up to 28 groups (14 intervention, 14 control) and 859 men and women (443 intervention, 416 control) were available for pooling [6–17]. A flow chart that describes the search process is shown in Figure 1 while a general description of the studies is shown in Table 1. The number of groups was greater than the number of studies because two studies reported data partitioned by gender [10, 17]. Dropout rates for the 11 groups in which data were available ranged from 0% to 63.6% in the intervention groups (, 13.5 ± 17.7, Mdn, 9) and 0% to 40% in the control groups (, 13.3 ± 13.3, Mdn, 9). Little information was provided for the reasons why participants dropped out of the studies. The final number of participants in which data were pooled ranged from 4 to 137 in the exercise and diet groups (, 32 ± 32, Mdn, 23) and 6 to 140 in the control groups (, 30 ± 33, Mdn, 23). Nine of 12 studies (75%) reported receiving some type of external funding [6–8, 10, 13–17]. Eleven of the 12 included studies (91.7%) were published in journals [6–11, 13–17] while 1 was a dissertation [12]. All studies were published in the English language between 1986 and 2006 [6–17]. With respect to statistical analysis, all studies appeared to use the per-protocol approach in the analysis of their data [6–17]. Five of 12 studies (41.7%) reported some type of matching procedure [6, 8, 13, 14, 17]. This included stratification by either bodyweight [8], race (African-American and other) [14], sex [17], sex and degree of insulin sensitivity [13], or type of medication (insulin or oral agents and diet therapy) [6]. None of the studies used a crossover design [6–17].
Figure 1.
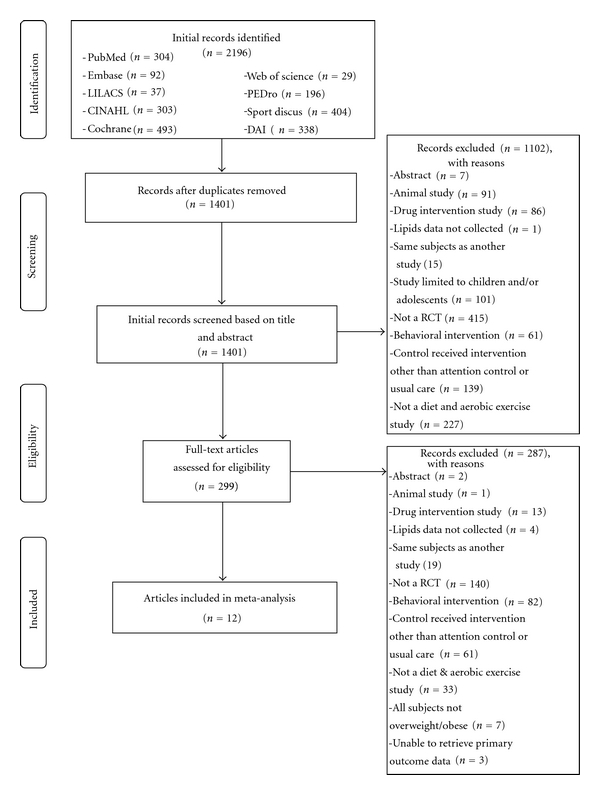
Flow diagram for the selection of studies.
Table 1.
General characteristics of studies.
| Study | Country | Group characteristics* | Exercise intervention | Diet intervention | Lipid assessment |
|---|---|---|---|---|---|
| Agurs-Collins et al. (1997) [6] |
USA | 64 overweight African-American men and women with type 2 diabetes, 55–79 yrs age, assigned to an exercise and diet (n = 32) or usual care (n = 32) group | 12 wks of 20 min of supervised low-impact aerobic exercise 1x wk; encouraged to exercise 2x wk and increase physical activity in daily routines | Carbohydrate, 55%–60% of kcals; protein 12–20%; fat, <30%; weight loss of 4.5 kg at ≤0.9 kg per week using the Exchange Lists for Meal Planning program | TC, HDL, TC/HDL, LDL, TG after a 12 hr overnight fast; LDL estimated using the Friedwald formula |
| Anderssen et al. (2005) [7] | Norway | 285 drug-treated, sedentary, overweight hypertensive men, 40–75 yrs of age, assigned to a placebo and lifestyle intervention (n = 142) or placebo and usual care (n = 143) group | 209 wks of supervised aerobic exercise 2x wk; home-based individualized aerobic activity program | Individualized to reduce caloric intake, saturated fat and sugar, and to increase intake of fruit, vegetables, complex carbohydrates, fish, and fish products | TC, HDL, LDL, TG in the morning after an overnight fast |
| Arciero et al. (2006) [8] | USA | 36 sedentary, overweight/obese men and women, 26 to 60 yrs of age, assigned to an exercise and diet (n = 19) or nonintervention control group (n = 17) | 12 wks of supervised aerobic exercise, 4–6x wk, 30–60 min/d, 50%–75% MHR | Carbohydrate, 55%–60% of kcals; protein 10–15%; fat, <30% | TC, HDL, TC/HDL, LDL, TG in the morning after a 12 hr overnight fast; LDL estimated using the Friedwald formula |
| Avila and Hovell (1994) [9] | USA | 44 overweight Latino women 18 yrs of age and older assigned to an exercise and diet (n = 22) or control (n = 22) group | 8 wks of supervised walking, 1x per wk, 20-min/d; participants also encouraged to walk an additional 15–20 min/d, every d | Carbohydrate, 58% of kcals; protein, 12%; fat, <30%; 1200–1500 kcals/d | TC |
| Hagan et al. (1986) [10] | USA | 24 sedentary, overweight men and women assigned to an exercise and diet (n = 12) or control (n = 12) group | 12 wks of supervised walking and/or running, 30 min/d, 5x per wk | 1200 kcals/d | TC, HDL, LDL, TG after a 14 hr fast and 30 min of supine rest; LDL estimated using the Friedwald formula |
| Hirose et al. (2002) [11] | Japan | 35 overweight women >30 yrs of age assigned to either a diet and exercise (n = 23) or control (n = 12) group | 12 wks of unsupervised walking, at least 2x wk, 30 min/d; given a pedometer and asked to walk 10,000 steps/d | 1600 kcals/d, <25% fat | TC, HDL, TG |
| Hopewell (1989) [12] | USA | 21 sedentary, overweight, nonsmoking, premenopausal women, 20–51 yrs of age, assigned to an exercise and diet (n = 11) or control (n = 10) group | 24 wks supervised walking, 3x wk, 50 min/d | 1200 kcals/d, 60% carbohydrates, 20% protein, 20% fat, 25 g fiber/d | TC, HDL,TC/HDL, LDL, TG after a 12 hr fast and avoiding exercise for at least 24 hr; LDL estimated using the Friedwald formula |
| McAuley et al. (2002) [13] | New Zealand | 54 sedentary, overweight/obese men and women 30–68 yrs of age assigned to a modest exercise and diet (n = 31) or control (n = 23) group | 16 wks supervised & unsupervised aerobic exercise, 5x wk, 30 min/d | <32% of total kcals from fat, ≤11% of total kcals from saturated fat, 14% from monounsaturated fat, 7% from polyunsaturated fat, 50% from carbohydrates, 18% from protein, <200 mg cholesterol and >25 g fiber per/d | Fasting TC, HDL, LDL, TG |
| Miller et al. (2002) [14] | USA | 44 hypertensive, overweight adults, 22 to 70 yrs of age, assigned to either an exercise and diet (n = 22) or control (n = 23) group | 9 wks of supervised aerobic exercise (walking or cycle ergometry), 3x wk, 30–45 min/d, 50%–75% MHR | Hypocaloric version (2100 kcals) of DASH diet (18% kcals from protein, 55% from carbohydrate, 6% saturated fat, 13% monounsaturated fat, 8% polyunsaturated fat, 500 mg/d magnesium, 1240 mg/d calcium, 4700 mg/d potassium, 31 g/d fiber, 150 mg/d cholesterol, 100 mmol/d sodium) | TC, HDL, LDL, TG after fasting; LDL estimated using the Friedwald formula |
| Nieman et al. (2002) [15] | USA | 44 sedentary obese women, 25–75 yrs of age, assigned to either an exercise and diet (n = 22) or attention control stretching (n = 22) group | 12 wks walking, 5x wk (4 supervised, 1 unsupervised), 45 min/d, 60% to 80% MHR | 1200–1300 kcal, NCEP Step 1 diet (55% carbohydrate, 30% total fat, ≤10% saturated fat, <300 mg/d of cholesterol) | TC, HDL, TC/HDL, LDL, TG |
| Wing et al. (1998) [16] | USA | 77 overweight men and women, 40–55 yrs of age, assigned to either an exercise and diet (n = 37) or control (n = 40) group | 104 wks supervised and unsupervised brisk walking, increasing to 3 miles per/d, 5x week | 800–1,500 kcal/d, 20% of kcals from fat | Fasting TC, HDL, LDL, TG |
| Wood et al. (1991) [17] | USA | 160 sedentary, overweight men and women 25 to 49 yrs of age assigned to either an exercise and diet (n = 81) or control (n = 79) group | 52 wks supervised brisk walking and jogging, 25–45 min/d, 3x wk, 60% to 80% MHR | NCEP Step 1 diet (55% carbohydrate, 30% total fat, ≤10% saturated fat, <300 mg/d of cholesterol) | TC, HDL, LDL, TG in the morning after a 12 to 16 hr overnight fast and avoiding vigorous physical activity for at least 12 hr |
Notes. Description of groups and all other variables limited to those that met the criteria for inclusion. *Number of participants include those that began the study but not necessarily included in the final analysis. USA, United States of America; yrs, years; wk, week; wks, weeks; min, minutes; kcals, kilocalories; kg, kilograms; TC, total cholesterol; HDL, high-density lipoprotein cholesterol; LDL, low-density lipoprotein cholesterol; TG, triglycerides; TC/HDL, ratio of total cholesterol to high-density lipoprotein cholesterol; hr, hour; MHR, maximum heart rate; kcals/d, kilocalories per day; min/d, minutes per day; NCEP, National Cholesterol Education Program; mg/d, milligrams per day; VO2max, maximum oxygen consumption; DASH, Dietary Approaches to Stop Hypertension; AHA, American Heart Association; MWC, maximal work capacity.
3.2. Risk of Bias Assessment
Overall results for risk of bias are shown in Figure 2. As can be seen, all studies appeared to use appropriate procedures for sequence generation [6–17], but only one reported an acceptable process for allocation concealment [14]. Given the methods used for the assessment of lipid and lipoprotein concentrations, all studies were considered to be at a low risk of bias for blinding [6–17]. Less than half the studies were considered to be at a low risk of bias with respect to incomplete data [8, 9, 11, 14]. Given the absence of a study protocol identification number, the risk of bias for incomplete outcome reporting was determined to be unclear across all studies [6–17]. The majority of studies (66.7%) were considered to be at a low risk of bias with regards to participants engaging in a regular exercise program prior to study enrollment [7–10, 12, 13, 15, 17].
Figure 2.
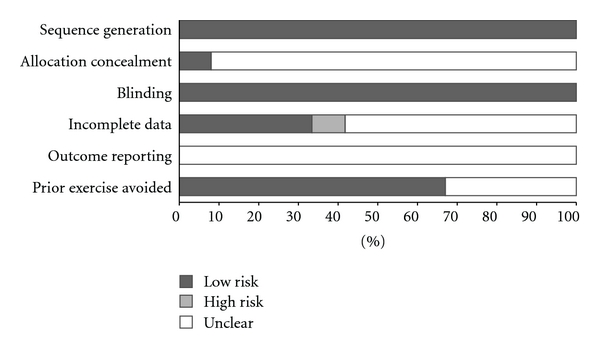
Risk of bias assessment.
3.3. Participant Characteristics
A description of the characteristics of participants for each study is shown in Table 1 while a group description is shown in Table 2. Seven studies included men and women [6, 8, 10, 13, 14, 16, 17] with two reporting data separately according to gender [10, 17]. Another four studies were limited to women [9, 11, 12, 15] while one was limited to men [7]. The number of men and women could not be calculated because of missing data from some studies. For the five studies reporting data on race/ethnicity [6, 9, 11, 13, 14], one each reported that participants were either African-American [6], Caucasian [13], Japanese [11], or Latino (90% Mexican-American and 10% Mexican) [9]. Another study reported that 68% of the participants in the intervention group and 57% in the control group were black [14].
Table 2.
Initial characteristics of participants.
| Variable | Exercise | Control | ||||||
|---|---|---|---|---|---|---|---|---|
| # | Range | Mdn | # | Range | Mdn | |||
| Age (years) | 13 | 46.3 ± 8.6 | 34–62 | 46.0 | 13 | 45.6 ± 8.7 | 33–61 | 45 |
| Body weight (kg) | 12 | 87.5 ± 34.9 | 66–99 | 92.39 | 12 | 88.2 ± 12.1 | 66–103 | 91.3 |
| BMI (kg·m2) | 8 | 31.8 ± 3.2 | 27–36 | 32.7 | 8 | 32.4 ± 3.9 | 26–37 | 33.7 |
| VO2max (mL·kg−1·min−1) | 7 | 28.5 ± 6.2 | 20–36 | 29.4 | 7 | 28.5 ± 6.3 | 21–38 | 29.0 |
| Kilocalories (total) | 8 | 2018 ± 319 | 1488–2616 | 1999 | 8 | 1950 ± 353 | 1398–2616 | 1922 |
| Carbohydrates (%) | 5 | 49.6 ± 1.8 | 48–53 | 49.0 | 5 | 49.7 ± 2.8 | 47–54 | 48.4 |
| Total fat (%) | 8 | 32.4 ± 3.7 | 28–38 | 32 | 8 | 32.7 ± 3.7 | 27–38 | 32.6 |
| Saturated fat (%) | 5 | 12.6 ± 1.8 | 10–14 | 13.6 | 5 | 12.4 ± 2.2 | 9–14 | 13.6 |
| Cholesterol (mg) | 5 | 318 ± 61 | 248–400 | 296 | 5 | 280 ± 78 | 197–400 | 284 |
| TC (mg/dL) | 14 | 212.5 ± 24.7 | 188–271 | 202.2 | 14 | 204.3 ± 16.4 | 185–238 | 201.3 |
| HDL-C (mg/dL) | 13 | 48.8 ± 6.5 | 38–58 | 49.0 | 13 | 48.0 ± 6.6 | 38–58 | 49.9 |
| TC : HDL-C | 5 | 4.8 ± 0.6 | 4.1–5.3 | 4.9 | 5 | 4.8 ± 0.5 | 4.1–5.2 | 4.9 |
| LDL-C (mg/dL) | 8 | 133.4 ± 17.1 | 115–172 | 127.0 | 8 | 131.1 ± 12.9 | 117–156 | 126.5 |
| TG (mg/dL) | 12 | 103.7 ± 55.0 | 33–224 | 84.9 | 12 | 102.7 ± 46.2 | 33–166 | 102.8 |
Notes. #, number of groups in which data were available. With the exception of age, data limited to those in which change outcome results could be calculated. Mdn, median; BMI, body mass index; VO2max, maximum oxygen consumption; mg, milligrams; TC, total cholesterol; HDL-C, high-density lipoprotein cholesterol; TC : HDL-C, ratio of TC to HDL; LDL-C, low-density lipoprotein cholesterol; TG, triglycerides. To convert TC, HDL-C and LDL-C from mg/dL to mmol, divide by 38.46, to convert TG from mg/dL to mmol, divide by 87.72. Insufficient data (<5) reported for protein, polyunsaturated fat, saturated fat, and trans-fat intake as well as non-HDL-C.
Information on prescription medication use was reported by six studies [6, 7, 9, 13, 14, 17]. Three reported that all participants were taking some type of prescription drug during the study [6, 7, 14], one reported that some were taking medication [13], while another reported that with the exception of hormone replacement therapy, none were taking medication [9]. Another study reported that none of the participants were taking any medications known to affect blood pressure or lipid metabolism [17]. Prescription drug use included lipid medications, diuretics, beta-blockers, alpha-blockers, calcium channel blockers and angiotensin receptor blockers [14], calcium antagonists, beta-blockers, diuretics, and angiotensin converting enzyme inhibitors [7] or insulin and oral agents [6]. One study reported that participants were allowed to continue their medication use during the study as long as they had been taking them for at least six months and were unlikely to change their intake [13]. Two studies reported that none of the women were taking any type of hormone replacement therapy during the study [12, 17] while another reported that some were taking hormone replacement therapy [9].
Data on cigarette smoking was reported by seven studies [6–8, 12, 14, 15, 17] with four reporting that none of the participants smoked [8, 12, 15, 17] and three reporting that some smoked [6, 7, 14]. For alcohol consumption, one study reported that none of the participants consumed alcohol [10] while two others reported that some did [13, 14]. Eight studies reported that participants were sedentary prior to study enrollment [7–10, 12, 13, 15, 17]. Little information was provided on whether the participants changed their level of physical activity beyond that prescribed to the intervention group. One study did report a decrease in physical activity among participants in the control group [6]. For those studies that included women, five included both pre- and postmenopausal females [8, 13–16], two were limited to premenopausal women [12, 17], and one was limited to postmenopausal women [6]. At least 10 of the 12 studies included some participants who were hyperlipidemic [6, 7, 9–12, 14–17]. Seven studies reported that none of the participants had type 2 diabetes [8, 10, 13–16] while one reported that all did [6]. Eight of the studies reported that none of the participants had Type 1 diabetes [6–8, 10, 13–16]. In relation to hypertension, two studies reported that all participants were hypertensive [7, 14], one reported that some were [6], and one reported that none were [10]. Five studies reported that none of the participants had a previous history of cardiovascular disease [7, 8, 10, 14, 15], one reported no previous history of stroke [7], another reported no history of metabolic syndrome [8], and another reported no previous history of cancer [15].
3.4. Aerobic Exercise and Diet Interventions
3.4.1. Aerobic Exercise
A description of the aerobic exercise component of the intervention is shown in Table 1. Intervention length ranged from 8 to 208 weeks (, 39 + 56, Mdn, 12) while the between-group frequency of aerobic training ranged from 2 to 6 sessions per week (, 4 + 1, Mdn, 3) [6–17]. Within-group frequency of training ranged from 1 to 7 sessions per week for the three studies in which information was available [6, 8, 9]. For the 6 studies and 7 groups in which data were provided [6, 8, 10–12, 15], the mean between-group duration of training ranged from 20 to 50 minutes per session (, 35 ± 10, Mdn, 30) while the within-group duration ranged from 15 to 60 minutes for the 7 studies and 8 groups that reported such [8, 9, 13–17]. Within-group intensity of training ranged from 50% to 90% of maximum heart rate (MHR) for the 6 studies and 7 groups that reported data [7, 8, 13–15, 17]. Insufficient data were provided to calculate between-group intensity of training. Between-group total minutes of training ranged from 60 to 228 minutes per week (, 142 ± 69, Mdn, 150) for the 6 studies and 7 groups from which data could be calculated [6, 8, 10–12, 15]. The most common types of activities were walking followed by jogging and cycling. Between-group compliance, defined as the percentage of exercise sessions attended, ranged from 38% to 98% for the 5 studies in which adequate data were provided (, 78 ± 24, Mdn, 86) [8, 12, 14–16]. Ten studies representing 12 groups reported exercise data (frequency, intensity, duration) based on what was prescribed versus completed [6, 7, 9–11, 13–17] while two others reported what was actually completed [8, 12]. Five studies comprising 7 groups reported that exercise sessions were supervised [8, 10, 12, 14, 17], 1 reported that exercise was unsupervised [11] while the remaining 6 included both supervised and unsupervised sessions [6, 7, 9, 13, 15, 16].
3.4.2. Diet
A description of the diet interventions employed is shown in Table 1. Two studies representing 3 groups used the National Cholesterol Education Program (NCEP) Step 1 diet [15, 17] while two others used either the American Heart Association (AHA) Step 1 diet [8] or a diet based on previous recommendations from the California Dietetics Association [9]. Diets included caloric restriction only and/or modification of other dietary components (fat, saturated fat, fiber, etc.). Ten studies representing 12 groups reported weight loss as a goal for all participants [6, 8–12, 14–17] while another reported weight loss as a goal for some participants [13]. Another study reported that weight loss was not a goal [7].
3.5. Assessment of Primary Outcomes
Results for lipid and lipoprotein assessment procedures are shown in Table 1. Nine of 12 studies reported that participants fasted prior to the assessment of lipids and lipoproteins [6–8, 10, 12–14, 16, 17] with fasting occurring for at least 12 hours [6–8, 10, 12, 17]. Since the three other studies did not report this information, the investigative team was unable to determine whether the participants fasted [9, 11, 15]. For the 8 studies in which data were available, all reported that assessment took place in the morning [6–8, 10, 12–14, 17]. Three studies reported that exercise was avoided for at least 12 hours prior to lipid assessment [8, 12, 17]. One study reported that lipid and lipoprotein assessment took place between August and April [12].
3.6. Assessment of Secondary Outcomes
For those studies in which data were available, bodyweight was assessed using either standard or electronic scales [6, 8, 9, 11–14, 16, 17]. Maximum oxygen consumption (VO2max in mL·kg−1·min−1) was measured using either a graded, maximal [10, 17], or submaximal [13] treadmill test or estimated from a walk test [9, 16].
For those studies that reported data, a variety of methods were used for assessing nutrient intake. These included a 1-week food frequency questionnaire [6], 3-day food record [8, 10], 3-day food record and 24 hour recall [15], 3-day food record and block food frequency questionnaire [16], 4-day food record [13] self-reported and interviewer administered 7-day food records [17] and a semiquantitative food frequency questionnaire [11].
3.7. Pooled Estimates of ES
3.7.1. Primary Outcomes
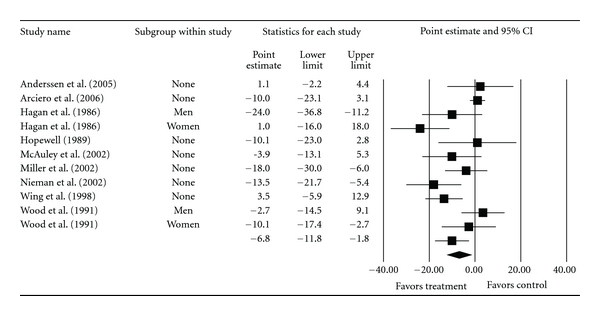
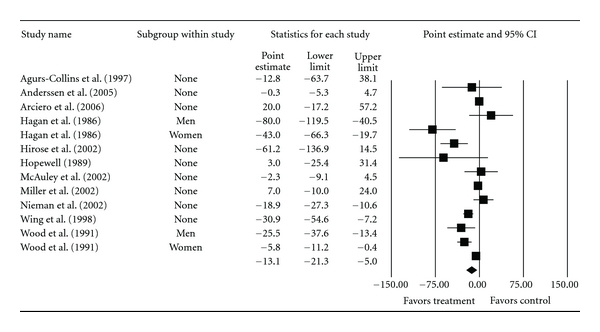
Overall group-level changes in lipid and lipoprotein concentrations are shown in Table 3 and Figures 3, 4, 5, 6, and 7. One outlier for changes in TC was deleted from the model [9]. Statistically significant intervention minus control improvements were found for TC, TC : HDL-C, LDL-C, and TG, but not for HDL-C. Changes were equivalent to relative improvements of 6.0%, 10.4%, 5.1%, and 12.6%, respectively, for TC, TC : HDL-C, LDL-C, and TG. A nonsignificant decrease of 0.8% was observed for HDL-C. A medium to large amount of heterogeneity was found for all lipid and lipoprotein outcomes and all prediction intervals encompassed zero (0). When adjusted for publication bias, changes in TG remained significant (, −10.3 mg/dL, 95% CI, −18.9, −1.8). No adjustment for publication bias was needed for any other lipid and lipoprotein outcome. With each study deleted from the model once, the significance/nonsignificance of results did not change. Cumulative meta-analysis, ranked by year, demonstrated that changes have remained significant since 1989 for TC, 1991 for TC : HDL-C and TG, 2002 for LDL-C while changes in HDL-C have continued to be nonsignificant since the first included study in 1986. The direction of results did not change when studies with multiple groups were collapsed so that only one ES represented each study (Table 4). However, the amount of heterogeneity was reduced to a nonsignificant value for TC : HDL-C.
Table 3.
Changes in primary and secondary outcomes (group level).
| Variable | Studies (#) | Participants (#) | ES (#) | (95% CI) | Q(P) | I2 (%) | 95% PI |
|---|---|---|---|---|---|---|---|
| Primary outcomes | |||||||
| TC (mg/dL) | 11 | 820 | 13 | −12.8 (−19.9, −5.7)* | 65.2 (<0.001)* | 81.6 | −38.6, 13.1 |
| HDL-C (mg/dL) | 11 | 820 | 13 | −0.4 (−2.3, 1.6) | 60.6 (<0.001)* | 80.2 | −7.6, 6.8 |
| TC : HDL-C | 6 | 383 | 8 | −0.5 (−0.8, −0.1)* | 46.6 (<0.001)* | 85.0 | −1.7, 0.7 |
| LDL-C (mg/dL) | 10 | 783 | 12 | −6.8 (−11.8, −1.8)* | 36.8 (<0.001)* | 70.0 | −23.3, 9.7 |
| TG (mg/dL) | 11 | 820 | 13 | −13.1 (−21.3, −5.0)* | 59.2 (<0.001)* | 79.7 | −39.1, 12.9 |
| Secondary outcomes | |||||||
| Body weight (kg) | 10 | 423 | 12 | −5.2 (−7.3, −3.0)* | 134.2 (<0.001)* | 91.8 | −13.3, 3.0 |
| BMI (kg/m2) | 8 | 197 | 8 | −1.4 (−1.7, −1.0)* | 10.7 (0.2) | 34.4 | −2.2, −0.53* |
| VO2max (mL·kg−1·min−1) | 5 | 182 | 7 | 4.8 (2.0, 7.6)* | 123.9 (<0.001)* | 95.2 | −5.3, 14.9 |
| Kilocalories (total) | 6 | 389 | 7 | −417 (−515, −320)* | 7.7 (0.3) | 21.6 | −619, −216* |
| Carbohydrates (%) | 5 | 240 | 5 | 2.8 (0.8, 4.7)* | 88.1 (<0.001)* | 95.5 | −4.3, 9.9 |
| Total fat (%) | 7 | 343 | 8 | −4.1 (−6.3, −1.8)* | 286.2 (<0.001)* | 97.6 | −12.0, 3.9 |
| Saturated fat (%) | 4 | 160 | 5 | −6.2 (−5.4, −0.9)* | 246.1 (<0.001)* | 98.4 | −13.9, 6.9 |
| Cholesterol (mg) | 4 | 153 | 5 | −130 (−165, −96)* | 5.8 (0.2) | 31.6 | −221, −40* |
Notes. ES, effect sizes; #, number for which data were available; (95% CI), mean and 95% confidence interval; Q(P), Cochran's Q statistic for heterogeneity and alpha value; I2 (%), percent inconsistency statistic; 95% PI, 95% prediction intervals for a new study; *, statistically significant; TC, total cholesterol; HDL-C, high-density lipoprotein cholesterol; TC : HDL-C, TC : HDL-C ratio; LDL-C, low-density lipoprotein cholesterol; TG, triglycerides; BMI, body mass index; VO2max, maximum oxygen consumption; %, percentage of total kilocalorie intake. To convert TC, HDL-C, and LDL-C from mg/dL to mmol, divide by 38.46; to convert TG from mg/dL to mmol, divide by 87.72.
Figure 3.
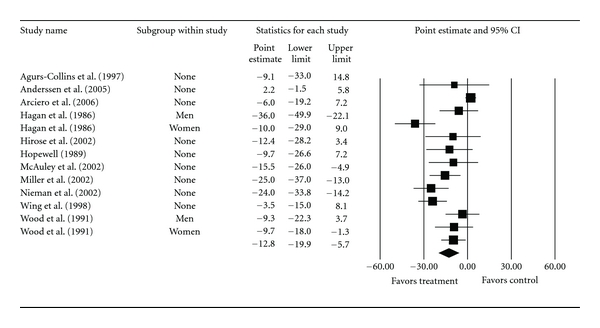
Forest plot for changes in TC (mg/dL).
Figure 4.
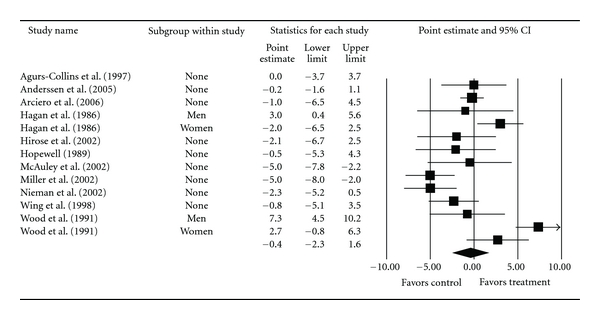
Forest plot for changes in HDL-C (mg/dL).
Figure 5.
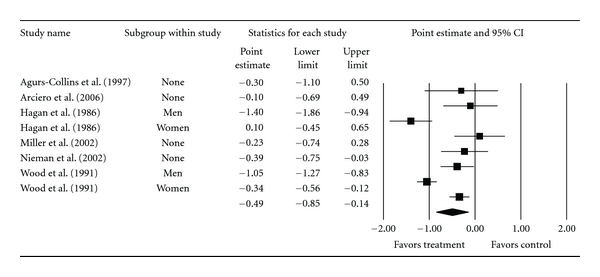
Forest plot for changes in TC : HDLC.
Figure 6.
Forest plot for changes in LDL-C (mg/dL).
Figure 7.
Forest plot for changes in TG (mg/dL).
Table 4.
Changes in primary and secondary outcomes (study level).
| Variable | Studies (#) | Participants (#) | ES (#) | (95% CI) | Q(P) | I2 (%) | 95% PI |
|---|---|---|---|---|---|---|---|
| Primary outcomes | |||||||
| TC (mg/dL) | 11 | 820 | 11 | −12.6 (−20.1, −5.1)* | 60.5 (<0.001)* | 83.5 | −38.8, 13.6 |
| HDL-C (mg/dL) | 11 | 820 | 11 | −0.8 (−2.8, 1.2) | 53.0 (<0.001)* | 81.1 | −21.3, 19.7 |
| TC : HDL-C | 6 | 383 | 6 | −0.5 (−0.7, −0.3)* | 9.1 (0.11) | 45.0 | −1.1, 0.1 |
| LDL-C (mg/dL) | 10 | 783 | 10 | −6.8 (−11.8, −1.8)* | 30.4 (<0.001)* | 70.4 | −22.6, 9.1 |
| TG (mg/dL) | 11 | 820 | 11 | −10.6 (−18.8, −2.4)* | 48.1 (<0.001)* | 79.2 | −35.4, 14.3 |
| Secondary outcomes | |||||||
| Body weight (kg) | 10 | 423 | 10 | −4.3 (−6.6, −2.0)* | 125.3 (<0.001)* | 92.8 | −12.7, 4.0 |
| BMI (kg/m2) | 8 | 197 | 8 | −1.4 (−1.7, −1.0)* | 10.7 (0.2) | 34.4 | −2.2, −0.53* |
| VO2max(mL·kg−1·min−1) | 5 | 182 | 5 | 3.6 (0.3, 7.0)* | 121.4 (<0.001)* | 96.7 | −9.4, 16.6 |
| Kilocalories (total) | 6 | 389 | 6 | −405 (−512, −298)* | 7.3 (0.2) | 32.0 | −660, −150* |
| Carbohydrates (%) | 5 | 240 | 5 | 2.8 (0.8, 4.7)* | 88.1 (<0.001)* | 95.5 | −4.3, 9.9 |
| Total fat (%) | 7 | 343 | 7 | −3.5 (−5.8, −1.1)* | 284.7 (<0.001)* | 97.9 | −11.9, 4.9 |
| Saturated fat (%) | 4 | 160 | 4 | −3.5 (−6.4, −0.5)* | 245.8 (<0.001)* | 98.8 | −17.9, 11.0 |
| Cholesterol (mg) | 4 | 153 | 4 | −127 (−153, −101)* | 1.1 (0.8) | 0 | −185, −69* |
Notes. ES, effect sizes; #, number for which data were available; (95% CI), mean and 95% confidence interval; Q(P), Cochran's Q statistic for heterogeneity and alpha value; I2 (%), percent inconsistency statistic; 95% PI, 95% prediction intervals for a new study; *, statistically significant; TC, total cholesterol; HDL-C, high-density lipoprotein cholesterol; TC : HDL-C, TC : HDL-C ratio; LDL-C, low-density lipoprotein cholesterol; TG, triglycerides; BMI, body mass index; VO2max, maximum oxygen consumption; %, percentage of total kilocalorie intake. To convert TC, HDL-C, and LDL-C from mg/dL to mmol, divide by 38.46; to convert TG from mg/dL to mmol, divide by 87.7.
Meta-regression results are shown in Table 5. For TC, shorter interventions and greater decreases in body weight and BMI were associated with larger reductions in TC. Greater increases in HDL-C were associated with larger increases in VO2max and greater decreases in kilocalories. For TC : HDL-C, larger decreases were associated with being male, having higher baseline values of TC : HDL-C and greater reductions in bodyweight and kilocalories. Greater reductions in LDL-C were correlated with shorter interventions as well as larger decreases in bodyweight and BMI. Larger reductions in TG were associated with younger age, higher initial TG levels, and greater decreases in bodyweight. No other statistically significant associations were observed.
Table 5.
Metaregression results for changes in lipid and lipoprotein concentrations.
| Variable | Studies (#) | Participants (#) | ES (#) | β1 (95% CI) | R | R2 |
|---|---|---|---|---|---|---|
| TC | ||||||
| Age (years) | 10 | 810 | 12 | 0.4 (−0.4, 1.3) | .33 | .11 |
| Gender | 6 | 574 | 8 | −0.57 (−20.9, 19.8) | .03 | <.01 |
| Initial TC (mg/dL) | 11 | 820 | 13 | 0.2 (−0.2, 0.5) | .28 | .08 |
| Intervention (wks) | 11 | 820 | 13 | 0.1 (0.05, 0.2)* | .74 | .55 |
| Δ Body weight (kg) | 9 | 758 | 10 | 2.1 (0.8, 3.5)* | .73 | .54 |
| Δ BMI (kg/m2) | 7 | 325 | 7 | 10.1 (3.2, 17.0)* | .83 | .69 |
| Δ VO2max (mL·kg−1·min−1) | 5 | 313 | 7 | −0.9 (−3.4, 1.6) | .31 | .10 |
| Δ Kilocalories | 6 | 389 | 7 | 0.02 (−0.03, 0.06) | .32 | .10 |
| Δ Total fat (%) | 7 | 654 | 8 | 0.9 (−0.4, 2.2) | .56 | .31 |
| Δ Saturated fat (%) | 4 | 304 | 5 | 0.4 (−3.5, 4.3) | .12 | .02 |
| Δ Cholesterol (mg) | 4 | 292 | 5 | −0.1 (−0.3, 0.2) | .27 | .07 |
| HDL-C | ||||||
| Age (years) | 10 | 810 | 12 | −0.2 (−0.4, 0.1) | .41 | .17 |
| Gender | 6 | 574 | 8 | −4.0 (−8.9, 0.9) | .62 | .38 |
| Initial HDL-C (mg/dL) | 11 | 820 | 13 | −0.1 (−0.4, 0.2) | .20 | .04 |
| Intervention (wks) | 11 | 820 | 13 | 0.01 (−0.03, 0.05) | .18 | .03 |
| Δ Body weight (kg) | 10 | 810 | 12 | −0.5 (−1.0, 0.1) | .52 | .27 |
| Δ BMI (kg/m2) | 7 | 325 | 7 | 0.7 (−1.9, 3.4) | .25 | .06 |
| Δ VO2max (mL·kg−1·min−1) | 4 | 313 | 6 | 0.9 (0.2, 1.5)* | .75 | .56 |
| Δ Kilocalories | 6 | 389 | 7 | −0.02 (−.04, −0.001)* | .73 | .53 |
| Δ Total fat (%) | 7 | 654 | 8 | −0.2 (−0.8, 0.4) | .25 | .06 |
| Δ Saturated fat (%) | 4 | 304 | 5 | 0.6 (−1.6, 2.8) | .44 | .19 |
| Δ Cholesterol (mg) | 4 | 292 | 5 | −0.05 (−0.1, 0.03) | .54 | .29 |
| TC : HDL-C | ||||||
| Age (years) | 6 | 383 | 8 | 0.02 (−0.02, 0.06) | .30 | .09 |
| Gender | 3 | 252 | 5 | 0.9 (0.5, 1.2)* | .93 | .87 |
| Initial TC : HDL (mg/dL) | 4 | 180 | 5 | −0.9 (−1.6, −0.1)* | .77 | .60 |
| Intervention (wks) | 6 | 383 | 8 | −0.01, (−0.03, 0.01) | .28 | .08 |
| Δ Body weight (kg) | 6 | 383 | 8 | 0.1 (0.1, 0.2)* | .81 | .66 |
| Δ BMI (kg/m2) | 4 | 175 | 4 | 0.1 (−0.2, 0.5) | .81 | .66 |
| Δ VO2max (mL·kg−1·min−1) | 2 | 208 | 4 | −0.2 (−0.9, 0.4) | .38 | .14 |
| Δ Kilocalories | 4 | 292 | 5 | 0.005 (0.002,0.007)* | .92 | .85 |
| Δ Total fat (%) | 4 | 292 | 5 | 0.01 (−0.02, 0.1) | .74 | .54 |
| Δ Saturated fat (%) | 3 | 261 | 4 | 0.1 (−0.2, 0.4) | ..51 | .26 |
| Δ Cholesterol (mg) | 4 | 292 | 5 | −0.0002 (−0.002, 0.002) | .12 | .02 |
| LDL-C | ||||||
| Age (years) | 9 | 773 | 11 | 0.4 (−0.1, 1.0) | .43 | .18 |
| Gender | 4 | 262 | 6 | 3.2 (−10.5, 17.0) | .21 | .04 |
| Initial LDL-C (mg/dL) | 10 | 783 | 12 | 0.3 (−0.02, 0.52) | .49 | .24 |
| Intervention (wks) | 10 | 783 | 12 | 0.06 (0.01, 0.12)* | .58 | .34 |
| Δ Body weight (kg) | 9 | 773 | 11 | 1.4 (0.5, 2.4)* | .67 | .45 |
| Δ BMI (kg/m2) | 6 | 290 | 6 | 8.6 (2.5, 14.6)* | .81 | .66 |
| Δ VO2max (mL·kg−1·min−1) | 4 | 313 | 6 | −1.1 (−3.0, 0.8) | .46 | .21 |
| Δ Kilocalories | 5 | 355 | 6 | 0.02 (−0.02, 0.07) | .50 | .25 |
| Δ Total fat (%) | 6 | 620 | 7 | 0.5 (−0.6, 1.5) | .39 | .15 |
| Δ Saturated fat (%) | 4 | 304 | 5 | 0.2 (−2.7, 3.2) | .09 | .01 |
| Δ Cholesterol (mg) | 4 | 292 | 5 | −0.004 (−0.2, 0.2) | .03 | >.01 |
| TG | ||||||
| Age (years) | 10 | 810 | 12 | 1.5 (0.3, 2.7)* | 0.53 | 0.28 |
| Gender | 6 | 574 | 8 | 6.2 (−21.7, 34.0) | 0.13 | 0.02 |
| Initial TG (mg/dL) | 10 | 777 | 12 | −0.3 (−0.6, −0.1)* | 0.62 | 0.38 |
| Intervention (wks) | 11 | 820 | 13 | 0.1 (−0.1, 0.2) | 0.17 | 0.03 |
| Δ Body weight (kg) | 10 | 810 | 12 | 3.2 (1.1, 5.4)* | 0.59 | 0.35 |
| Δ BMI (kg/m2) | 7 | 325 | 7 | 0.2 (−21.2, 21.6) | .01 | <.001 |
| Δ VO2max (mL·kg−1·min−1) | 4 | 313 | 6 | −3.1 (−7.3, 1.2) | .49 | .24 |
| Δ Kilocalories | 6 | 389 | 7 | −0.02 (−0.1, 0.1) | .18 | .03 |
| Δ Total fat (%) | 6 | 620 | 7 | 1.5 (−0.4, 3.4) | .57 | .33 |
| Δ Saturated fat (%) | 4 | 304 | 5 | −2.7 (−8.5, 3.0) | .51 | .26 |
| Δ Cholesterol (mg) | 4 | 292 | 5 | −0.1 (−0.2, 0.4) | .39 | .15 |
Notes. ES, effect sizes; #, number for which data were available; Δ, ES change for outcome; β1 (95% CI), slope and 95% confidence interval; *, statistically significant.
3.7.2. Secondary Outcomes
Overall group-level changes for body weight, BMI, cardiorespiratory fitness, and diet outcomes are shown in Table 3. Statistically significant intervention minus control group improvements were found for bodyweight, BMI, VO2max in mL·kg−1·min−1, kilocalories, carbohydrates, total fat, saturated fat, and cholesterol intake. Changes were equivalent to relative improvements of 6.1%, 4.4%, 15.9%, 18.9%, 5.7%, 11.7%, 26.8%, and 41.6%, respectively, for bodyweight, BMI, VO2max in mL·kg−1·min−1, kilocalories, carbohydrates, total fat, saturated fat, and cholesterol intake. A small amount of heterogeneity was found for changes in BMI, kilocalories, and cholesterol intake while a large amount was observed for body weight, VO2max in mL·kg−1·min−1, carbohydrates, total fat and saturated fat intake. Nonoverlapping prediction intervals for estimating what results could have been expected if a new trial was conducted were observed for BMI, kilocalories and cholesterol intake. Prediction intervals for all other secondary outcomes included zero (0). No adjustment for publication bias was needed for any secondary outcomes. With each study deleted from the model once, results remained significant for body weight, BMI, relative VO2max, kilocalories, total fat, saturated fat, and cholesterol but not for carbohydrates. Cumulative meta-analysis, ranked by year, demonstrated that changes have remained significant since 1986 for body weight and VO2max in mL·kg−1·min−1, 1991 for kilocalorie and cholesterol intake, 1994 for BMI, 2002 for total and saturated fat, and 2005 for carbohydrates. When studies with multiple groups were collapsed so that only one ES represented each study, overall changes as well as heterogeneity and prediction intervals did not change significantly for any of the outcomes (Table 4). Meta-regression results revealed no statistically significant association between gender and changes in body weight, (β1, 1.0, 95% CI, −6.9, 8.8), kilocalories (β1, 168, 95% CI, −176, 513), total fat (β1, 0.2, 95% CI, −9.3, 9.7), or saturated fat (β1, 0.2, 95% CI, −9.3, 9.7). Greater reductions in cholesterol intake were associated with being male (β1, 77.2, 95% CI, 5.2, 149.2).
4. Discussion
The current findings suggest that concurrent aerobic exercise and diet are associated with improvements in TC, TC : HDL-C, LDL-C, and TG, but not HDL-C in overweight and obese adults. Given the low baseline levels, the decreases observed for TG may be especially noteworthy. The lack of increase in HDL-C, despite an increase in aerobic capacity, may have been the result of decreases in total fat intake and weight loss. However, this would need to be tested in a large, well-designed, randomized controlled trial before any firm conclusions could be drawn.
Improvements remained robust when each study was deleted from the model once. In addition, results have been statistically significant since at least 2002. Furthermore, these findings appear to be more pronounced than those achieved with aerobic exercise or diet alone. For example, previous meta-analytic work addressing the independent effects of aerobic exercise on lipid and lipoprotein concentrations in overweight and obese adults reported statistically significant decreases in TG but not TC, HDL-C or LDL-C after sensitivity analyses were applied [36]. Another meta-analysis that examined the effects of cholesterol-lowering diets on TC alone reported a statistically significant reduction of 5.7% [37]. This compares to the approximate 8.2% reduction observed in the current investigation. However, this prior meta-analysis did not appear to be limited to overweight and obese adults and excluded trials aimed primarily at lowering body weight [37].
The findings of the current investigation appear to be clinically important. Using data from previous research, the improvements in lipids and lipoproteins observed in the current meta-analysis would be equivalent to relative risk reductions in all-cause and coronary heart disease mortality of 5.7% and 8.0%, respectively, for TC and 2.8% and 5.0% for LDL-C [38] while reductions in TC : HDL-C would equate to a an approximate 12.4% decrease in the relative risk of mortality from ischemic heart disease [39]. For TG, the observed decreases would be equivalent to a relative risk reduction of 6.4% in coronary heart disease mortality [40]. The decreases observed for LDL-C may be especially important given that LDL-C is currently the primary target of lipid-lowering therapy in adults [5].
Although the overall results of the current meta-analysis suggest that a combined program of aerobic exercise and diet improves TC, TC : HDL-C, LDL, and TG, a moderate to large amount of heterogeneity and inconsistency was observed for all lipid and lipoprotein outcomes. Given these findings and despite the fact that a random-effects model that incorporates heterogeneity into the analysis was used, the generalization of results may not be appropriate [27]. However, the use of such statistics to decide what comprises true heterogeneity and inconsistency is rather arbitrary in nature, and thus, should be viewed with caution [41]. Another issue has to do with the fact that all prediction intervals for estimating the expected results of a new trial included zero for all lipid and lipoprotein outcomes. However, these values should not be confused with confidence intervals since prediction intervals are based on a random mean effect while confidence intervals are not [35].
Meta-regression analyses resulted in several statistically significant associations, most notably, the association between decreases in bodyweight with reductions in TC, TC : HDL-C, LDL-C, and TG. However, while an important first step, all reported meta-regression analyses should be viewed with caution. For example, the investigative team was unable to conduct any type of multiple meta-regression analyses because of the small number of ESs as well as missing data for different variables from different studies, a common occurrence in meta-analysis. Consequently, the potential for confounding exists. In addition, because of the large number of statistical tests conducted, one or more of the statistically significant findings could have been due to chance. Given the former, the validity of the associations observed in the current meta-analysis would need to be tested in large, well-designed randomized controlled trials.
The significant changes observed for bodyweight and BMI as well as VO2max in mL·kg−1·min−1 suggest that a combined aerobic exercise and diet regimen results in improvements beyond those for lipid and lipoprotein concentrations in overweight and obese adults. This reinforces the investigative team's perspective that it is highly unlikely that any pharmacologic intervention will ever be developed that targets as many risk factors as a combined program of aerobic exercise and diet. In addition, aerobic exercise and diet may synergistically improve the effects pharmacologic therapies such as HMG-CoA reductase inhibitors (statins) [5]. Finally, the significant reductions observed for kilocalories, total fat, saturated fat, and cholesterol suggest good adherence to the different diet regimens employed.
The small amount of heterogeneity and inconsistency as well as non-overlapping prediction intervals for BMI, kilocalories, and cholesterol intake provide greater credence and applicability of these outcomes with respect to the effects of aerobic exercise and diet in overweight and obese adults. For example, prediction intervals may be more relevant from a practical perspective since they provide an approximation of the expected treatment effect in a new trial [35]. However, the representativeness of the results for all secondary outcome analyses may need to be interpreted with caution since they were only included if data for the primary outcomes (lipids and lipoproteins) were available.
The overall reporting and conduct of randomized controlled trials on this topic could be improved. First, information on study design characteristics, including allocation concealment, incomplete data (dropouts, reasons for dropping out, adverse events), and incomplete outcome reporting should be provided. For incomplete outcome reporting, the inclusion of the study identification protocol number would be especially helpful to readers. In addition, since part of the intervention includes exercise, only those participants not engaged in a regular exercise program prior to enrollment should be included since prior exercise may diminish the effects of the intervention. Furthermore, all of the studies used a per-protocol approach in the analysis of their data. Given the former, the investigative team suggests that future studies report data using both the per-protocol and intention-to-treat approach. Second, the reporting of selected participant characteristics could be improved. This includes data on race/ethnicity, medication use before and during the intervention, cigarette smoking, and alcohol consumption, as well as any changes in physical activity, void of the exercise intervention, which occurred during the study. Third, in order to examine dose-response effects, additional information regarding the aerobic exercise and diet intervention should be provided. For aerobic exercise, data on the duration and intensity of the intervention as well as compliance to the exercise protocol should be provided. In addition, the provision of data on energy expenditure is also recommended. With respect to the diet intervention, complete data should be provided on the intake of kilocalories, protein, total fat, saturated fat, transfat, and cholesterol. Fourth, additional lipid assessment data that includes the number of hours in which subjects refrained from exercise prior to lipid testing, season(s) in which lipids were assessed and whether assessment of LDL-C occurred using the direct or indirect method should be included. Fifth, since non-HDL-C has been shown to be a better predictor of cardiovascular morbidity and mortality than LDL-C [42, 43], the calculation of non-HDL-C from TC and HDL-C, including dispersion statistics is recommended. Given their potential association with changes in lipid and lipoprotein concentrations, data on percent body fat as well as lean body mass would also be helpful.
Finally, the primary purpose of this important meta-analysis was to focus on the combined versus independent effects of aerobic exercise and diet on lipids and lipoproteins in overweight and obese adults. The rationale for this approach was based on the fact that both are recommended in tandem for improving the lipid-lipoprotein profile of adults [5]. Given this study design, we were unable to determine the independent effects of each on the lipid-lipoprotein profile. Therefore, future meta-analytic research should examine the independent effects of aerobic exercise and diet for improving the lipid-lipoprotein profile of overweight and obese adults.
In conclusion, the overall results of this study suggest that a combined program of aerobic exercise and diet is associated with improvements in TC, LDL-C, TC : HDL-C and TG, but Not HDL-C, in overweight and obese adults. However, additional, well-designed randomized controlled trials on this topic are needed.
Conflict of Interests
The authors declare no conflict of interests.
Acknowledgment
This study was supported by Grant R01 HL069802 from the National Institutes of Health, National Heart, Lung, and Blood Institute (G. A. Kelley, principal investigator).
References
- 1.World Health Organization. Obesity and Overweight, 2011, http://www.who.int/mediacentre/factsheets/fs311/en/index.html.
- 2.Ogden CL, Carroll MD. Prevalence of Overweight, Obesity, and Extreme Obesity Among Adults: United States, Trends 1976–1980 Through 2007-2008. National Center for Health Statistics; 2010. [Google Scholar]
- 3.Lloyd-Jones D, Adams RJ, Brown TM, et al. Executive summary: heart disease and stroke statistics-2010 update: a report from the american heart association. Circulation. 2010;121(7):e46–e215. doi: 10.1161/CIRCULATIONAHA.109.192667. [DOI] [PubMed] [Google Scholar]
- 4.Mokdad AH, Ford ES, Bowman BA, et al. Prevalence of obesity, diabetes, and obesity-related health risk factors, 2001. Journal of the American Medical Association. 2003;289(1):76–79. doi: 10.1001/jama.289.1.76. [DOI] [PubMed] [Google Scholar]
- 5.National Cholesterol Education Program, National Heart Lung and Blood Institute and National Institutes of Health. Third report of the National Cholesterol Education Program (NCEP) expert panel on detection, evaluation, and treatment of high blood cholesterol in adults (adult treatment panel III) final report. Circulation. 2002;106:3143–3421. [PubMed] [Google Scholar]
- 6.Agurs-Collins TD, Kumanyika SK, Ten Have TR, Adams-Campbell LL. A randomized controlled trial of weight reduction and exercise for diabetes management in older African-American subjects. Diabetes Care. 1997;20(10):1503–1511. doi: 10.2337/diacare.20.10.1503. [DOI] [PubMed] [Google Scholar]
- 7.Anderssen SA, Hjelstuen AK, Hjermann I, Bjerkan K, Holme I. Fluvastatin and lifestyle modification for reduction of carotid intima-media thickness and left ventricular mass progression in drug-treated hypertensives. Atherosclerosis. 2005;178(2):387–397. doi: 10.1016/j.atherosclerosis.2004.08.033. [DOI] [PubMed] [Google Scholar]
- 8.Arciero PJ, Gentile CL, Martin-Pressman R, et al. Increased dietary protein and combined high intensity aerobic and resistance exercise improves body fat distribution and cardiovascular risk factors. International Journal of Sport Nutrition and Exercise Metabolism. 2006;16(4):373–392. doi: 10.1123/ijsnem.16.4.373. [DOI] [PubMed] [Google Scholar]
- 9.Avila P, Hovell MF. Physical activity training for weight loss in Latinas: a controlled trial. International Journal of Obesity. 1994;18(7):476–482. [PubMed] [Google Scholar]
- 10.Hagan RD, Upton SJ, Wong L, Whittam J. The effects of aerobic conditioning and/or caloric restriction in overweight men and women. Medicine and Science in Sports and Exercise. 1986;18(1):87–94. [PubMed] [Google Scholar]
- 11.Hirose K, Tajima K, Miura S. A model obesity control program focusing on a healthy diet and gentle exercise in Aichi cancer center hospital. Asian Pacific Journal of Cancer Prevention. 2002;3:149–154. [PubMed] [Google Scholar]
- 12.Hopewell R. The effect of fiber and exercise on weight loss and blood lipids in moderately overweight women. West Virginia University; 1989. dissertation. [Google Scholar]
- 13.McAuley KA, Williams SM, Mann JI, et al. Intensive lifestyle changes are necessary to improve insulin sensitivity: a randomized controlled trial. Diabetes Care. 2002;25(3):445–452. doi: 10.2337/diacare.25.3.445. [DOI] [PubMed] [Google Scholar]
- 14.Miller ER, Erlinger TP, Young DR, et al. Results of the diet, exercise, and weight loss intervention trial (DEW-IT) Hypertension. 2002;40(5):612–618. doi: 10.1161/01.hyp.0000037217.96002.8e. [DOI] [PubMed] [Google Scholar]
- 15.Nieman DC, Brock DW, Butterworth D, Utter AC, Nieman CC. Reducing diet and/or exercise training decreases the lipid and lipoprotein risk factors of moderately obese women. Journal of the American College of Nutrition. 2002;21(4):344–350. doi: 10.1080/07315724.2002.10719233. [DOI] [PubMed] [Google Scholar]
- 16.Wing RR, Venditti E, Jakicic JM, Polley BA, Lang W. Lifestyle intervention in overweight individuals with a family history of diabetes. Diabetes Care. 1998;21(3):350–359. doi: 10.2337/diacare.21.3.350. [DOI] [PubMed] [Google Scholar]
- 17.Wood PD, Stefanick ML, Williams PT, Haskell WL. The effects on plasma lipoproteins of a prudent weight-reducing diet, with or without exercise, in overweight men and women. The New England Journal of Medicine. 1991;325(7):461–466. doi: 10.1056/NEJM199108153250703. [DOI] [PubMed] [Google Scholar]
- 18.Hedges LV, Olkin I. Vote-counting methods in research synthesis. Psychological Bulletin. 1980;88(2):359–369. [Google Scholar]
- 19.Sacks HS, Berrier J, Reitman D. Meta-analyses of randomized controlled trials. The New England Journal of Medicine. 1987;316(8):450–455. doi: 10.1056/NEJM198702193160806. [DOI] [PubMed] [Google Scholar]
- 20.Liberati A, Altman DG, Tetzlaff J, et al. The PRISMA statement for reporting systematic reviews and meta-analyses of studies that evaluate health care interventions: explanation and elaboration. Annals of Internal Medicine. 2009;151(4):W-65–W-94. doi: 10.7326/0003-4819-151-4-200908180-00136. [DOI] [PubMed] [Google Scholar]
- 21.Mann GV, Teel K, Hayes O, McNally A, Bruno D. Exercise in the disposition of dietary calories: regulation of serum lipoprotein and cholesterol levels in human subjects. The New England Journal of Medicine. 1955;253:349–355. doi: 10.1056/NEJM195509012530901. [DOI] [PubMed] [Google Scholar]
- 22.Physical Activity Guidelines Advisory Committee. Physical Activity Guidelines Advisory Report. Washington, DC, USA: U.S. Department of Health and Human Services; 2008. [Google Scholar]
- 23.Schulz KF, Chalmers L, Hayes RJ, Altman DG. Empirical evidence of bias: dimensions of methodological quality associated with estimates of treatment effects in controlled trials. Journal of the American Medical Association. 1995;273(5):408–412. doi: 10.1001/jama.273.5.408. [DOI] [PubMed] [Google Scholar]
- 24.Emerson JD, Burdick E, Hoaglin DC, Mosteller F, Chalmers TC. An empirical study of the possible relation of treatment differences to quality scores in controlled randomized clinical trials. Controlled Clinical Trials. 1990;11(5):339–352. doi: 10.1016/0197-2456(90)90175-2. [DOI] [PubMed] [Google Scholar]
- 25.Jüni P, Witschi A, Bloch R, Egger M. The hazards of scoring the quality of clinical trials for meta-analysis. Journal of the American Medical Association. 1999;282(11):1054–1060. doi: 10.1001/jama.282.11.1054. [DOI] [PubMed] [Google Scholar]
- 26.Ahn S, Becker BJ. Incorporating quality scores in meta-analysis. Journal of Educational and Behavioral Statistics. 2011;36(5):555–585. [Google Scholar]
- 27.Higgins JPT, Green S. 2009 Cochrane Handbook for Systematic Reviews of Interventions (version 5.0.2) 2009. [Google Scholar]
- 28.Follmann D, Elliott P, Suh I, Cutler J. Variance imputation for overviews of clinical trials with continuous response. Journal of Clinical Epidemiology. 1992;45(7):769–773. doi: 10.1016/0895-4356(92)90054-q. [DOI] [PubMed] [Google Scholar]
- 29.DerSimonian R, Laird N. Meta-analysis in clinical trials. Controlled Clinical Trials. 1986;7(3):177–188. doi: 10.1016/0197-2456(86)90046-2. [DOI] [PubMed] [Google Scholar]
- 30.Hunter JE, Schmidt FL. Fixed effects vs. random effects meta-analysis models: implications for cumulative research knowledge. International Journal of Selection and Assessment. 2000;8(4):275–292. [Google Scholar]
- 31.Cochran WG. The combination of estimates from different experiments. Biometrics. 1954;10:101–129. [Google Scholar]
- 32.Higgins JPT, Thompson SG, Deeks JJ, Altman DG. Measuring inconsistency in meta-analyses. British Medical Journal. 2003;327(7414):557–560. doi: 10.1136/bmj.327.7414.557. [DOI] [PMC free article] [PubMed] [Google Scholar]
- 33.Duval S, Tweedie R. Trim and fill: a simple funnel-plot-based method of testing and adjusting for publication bias in meta-analysis. Biometrics. 2000;56(2):455–463. doi: 10.1111/j.0006-341x.2000.00455.x. [DOI] [PubMed] [Google Scholar]
- 34.Lau J, Schmid CH, Chalmers TC. Cumulative meta-analysis of clinical trials builds evidence for exemplary medical care. Journal of Clinical Epidemiology. 1995;48(1):45–57. doi: 10.1016/0895-4356(94)00106-z. [DOI] [PubMed] [Google Scholar]
- 35.Higgins JPT, Thompson SG, Spiegelhalter DJ. A re-evaluation of random-effects meta-analysis. Journal of the Royal Statistical Society Series A. 2009;172(1):137–159. doi: 10.1111/j.1467-985X.2008.00552.x. [DOI] [PMC free article] [PubMed] [Google Scholar]
- 36.Kelley GA, Kelley KS, Vu Tran Z. Aerobic exercise, lipids and lipoproteins in overweight and obese adults: a meta-analysis of randomized controlled trials. International Journal of Obesity. 2005;29(8):881–893. doi: 10.1038/sj.ijo.0802959. [DOI] [PMC free article] [PubMed] [Google Scholar]
- 37.Tang JL, Armitage JM, Lancaster T, Silagy CA, Fowler GH, Neil HAW. Systematic review of dietary intervention trials to lower blood total cholesterol in free-living subjects. British Medical Journal. 1998;316(7139):1213–1219. doi: 10.1136/bmj.316.7139.1213. [DOI] [PMC free article] [PubMed] [Google Scholar]
- 38.Gould AL, Davies GM, Alemao E, Yin DD, Cook JR. Cholesterol reduction yields clinical benefits: meta-analysis including recent trials. Clinical Therapeutics. 2007;29(5):778–794. doi: 10.1016/j.clinthera.2007.05.012. [DOI] [PubMed] [Google Scholar]
- 39.Lewington S, Whitlock G, Clarke R, et al. Blood cholesterol and vascular mortality by age, sex, and blood pressure: a meta-analysis of individual data from 61 prospective studies with 55,000 vascular deaths. The Lancet. 2007;370:1829–1839. doi: 10.1016/S0140-6736(07)61778-4. [DOI] [PubMed] [Google Scholar]
- 40.He Y, Lam TH, Li LS, Li LS, He SF, Liang BQ. Triglyceride and coronary heart disease mortality in a 24-year follow-up study in Xi’an, China. Annals of Epidemiology. 2004;14(1):1–7. doi: 10.1016/s1047-2797(03)00069-3. [DOI] [PubMed] [Google Scholar]
- 41.Bonett DG. Meta-analytic interval estimation for standardized and unstandardized mean differences. Psychological Methods. 2009;14(3):225–238. doi: 10.1037/a0016619. [DOI] [PubMed] [Google Scholar]
- 42.Cui Y, Blumenthal RS, Flaws JA, et al. Non-high-density lipoprotein cholesterol level as a predictor of cardiovascular disease mortality. Archives of Internal Medicine. 2001;161(11):1413–1419. doi: 10.1001/archinte.161.11.1413. [DOI] [PubMed] [Google Scholar]
- 43.Pischon T, Girman CJ, Sacks FM, Rifai N, Stampfer MJ, Rimm EB. Non-high-density lipoprotein cholesterol and apolipoprotein B in the prediction of coronary heart disease in men. Circulation. 2005;112(22):3375–3383. doi: 10.1161/CIRCULATIONAHA.104.532499. [DOI] [PubMed] [Google Scholar]