Abstract
The photodissociation and geminate recombination of nitric oxide in myoglobin, under continuous illumination, is modeled computationally. The relaxation of the photon energy into the protein matrix is also considered in a single simulation scheme that mimics a complete experimental setup. The dynamic approach to Non Equilibrium Molecular Dynamics is used, starting from a steady state, to compute its relaxation to equilibrium. Simulations are conducted for the native form of sperm whale myoglobin and for two other mutants, V68W and L29F, illustrating a fair diversity of spatial and temporal geminate recombination processes. Energy flow to the heme and immediate protein environment provide hints to allostery. In particular a pathway of energy flow between the heme and the FG loop is illustrated. Although the simulations were conducted for myoglobin only, the thermal fluctuations of the FG corner are in agreement with the large structural shifts of FG during the allosteric transition of tetrameric hemoglobin.
1 Introduction
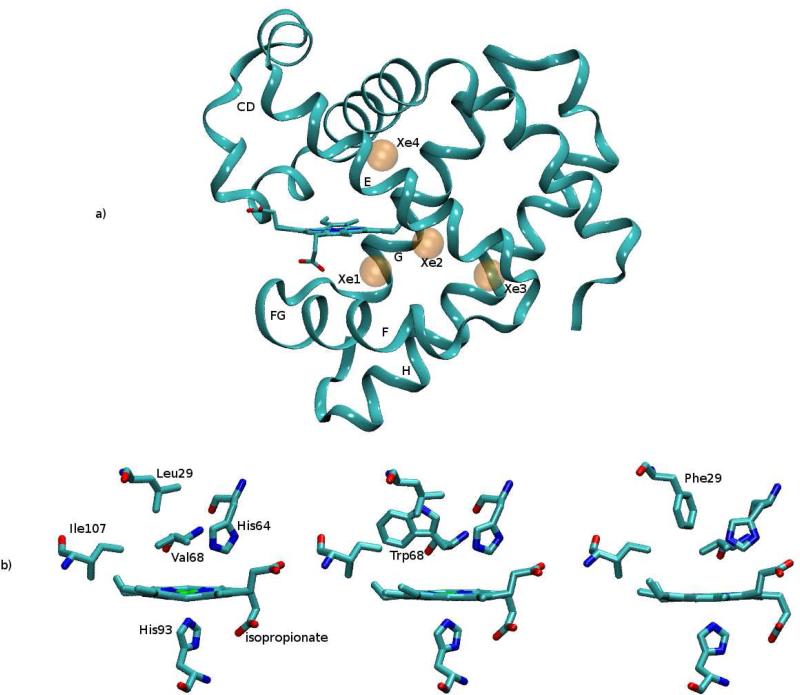
Sperm whale myoglobin is a small oxygen transport protein. It consists of 153 amino acids and a prosthetic heme group that binds small ligands (See Figure 1(a)). The physiological importance of myoglobin as a storage device of oxygen in muscles, and the empirical observation that it is stable and easy to handle experimentally, motivated the investigations of its structure, dynamics, and function. Indeed it was the focus of a large number of biophysical studies (for a book see1).
Figure 1.
(a) Myoglobin in ribbon representation, with the indication of the four xenon cavities (transparent orange spheres). Elements of secondary structure (helices E, F, G, H and loops CD and FG) are also indicated. (b) The heme pocket with the relevant residues lining the binding site (above the heme plane) and the proximal histidine (below the heme plane); the isopropionate side chains are also indicated. From left to right: native, V68W and L29F mutants (structures as in 1MBC.pdb, 20H9.pdb and 2G0R.pdb). Images were prepared with the VMD program.48
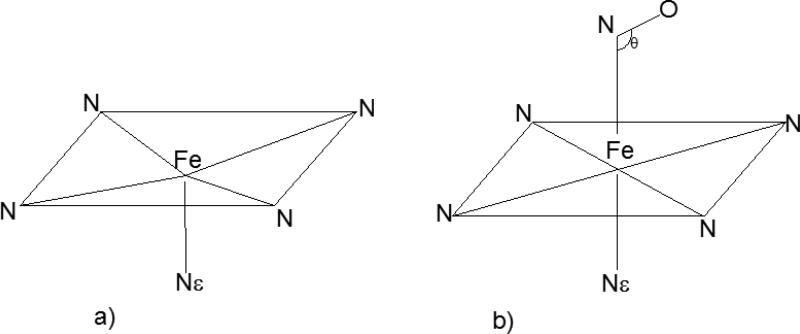
Of interest to the present manuscript are kinetic experiments. A typical kinetic set-up includes the application of a flash that breaks the bond between a small ligand (L) and the iron atom of the heme (H).2–9 After dissociation of the ligand the iron atom has only five coordinating groups instead of six, and is displaced out of the heme plane (see Figure 2(a)). The shift of the iron position changes the geometry of the heme and is detected spectroscopically. Eventually the heme acquires a replacement and reforms a bond with a ligand. The time scale and yield of bond re-formation is recorded and used to fit rate coefficients and equilibrium constants for the process.
Figure 2.
Sketch of the five (a) and six-coordinated (b) heme in Mb. The four pyrrole N atoms, the Fe atom and the closest nitrogen atom of the proximal hystidine (called Nε) are indicated.
Austin et al.4 pioneered the use of low temperature flash measurements and extended the experiments over a huge range of time scales. They observed the phenomenon of geminate recombination. A geminate recombination is the re-formation of the L-H bond between the same pair that was bonded before the flash. In other words the dissociated ligand does not leave the protein after the flash. It remains inside the protein matrix until activated diffusion brings it back to the heme group to which it rebinds. Alternatively the dissociated ligand may diffuse to the solvent in which it is lost (in practice) to the original heme group. Geminate recombination is particularly intriguing since the dissociated ligand hops between cavities inside the protein matrix and the delay in the experimentally observed recombination can be associated with time lost in the cavities before returning to the binding site.
Schematically we can describe the process using the following kinetic scheme:
| (1) |
The first state on the left (L-H) represents the ligand chemically bonded to the heme. The second, middle state, represents the geminate pair. The ligand in state (L · · · H) is still in the same protein matrix and did not have enough time to diffuse to the solvent. Finally the state on the right (L + H) is that of a ligand that escapes its original protein and is now in aqueous solution. The probability of an escaping ligand to return back to the same protein molecule is usually negligible. Rate constants of Eq. (1) and variants of this equation are fitted to experimental data. Most efforts were invested in modeling one component of the geminate process, the middle step of ligand diffusion in the protein matrix. Tilton et al.10 used a probe ligand to explore empty spaces in myoglobin and suggested plausible diffusion pathways. Elber and Karplus11 used a mean field theory to explore diffusion pathways of a diatomic ligand in a thermally fluctuating myoglobin. More recent investigations either applied Molecular Dynamics simulations directly,12,13 or estimated free energy surfaces for ligand diffusion with modern techniques such as TAMD,14 metadynamics,15,16 or particle insertion.17
Due to the loss of the diffusing ligand to solvent or to heme recombination, ligand diffusion is not an equilibrium process. Furthermore, the properties of the diffusive ligand are probed in the above recombination experiments indirectly, by fitting a nonlinear model of the kinetics to rebinding curves. In addition to kinetic curves of flash experiments, information on the average position of the ligand as a function of time is now available from time resolved crystallography.18–20 These beautiful experiments provide “real life” images of ligand diffusion pathways. However, they do not provide new information on kinetics and thermodynamics. The experiments confirmed diffusion pathways and the existence of empty cavities detected earlier by the simulations of Tilton et al.10 and Elber and Karplus.11 We can therefore conclude that the locations of plausible diffusion pathways and protein cavities, that delay ligand rebinding and/or escape, are explored adequately. The kinetic parameters of the process are still under debate. Different computations provide results with mild variations.6
Another important component of the process described by Eq. (1) is that of energy relaxation. The dissociation process pumps energy to the ligand and to the heme. The excess energy dissipates, and the flow of energy is of particular interest since it may be relevant to allosteric transitions in general and to the allosteric transition in hemoglobin in particular. While myoglobin is not an allosteric protein, the related protein hemoglobin is. Hemoglobin has four subunits, each subunit being highly homologous to myoglobin. The dissociation of a ligand in hemoglobin (by a flash or thermal activation) promotes an allosteric effect in which the relative packing of the subunits changes dramatically.21 The mechanism by which the dissociation of the ligand promotes the large structural change (the allosteric effect) is not known quantitatively. Myoglobin suggests a simple model system for the transfer of the signal (and energy) from the so called allosteric core,22 of a ligand bound to a heme, to the interface of the interacting subunits. The study of the spatial and temporal energy relaxation after bond dissociation is therefore of considerable interest.
Advanced spectroscopic techniques23–28 measure the rate at which the heme group loses its excess energy to the solvent. A computational model that explores geminate recombination of the ligand should also account correctly for the measured time scale of energy flow. Other investigators studied computationally energy relaxation and flow from excited heme.29–32 In particular Sagnella and Straub32 carefully evaluated many aspects of this process. They proposed an intriguing mechanism in which excess energy is passed to the isopropionate side chains of the heme (See Figure 1(b)) and from there transported to the solvent. This mechanism was supported by an experimental study,27 in which the isopropionate side chains were removed and the difference in the relaxation was recorded.
Finally the dynamics of bond formation and/or dissociation of a small ligand and the heme iron has been investigated in previous works.8,33–35 It is therefore a valid question, why do we want to return to model myoglobin? The motivation behind the present study is that these components were not put together in a single comprehensive simulation scheme, in which multiple measurements are brought together and accounted for in a single framework. Moreover, in the present paper we probe geminate recombination in a stationary non-equilibrium state. We consider a ligand (nitric oxide or NO) that can rebind to the heme iron extremely quickly (on the picosecond time scale). This time is comparable to the time scale of heme relaxation. The two processes are therefore coupled in time and presumably also in space. This is in contrast (for example) with the photodissociation of carbon monoxide for which the recombination time scale can exceed 100 nanoseconds. Another motivation to study NO is that nitric oxide binding is relevant to signaling processes in biology.
Experiments can be done with continuous illumination of the sample (or using long nanosecond pulses26). In that case, if the light is intense enough, nitric oxide may have sufficient time to absorb a photon, dissociate, rebind, and repeat the cycle numerous times. The continuous illumination creates a stationary non-equilibrium state of dissociated and bound heme-iron nitric-oxide pairs. The rapid rebinding of NO and its wide interest makes it well suited for non equilibrium Molecular Dynamics simulations. We therefore concentrate in this paper on the geminate recombination of nitric oxide to myoglobin. Such a stationary system should be studied with the tools of non-equilibrium molecular dynamics.36–40 Once the photon beam is turned off the system relaxes to its equilibrium state starting however from the stationary non-equilibrium initial conditions.
The non-equilibrium investigation described above is also useful for the investigation of the allosteric effect in hemoglobin. Hemoglobin is a tetramer, and each of the four globin chains (2 α chains and 2 β chains) resembles myoglobin. Early events of the allosteric process include dissociation of the ligand-heme bond and transmission of excess energy from the heme to the globin surface. Hence, the first step is internal and is unlikely to require communication between chains, making the myoglobin system a plausible model. By generating a steady state of photodissociated molecules, a significant amount of energy is pumped into the heme and its immediate environment. The excess energy is likely to provide a stronger signal to the mechanism of allosteric initiation and energy flow to the globin surface.
The paper is organized as follows. In Section 2 we describe the model for the geminate recombination under continuous illumination; in Section 3 we briefly describe the Dynamic Non Equilibrium Molecular Dynamics framework. In Section 4 the computational details are fully described. Results from the application to wild type myoglobin and two selected mutants are presented in Section 5. Finally, further steps are discussed in the Conclusions.
2 The Model
In the present manuscript we describe photodissociation and recombination processes of a small molecule (nitric oxide) with a heme group embedded in the protein myoglobin. To describe these molecular events we need at least two Born-Oppenheimer energy surfaces: the ground state and an excited state (reachable with the exciting photon), and a mechanism for transitions between the two surfaces. The motions on each of these surfaces are handled by standard Molecular Dynamics. We describe below the energy surfaces first, and then the switching mechanisms. The calculations are conducted with the molecular modeling program MOIL41 in which the algorithms discussed were implemented in full. MOIL is available for download from http://clsb.ices.utexas.edu/prebuilt/. The current model follows reference33 with only one significant addition. Previously we allowed for only a single event of photon absorption. Here we consider multiple occurrences of photon absorption, dissociation, and geminate recombination in a single trajectory. While the changes may seem small they are significant. They allow us to explore the build up of energy at the heme, examine multiple and correlated absorption of photons, and open the way for better description of non-equilibrium stationary states in biology and their relaxation. For completeness, we briefly describe the model. We refer the reader to the earlier publication33 for a list of the potential parameters.
2.1 Energy surfaces
In molecular modeling programs, the interactions between the atoms (protein, ligand, and solvent atoms) are typically described by a single Born-Oppenheimer (BO) energy surface. The single energy surface is usually represented by a sum of mechanical energy terms
| (2) |
where the terms (from left to right) are a summation of bonds, bond angles, torsions, improper torsions, van der Waals, and electrostatic interactions.
In the present paper we define two diabatic surfaces. The two surfaces are assumed to cross at a given distance between the iron atom and the nitrogen atom of the ligand. Most of the contributions to the energy surfaces follow Eq. (2). Moreover, a significant part of the contributions to the energy surfaces (e.g. those coming from water and the intra-protein parts which are outside the reaction site) is identical. The first diabatic surface, which we denote by Ud1, is the Born-Oppenheimer surface which corresponds to the ground state when the ligand, close to the iron, is bound to the heme. It is the state in which the system absorbs the photon. The second diabatic surface Ud2 is the surface that is reached once the photon is absorbed. We write:
| (3) |
| (4) |
The notation P is for the protein, H for the heme, L for the ligand, Fe for the iron. For simplicity, we are omitting the contributions coming from the solvent terms. Ud1,P–L and Ud2,P–L coincide and represent all the interaction terms in myoglobin (except the heme), and between myoglobin and the ligand atoms. Their functional form is standard. The energy parameters are from the OPLS force field with the united atom model42 (CHn groups are modeled as point masses) as implemented in the MOIL program.41 The NO ligand was modeled with the two-site simple model. It consists of Lennard-Jones sites and small charges (0.028 au) of opposite sign, located at the ligand atomic positions. The water model is TIP3P.43
The second and third terms describe respectively the interactions of the protein with the heme and the iron with the ligand, in the two diabatic states. Ud1,P–H depends on the distance between the iron and the ligand. Therefore, it has to represent the heme coordinated to 5 or 6 nitrogen atoms, U5,P–H and U6,P–H, respectively. In contrast, Ud2,P–H represents always states with 5-coordinated heme, and therefore is equal to U5,P–H for all iron-ligand distances. In U5,P–H the iron is slightly displaced from the heme plane in the direction of the proximal hystidine (see Figure 2a). The iron in U6,P–H is coordinated to six nitrogen atoms, including the one of the ligand; the equilibrium length of the bond between the Nε atom of the proximal histidine and the iron is changing from 2.1 Å in the 5 coordination state to 2.2 Å in the 6 coordination state (see Figure 2b). For a complete set of parameters see reference.33
The term Ud1,P–H has a smoothed piecewise definition from 6-coordinated to 5-coordinated heme, given by a switching function f(R):
| (5) |
where the parameter values are Rcut = 3 Å and λ = 0.2 Å, so that:
| (6) |
The switching function changes from one at large iron-nitrogen distances to exp(–λ –1Rcut) = exp(–15) = 3.05 · 10–7 ≈ 0 at zero distance.
In our model the second diabatic surface Ud2,P–H is:
| (7) |
The remaining diabatic terms represent the interaction of the ligand with the heme iron. The term Ud1,Fe–L is given by:
| (8) |
The energy for heme-nitric oxide binding D is 30 Kcal/mol; the Morse potential of Eq. (8) allows for asymptotic bond breaking at a cost of 30Kcal/mol. The parameters α and were described in reference33 and are α = 2 Å–1 and .
As for the term Ud2,Fe–L, it is given by:
| (9) |
where A, B, and b are constants and RN–Fe is the distance between the iron and the nitrogen atom.
2.2 Switching between electronic curves
There are two mechanisms for the system to switch between the two diabatic energy surfaces. The first is by a direct absorption of a photon, and the second is by curve crossing. In the first mechanism, an absorbed photon transition takes the system from the ground to the excited state without a change in the nuclear positions or velocities. Within our model it means that the energy function [Ud1,P–H +Ud1,Fe–L] is instantaneously changed to [Ud2,P–H +Ud2,Fe–L] .
The absorption of the photon is restricted by the following conditions: (i) The ligand position should be such that its energy given by Eq. (8) is at most –20 Kcal/mol, otherwise we anticipate poor Frank-Condon overlap for the transition. (ii) There is a constant probability, p, for the molecule to absorb a photon in a time step. This probability depends (of course) on the concentration of myoglobin in the sample and on the intensity of the photons in the incoming beam. For computational convenience we set this probability to be high and we experimented with photon-absorption probabilities of 0.1 photons/ps and 0.05 photons/ps without significant changes in the qualitative behavior of the simulation.
The second mechanism models a transition between diabatic curves with the Landau-Zener mechanism.44,45 We consider the probability P of the system to remain on the diabatic curve while passing through a crossing point. The crossing in our model is of the repulsive curve of Eq. (9) and the Morse potential of Eq. (8). The probability is given by:
| (10) |
| (11) |
where Δ is the electronic coupling between the energy surfaces, h the Planck constant, v is the modulus of the velocity of the reaction coordinate (the iron-nitrogen distance), and F1 and F2 the spatial derivatives of the two diabatic energy surfaces at the crossing point. The formula makes intuitive sense as follows. If the electronic coupling is zero, no transition is expected between the diabatic surfaces. Similarly if the velocity is high, the transition probability between diabatic surfaces will be smaller since the time the system spends at the transition domain is shorter.
The second mechanism allows a bi-directional process which gets and releases energy. It is not uncommon to find the system moving on the left of the crossing point along the dissociated curve, crossing and changing temporarily to the associated diabatic surface, so gaining energy, then pass the crossing point again and switch back to the excited state. Multiple cycles of dissociation and rebinding lead to further energy flow into and out of the heme. Multiple peaks in the heme kinetic energy as a function of time (see, for instance, Figures 6 to 8) are not necessarily following events of photon absorption. This complex non-monotonic behavior of energy flow and significantly longer relaxation times were not observed in single photon-absorption events. They lead, as we illustrate in Section 5, to the observation of new phenomena.
Figure 6.
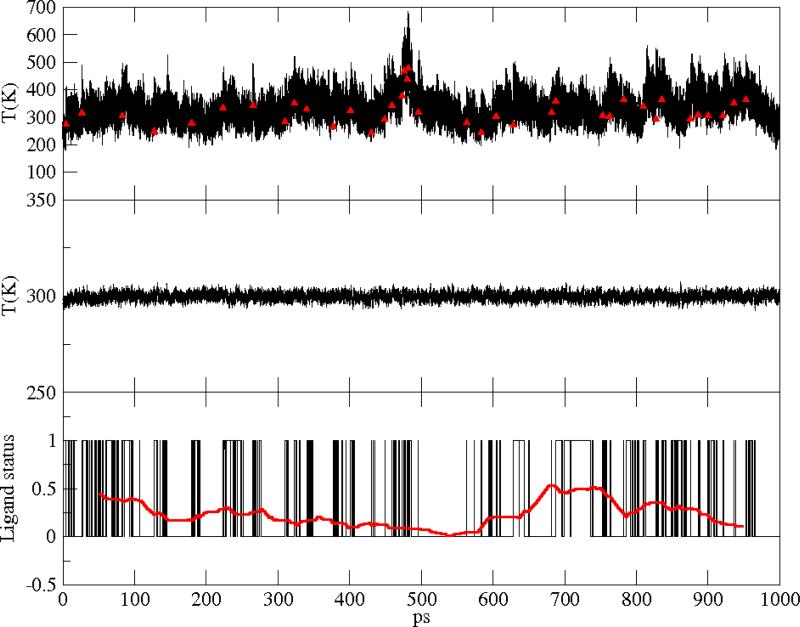
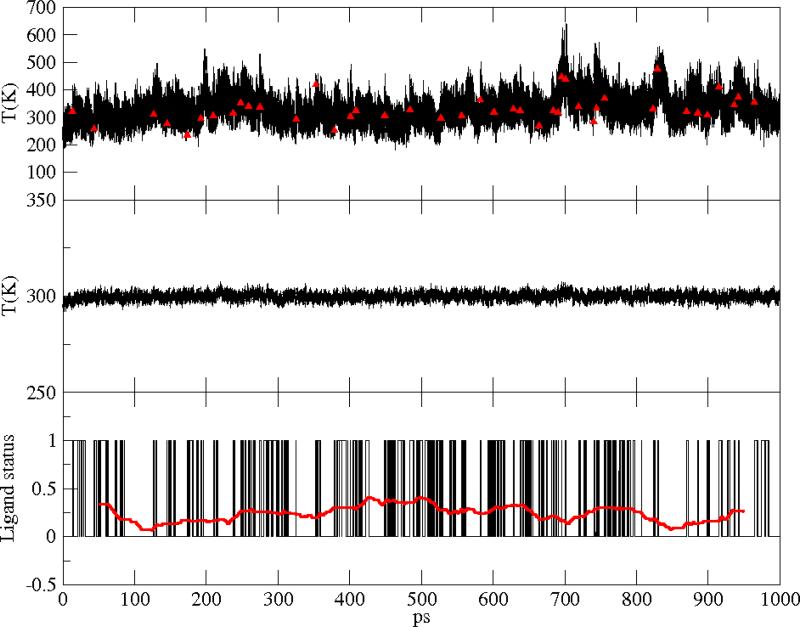
Native Mb. Upper panel: heme instantaneous temperature; red symbols indicate photon absorption events. Central panel: instantaneous temperature of the total protein+water system. Lower panel: flipping of the ligand between the bound or unbound surfaces; the red curve is a window average over 100ps.
Figure 8.
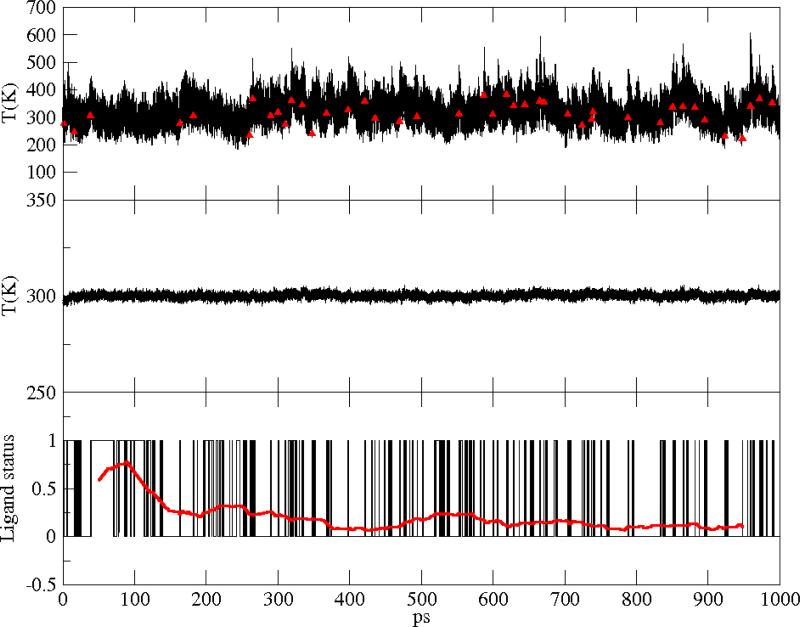
Same as in Figure 6 for the L29F mutant.
3 Dynamic Non Equilibrium Molecular Dynamics (or D-NEMD)
As stated above, the continuous illumination creates a stationary non-equilibrium state of dissociated and bound heme-iron nitric-oxide pairs. Once the photon beam is turned off, the system relaxes to its equilibrium state starting however from the stationary non-equilibrium initial conditions. Such relaxation is studied in this work with the tools of Dynamic- Non-Equilibrium Molecular Dynamics (or D-NEMD).36–40
In D-NEMD, we consider a classical N particles system, Γ = {ri, pi} being a point in phase space. The Hamiltonian governing the system is H(Γ,t), which we assume to be explicitly time dependent. In statistical mechanics a macroscopic property O(t) is obtained as an ensemble average in phase space of the corresponding microscopic observable Ô(Γ):
| (12) |
where w(Γ,t) is the (time dependent) phase-space probability density and 〈 · · · 〉 the integral over phase space. From the Liouville equation we have that:
| (13) |
where S†(t) is the adjoint of the time evolution operator of the dynamical system, S(t), which, in turn, is just a way to indicate the one-to-one correspondence:
| (14) |
By combining Eq. (12), Eq. (13) and Eq. (14), we get the Onsager-Kubo relation:
| (15) |
The meaning of the above equation is that the ensemble average of the microscopic observable Ô(Γ) over the time-dependent probability density w(Γ,t) at time t, is the same as the ensemble average of the microscopic observable at the point Γ(t), corresponding to the evolution in time of the initial phase-space point Γ(0), averaged over the probability density at time t=0, w(Γ,0).
In the standard D-NEMD approach we assume that w(Γ,0) corresponds to a stationary condition so that it can be sampled via an MD simulation. Then we can evolve initial configurations taken from that trajectory with the dynamics generated by H(Γ,t). In the present case, the H(Γ,t) does not depend on t because we want to study just the relaxation to equilibrium when the radiation flow is turned off. Moreover, the relaxation is not just hamiltonian since there can be non-adiabatic switching. This more general situation does not invalidate, though, the Onsager-Kubo relation (see Eq. (15)). Along the paths generated by H(Γ,t) we compute the microscopic observable Ô(Γ(t)). The time-dependent behavior of the macroscopic observable O(t) can be estimated by taking the arithmetic average of Ô(Γ(t)) over the trajectories originated from each of the chosen initial states which represent a sample from w(Γ,0).
4 Computational Methods
Molecular dynamics simulations were performed on three systems: the native form of myoglobin and two myoglobin mutants L29F and V68W in aqueous solution (PDB codes 1MBC,46 2G0R18 and 2OH947 respectively). Figure 1(a) shows a ribbon representation of the protein and the center of the four xenon cavities. Figure 1(b) shows the heme pocket with the key residues lining the binding site on the distal side, in the native protein and in L29F and V68W mutants. The figures were prepared by VMD.48
It is well known that the L29F mutation, in which a leucine residue is replaced by the bulky group of phenylalanine (Figure 1(b), right panel), shows bi-phasic kinetic behavior: at short times (picoseconds) the ligand is unable to escape from the iron atom and it recombines rapidly; ligands that are able to leave the heme pocket face a significantly longer time scale of recombination (nanoseconds, for CO), see reference47 and references therein. Time-resolved X-ray experiments49 illustrated that the ligand stays in the binding site (above the heme) immediately after photolysis. After a while (< 1 ns), most of the electronic density associated with the ligand is found in the Xe4 cavity.
On the other hand, the mutation Val(E11)68 to Trp (Figure 1(b), central panel) blocks the access to the protein interior from the binding site. It completely fills the Xe4 pocket and sequesters the ligand near the iron atom after photodissociation. As a result, the rate of geminate recombination is very high, at least 20 times faster than in the wild type for O2 (see47 and references therein).
In each system, the protein was placed at the center of a cubic cell that was filled with a pre-equlibrated pure water box. Water molecules whose atoms overlap with any protein atom were removed, thus leaving 8342, 7540, and 8894 water molecules around the native, the V68W and the L29F proteins respectively. To ensure the neutrality of the box, 2, 3, 1 water molecules were then replaced by two sodium, three sodium and one chloride counterions, respectively.
All systems were equilibrated using the following scheme: first a 10 ps run was perfomed at 300K by keeping fixed the protein atoms and allowing the water molecules to move. The initial box volume is 69×69×69 Å3, large enough to avoid Lennard-Jones repulsion between the primary and the image boxes. The box volume is slowly (linearly, and at each step) compressed to the final size of 66 Å in the native, 64.5 Å in the V68W and 65 Å in the L29F. Then the system was equilibrated at T = 300K over a period of 1 ns, by keeping the box volume constant, letting all the atoms move.
Periodic boundary conditions were used50 and van der Waals interactions were cut off beyond a distance of 9.5Å . Electrostatic interactions were calculated by the Ewald sum using the PME method;51 the direct sum cutoff was fixed at 11 Å, the tolerance for direct space summation was set to 10–10 and cubic spline interpolation with a grid of 64 * 64 * 64 points was used in each system. The SHAKE algorithm was employed to constrain the protein bonds involving hydrogen atoms.52,53 Bonds within water molecules were kept fixed by using a matrix variant of the SHAKE constraint algorithm.54 The equations of motion were integrated with the velocity Verlet algorithm55,56 with a time step of 1 fs. The non-bonded neighbor lists were updated every 10 steps. Coordinate and velocity sets were saved every 10 fs for data analysis.
To counteract the system heating due to the continuous photon illumination, the velocities of the water molecules external to the sphere of 30 Å (32 Å in the case of native myoglobin) centred at the box center were periodically rescaled to the value corresponding to room temperature: if a deviation larger than 10 K was found, their velocities were scaled to a kinetic energy corresponding to 300 K.
5 Results and discussion
5.1 The Non Equilibrium Stationary State under continuous illumination
Several runs were performed for the native and the mutant proteins, changing the initial conditions, with the aim to generate few trajectories representing a good sample of a non equilibrium stationary state under continuous illumination. We observed that in most simulations of the native and the L29F mutant, the hot ligand escaped from the binding site after ~ 500 ps and did not recombine on the simulation time scale (1 ns). To appreciate the extent of ligand motion in the different proteins we measured the number of collisions of the ligand with residues, averaged over a 1 ns trajectory. A collision is counted when at least one atom of the ligand and one atom of the residue are within a distance of 4 Å.
In the native case, the ligand collided with Gly25, Ile28, Leu29, Gly65, Val68, Leu69, Leu72, Ile107 and Ile111. These are the residues lining the Xe4 cavity57 (see Figure 1(a)). After a while, the ligand migrated to Xe4, and remained trapped there, no longer re-entering the surface crossing region.
In the case of the L29F mutant, it is known (see Section 4) that, once the NO passes the phenylalanine ring, returning back is activated, since the phenylalanine residue blocks the reentrance of the ligand to the heme pocket from the interior of the protein. Experimentally this results in a clear bi-phasic behavior. As in previous simulations of this mutant,33 two groups of residues are found mostly to collide with the ligand. One of them, formed by the residues 43-46, is close to the CD loop (see Figure 1(a)), and the other one, residues 60-68, is at the E/heme corner. In most of our simulations of L29F no re-entry was observed and after a while the ligand was found in the solvent. In this case, the stationary distribution, conditioned to remain in the region where rebinding is possible, can be defined only using multiple trajectories. One long trajectory will not help. Proceeding with multiple trajectories, we lose any information about the total rate of rebinding.
At variance, in V68W mutant, the ligand collides mostly with the binding site residues: Leu29, Phe43, His64, Trp68, Ile107,57 and the heme atoms for a long spell of time; the large aromatic side chain of the Trp68 suppresses almost completely the escape of the hot ligand from the initial site into more remote sites. A single trajectory can therefore provide adequate sampling of the conditioned stationary state.
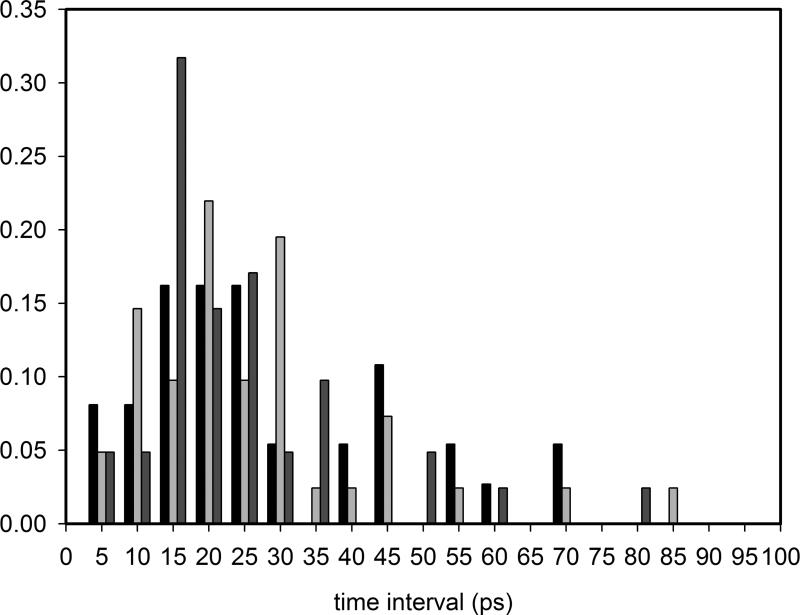
When the ligand remains in the heme pocket, we observe 38 photon absorption events in the native Mb, and 42 photon absorption events in both V68W and L29F, within 1 ns. The normalized probability density of the time elapsing te between two absorption events is shown in Figure 3. The mean value of te is ≃ 28 ps in the native and ≃ 26 ps in both V68W and L29F systems. Since the probability of photon absorption is 0.1 photons/ps, we should have in average te ≅ 10 ps, would the ligand spend most of its time in the bound state; the delay td we measure with respect to 10 ps (≃ 18 ps and 16 ps) is a rough measure of the recombination time in the stationary state.
Figure 3.
Normalized probability density of the time elapsing te between two photon absorption events. Native Mb (black bar), L29F mutant (dark gray), V68W mutant (light gray). Class i sums up events in the interval [ti – 5, ti] (in ps).
To assess the effect of the continuous illumination on the structure of the protein we measured the Root Mean Square deviation (RMSD) of the backbone atoms from the starting structure, defined as
| (16) |
after optimal superposition of the two backbones,58 where NBB is the total number of backbone atoms. Atomic Root Mean Square Fluctuations of protein residues (RMSFs) were also calculated, after optimal superposition between the average structure and the structure at time step i.
| (17) |
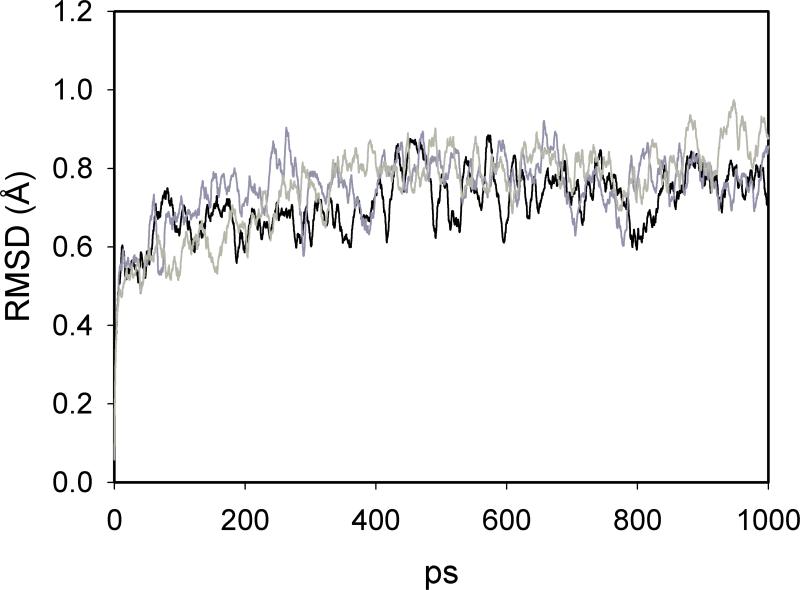
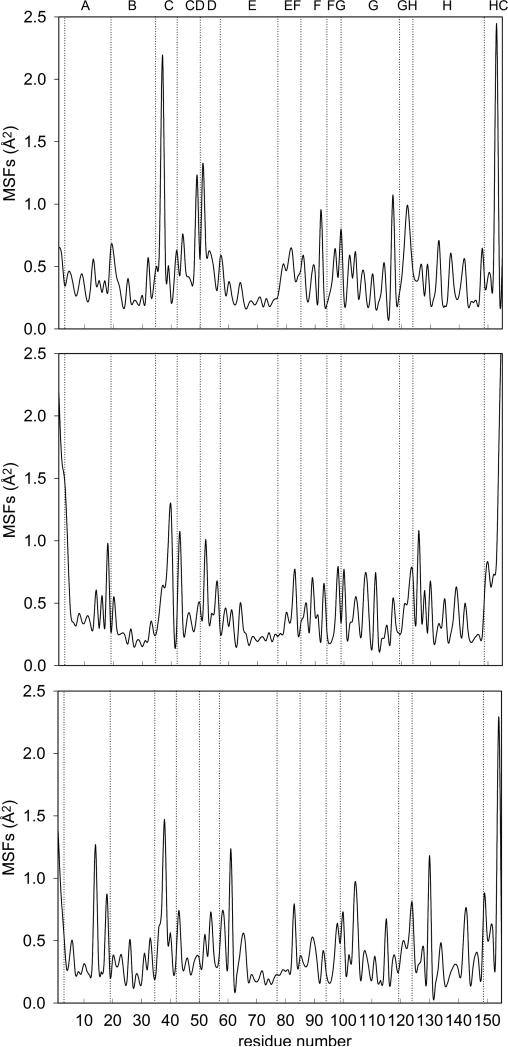
where NBBres is the number of backbone atoms in each residue, N is the total number of time steps and < · · · > is the time average. Results are reported in Figure 4 and Figure 5. The RMSD is comparable to other simulations of solvated myoglobin reported in literature.59 The plots of MSFs appear very similar to the plots already reported at room temperature.33,59 No evidence for damage of the protein structure is observed, despite the continuous pumping of energy into the system.
Figure 4.
Backbone atoms root mean square deviation from the starting structure, Eq. (16), along the non equilibrium trajectory. Native Mb (black line), L29F mutant (dark gray), V68W (light gray).
Figure 5.
Atomic mean square fluctuations versus residue number, Eq. (17). Upper panel: native Mb; central panel: V68W mutant; lower panel: L29F mutant. The labels at the top of the plot indicate secondary structure elements in Mb: helix A (residues 3 to 18), helix B (20 to 35), helix C (36 to 42), loop CD (43 to 50), helix D (51 to 57), helix E (58 to 77), loop EF (78 to 85), helix F (86 to 94), loop FG (95 to 99), helix G (100 to 118), loop GH (119 to 124), helix H (125 to 148), carboxyl terminus HC (149 to 153).
The instantaneous temperatures of the heme and the total system in the three solvated proteins were evaluated as functions of simulation time under continuous illumination from:
| (18) |
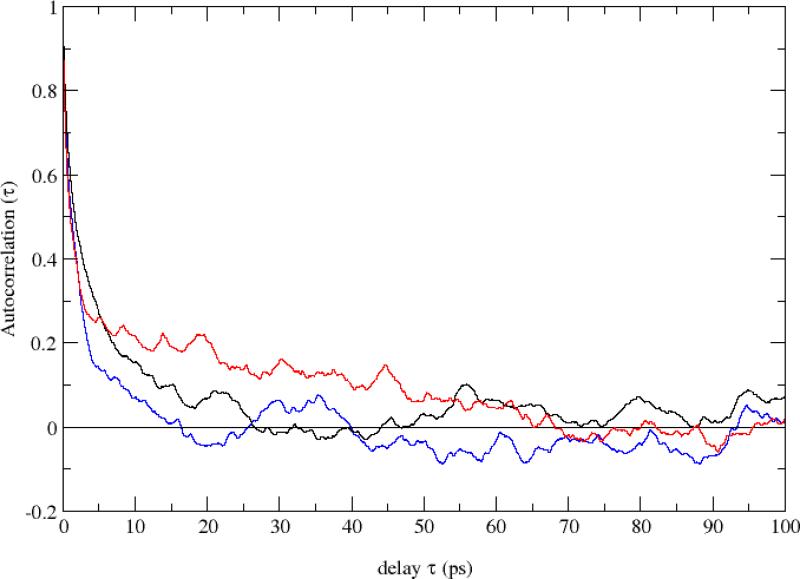
where the sum was either on the heme atoms or on the total number of atoms, respectively. Ndof was chosen accordingly. At each time step, the ligand is found bound or unbound. We attribute the value 0 to the bound state of the ligand and the value 1 to the unbound state. Results for the temperature along our 1 ns run are shown in Figure 6-8, upper and central panels, for the wild type, the V68W and the L29F mutants, respectively. In the lower panel of Figures 6-8, a window average over 100 ps (red curve) of the ligand status data, as well as the total kinetic energy in the central panels, illustrate the stationarity. To estimate the time scale for the switch between the two diabatic surfaces, we measured the autocorrelation of the ligand status time series shown in Figs. 6-8. As shown in Figure 9, the decorrelation time (measured as the time of the first zero crossing) is the lowest in the V68W mutant (≃ 15 ps) and the largest in the L29F mutant (≃ 70 ps).
Figure 9.
Autocorrelation function of the ligand flipping time series shown in the lower panels of Figs. 6-8. Black curve: Native; blue curve: V68W; red curve: L29F.
5.2 Hints to allostery
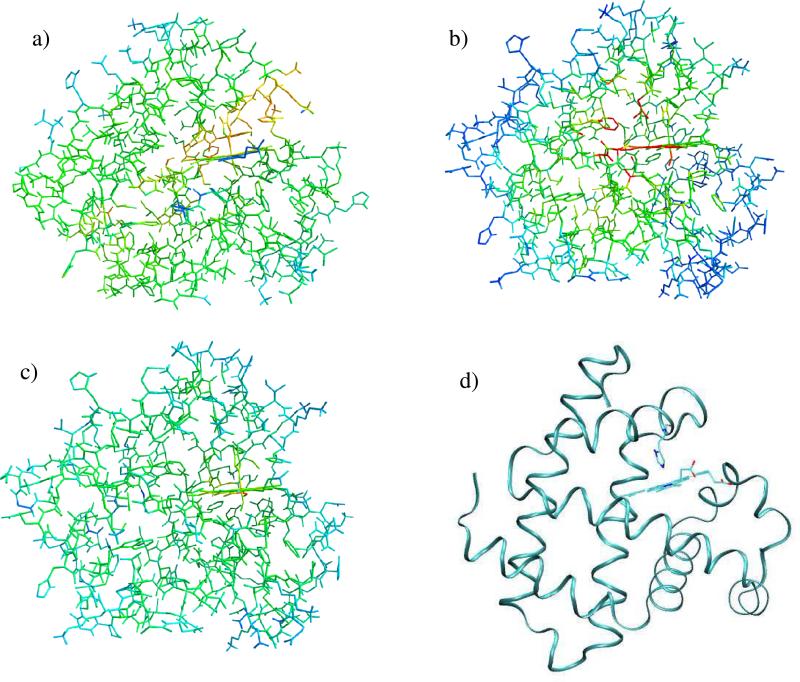
We also performed the analysis of the heat flow. The system absorbs energy at a precise location of the macromolecule (bond between the ligand and the iron at the center of the heme group) and dissipates the excess energy to the rest of the protein and eventually to the solvent. We seek particular domains of the protein that absorb and transport heat better than other domains. To that purpose, we computed on a regular spatial grid of 30 × 30 × 30 points the average kinetic energy of the atoms in each cell, obtaining the local temperature field T(x,y,z) in the grid. We averaged the temperature over time. Since photon absorption events are infrequent, the average temperature in the stationary distribution does not deviate significantly from room temperature. We computed also the temperature variance 〈 T2(x,y,z) 〉 – 〈 T(x,y,z) 〉2 on the grid. This variance is a useful measure to identify groups whose instantaneous temperature has the largest fluctuations, so better participating in instantaneous heat transfer. Results are summarized in Figure 10(a-c) for the native protein and the two mutants.
Figure 10.
Color-coded variance of the local temperature of myoglobin in the stationary condition under constant illumination. (a) Native; (b) V68W mutant; (c) L29F. Red color corresponds to the highest variance in temperature, followed by yellow and green; the blue color corresponds to the lowest variance. The temperature is computed on a grid of 30 × 30 × 30 points. (d) Myoglobin in ribbon representation, same orientation as in panels a-c. The heme and the proximal hystidine are represented in sticks.The figure was prepared with ZMOIL41 and VMD48 programs.
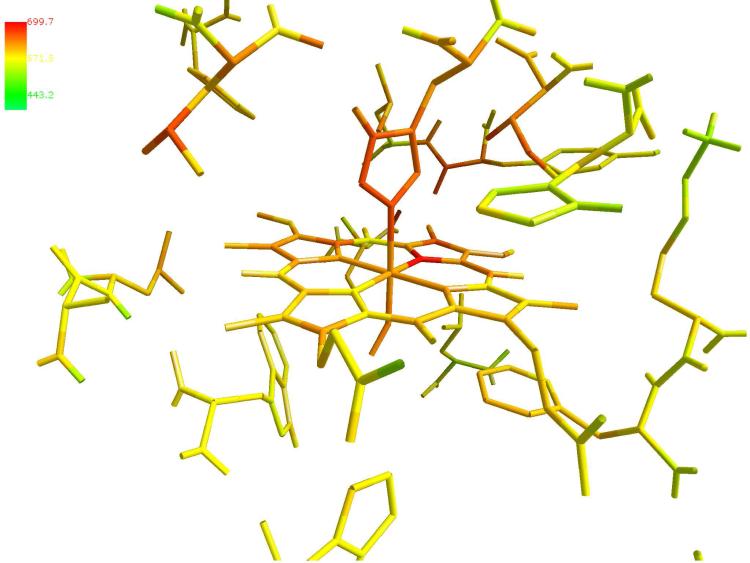
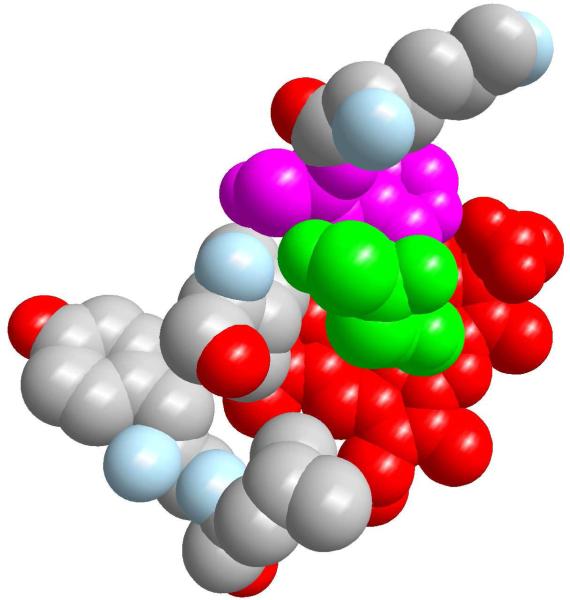
The three proteins show remarkable similarities with minor differences. The mutant V68W, Figure 10(b), is the most efficient in inducing local heating. The nitric oxide is trapped in the heme pocket, which implies rapid recombination followed by more frequent photon absorption events. As better shown in Figure 11, the largest variances observed for V68W are found for the heme group and residues from the FG corner and the G helix (His93, Ile99, Tyr103, Leu104). A similar excitation is found for L29F, Figure 10(c), with identical “hot” residues. In the native protein, Figure 10(a), the ligand is less confined and temperature fluctuations are spread over more space. Besides the heme group, we find that Ser92, His93, Lys96, His97, Ile99, Tyr103, Leu104, Glu105 display significant thermal fluctuations. The heme group is covalently linked to the protein through the proximal histidine. Energy transfer is likely to be more efficient through bonds and nearby contacts. It is therefore worthwhile to have a space filling view of the heme pocket from the direction of the proximal histidine (Figure 12). The striking observation is the close proximity of His 97, a critical residue for the allosteric transition (in pink), to the proximal histidine and the heme. This proximity allows for the energy to be transferred to and used in the allosteric transition. All the above mentioned residues are at the G helix (100-118) and at the FG loop (96-99). The FG corner was shown to play a significant role in allostery. In the allosteric transition of tetrameric hemoglobins, the FG corner of the β chain is displaced against the C helix of the α chain. In particular, His97 from the FG loop forms a contact with Thr38 of the C helix. Of course myoglobin is only one chain. However, the temperature variance is consistent with a thermally excited FG corner (which is quite far from the initiation site). A similar excitation when induced into a tetramer may lead to an allosteric transition.21 The plausible connection to hemoglobin is therefore appealing.
Figure 11.
Color-coded variance of the local temperature of the heme and surrounding residues in V68W. The temperature is computed on a higher resolution grid of 60 × 60 × 60 points. The heme and the residues are represented in sticks. The figure was prepared with ZMOIL41 program
Figure 12.
Top view from the proximal direction of the core of temperature fluctuactions in the native protein (red: heme, green: proximal residue, on top of the heme, pink: His97). Lys96, Ile99, Tyr103 and Leu104 are represented and color coded by atom types: gray is an apolar carbon, red oxygen and light blue nitrogen. Atoms are drawn with only 85% of their van der Waals radius for clarity. The figure was prepared with ZMOIL.41
Finally, we compare our simulation of a stationary state to the studies of heme relaxation by Bu and Straub31 and Sagnella and Straub.32 Their investigation focused on modes that lead to rapid energy loss. Indeed the heme “arms” are close to the solvent and provide the shortest path to solvent for heat dissipation. Our focus is somewhat different. We look at protein structural segments that show large temperature fluctuations and not necessarilxy to the most efficient pathway of energy loss. The last enquiry led us to the observation about the FG corner mentioned above. The path to the FG is inside the protein structure and takes at least some of the photon excitation energy. Another difference is that we placed the excess energy along the iron ligand bond, while Straub and coworkers distribute the excess energy among heme atoms. As a result, in our case the fluctuactions are most significant in the proximal histidine, covalently linked to the Fe atom, and in the FG domain, opposite to the heme side chains (see Figure 11), while water and heme's arms temperature fluctuactions are small and essentially negligible. While the exact heme's mode that carries the photon energy is not known, our model is likely to be relevant also to thermal dissociation in which the bond is broken due to thermal fluctuations.
5.3 D-NEMD simulations: turning off the photon beam
Configurations were sampled every 10 ps from the 1 ns run under continuous illumination and were used to initiate 100 trajectories that were run in NVE ensemble for 100 ps with the photon beam off. In these trajectories, we follow the relaxation from the non equilibrium stationary state under continuous photon pumping to the equilibrium state with photon beam off.
5.3.1 Heme and ligand cooling
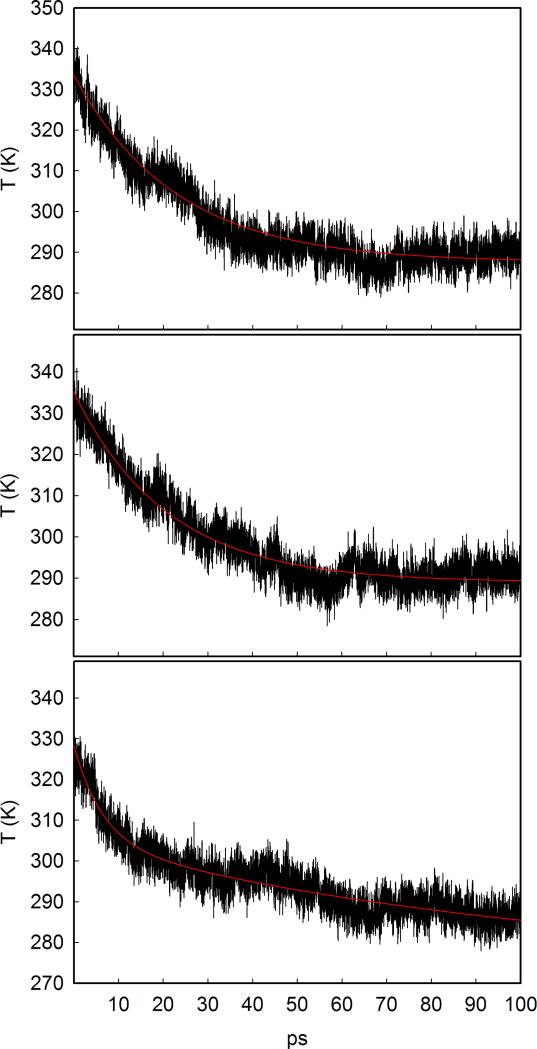
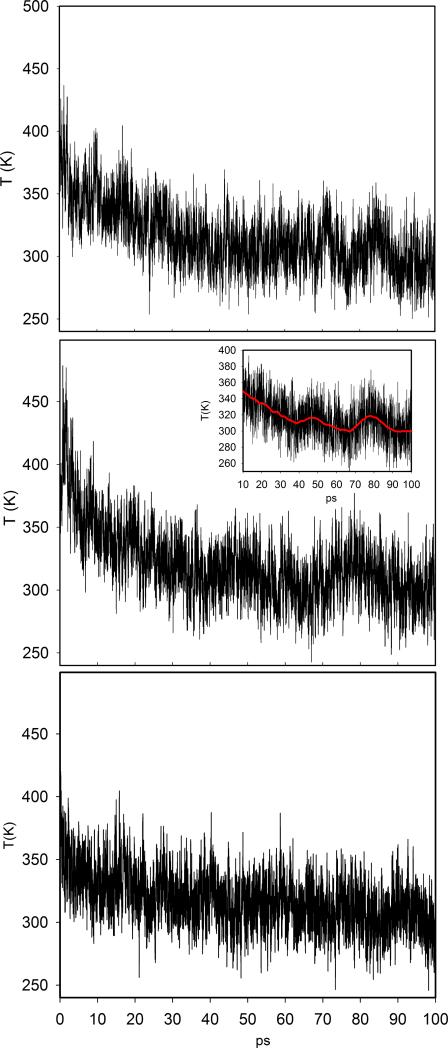
We monitor the temperature of the heme and the ligand as a function of time. Figure 13 shows the heme temperature relaxation (heme cooling) obtained averaging over the 100 trajectories (see Section 3, D-NEMD). A single exponential function fits the data in the simulations of the wild type and the V68W proteins. A biexponential curve is used for the L29F mutant. The relaxation time is ≃ 21 ps for the native and the V68W mutant, while two relaxation times are present in L29F, one as short as ≃ 6 ps and a second much slower relaxation of ≃ 100 ps.
Figure 13.
Relaxation in time of the heme temperature after continuous illumination. Simulation data are represented by the black line; the best exponential curve is represented by the red curve. Upper panel: native Mb, central panel: V68W mutant, lower panel: L29F mutant.
The results for the native protein may seem in disagreement with previous theoretical and experimental results for energy relaxation in the native protein following a single photon absorption or direct excitation of heme vibrational bands. Before discussing the apparent disagreement we summarize relevant experimental results.
Time-resolved Raman spectra of myoglobin were measured by Petrich and co-workers60 following a 500 nm pulse excitation. It was found that the excess energy deposited in the heme is transferred to protein modes in roughly 5 ps. Lingle and coworkers61 found that in deoxyhemoglobin the heme excess vibrational energy was dissipated within 15 ps. Li, Sage, and Champion26 identified a heme cooling time constant of 4 ps on the basis of Raman scattering experiments. Lim et al.28 reported on a single-exponential decay of photoexcited heme with a time constant of 6.2 ± 0.5 ps. Mizutani et al.62 monitored the time dependence of the relaxation of excited vibrational modes of the heme in myoglobin using resonance Raman spectroscopy. The decay was found to be bi-exponential, with time constants 3 ± 1 ps ( the 93% of the relaxation) and 25±14 ps. Lian et al.63 measured the D2O stretching mode shift following photoexcitation of heme in myoglobin solution. It was determined that 60% of the deposited energy was transferred on a time scale of 7.0 ± 1.5 ps, whereas 40% of the energy relaxed on a longer time scale of 20 ps. Genberg et al.64 studied the energy flow between the protein and solvent using transient phase grating spectroscopy demonstrating that energy transfer to the surrounding solvent occurred within 20 ps.
Computer simulations of relaxation in heme proteins by Henry et al.65 pointed out that the relaxation after heme excitation is a bi-exponential process with roughly the 50% energy loss occuring within 1 – 4 ps and the remainder within 20 – 40 ps. The heme cooling was subsequently studied using molecular dynamics simulation by Straub and coworkers.32,66 To simulate the photodissociation process, about 88 Kcal/mol of excess of kinetic energy, corresponding to two 650 nm photons, were deposited in the heme. Decay of the heme kinetic energy following ligand dissociation was found to be single exponential with a time constant of 5.9 ps in both native type and H93G mutated myoglobin. For cytochrome c,31 another heme protein, the kinetic energy relaxation was found to be a biphasic exponential decay process with relaxation time constants of 1.5 and 10.1 ps for the fast and slow processes, respectively.
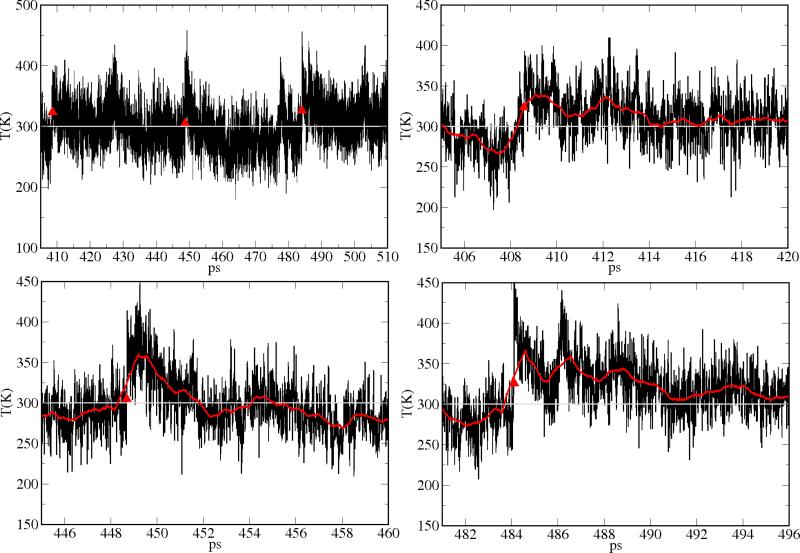
In this work, we have a strong evidence of a single exponential decay in the wild type and in the V68W mutant, but with time constants larger than most of the above reported values. The larger time constants for the heme cooling could be attributed to the multiple photon energy adsorptions along the stationary run from which the side trajectories were derived (ses also Section 2). This is quite different from a single pulse excitation of the ligand or of the heme atoms. To make the comparison of our simulation to single photon experiments and calculations meaningful, we searched for time intervals in which photon absorption events are well separated in time (see in Figure 14, upper left panel, in the case of the V68W mutant), so to approximate them as different single photon excitations. In this case, the relaxation to room temperature is achieved in the ~ 5 ps time scale (See Figure 14, upper right and bottom panels), in good agreement with most of the experiments and previous single excitation simulations.
Figure 14.
Upper left panel: heme temperature in the 405-510ps time window, along the continuous illumination trajectory for the V68W system. Upper right panel: 405-420ps time window; bottom left panel: 445-460ps time window; bottom right panel: 481-496ps time window. Red symbols denote photon absorption events. Red curves are window averages over 0.1ps.
The differences between single and multi-photon excitations are important, since they allow us in the case of multi-photon absorption (computationally and experimentally) to build up considerable energy in the heme for a long period of time. This build-up makes it possible to probe new processes that require more energy, or to probe events with higher amplitudes (stronger signals) and in shorter duration than a single photon event. The local enhancement of signal is obtained without loss of overall protein stability (Figures 4 and 5).
As for L29F, two relaxation time scales are observed, a short (≃ 6 ps) and a longer one (≃ 100 ps). A multi-exponential behavior reflects the existence of secondary docking sites within the protein. As discussed above (see Section 4), in the L29F mutant the ligand may escape from the binding site on the hundred of picosecond time scale, migrating toward the Xe4 cavity and/or the CD corner. The re-entrance of the ligand to the heme pocket from these sites could take a long time, and would contribute to the slow relaxation process we observe. On the other hand, the fastest time scale ( ≃ 6 ps) could be contributed by those trajectories in which the ligand does not migrate to the protein interior and binds from the heme pocket.
Furthermore, in the L29F system only, in ≃ 30 out of 100 simulated trajectories under the condition of photon beam off, water molecules were found to collide with the ligand in the first part of the trajectory (for the definition of collision, see Section 4); the same water molecules then migrated from the binding site toward the heme isopropionate side chains. They were found eventually to interact with one of the other side chains, via hydrogen bonds. This observation could account for the fast process observed in L29F (as well as the fast ligand cooling in L29F, see below). It is in agreement with Henry et al.,65 who first suggested the possibility that the energy could be transferred directly and rapidly from the heme to the surrounding water, by solvent induced damping of the isopropionate side chain motions; and with the subsequent simulation work of Straub and coworkers,31,32,66 who showed how the two isopropionate side chains could play an important role in funneling the excess kinetic energy from the heme in wild type myoglobin.
Figure 15 shows the ligand cooling in the three systems, averaged over the multiple trajectories under the condition of photon beam off. The ligand cooling is the slowest in V68W, and the fastest in L29F. Furthermore, in V68W, slow oscillations appear to be superimposed to the decay of the ligand temperature; this is clearly shown in the inset of Figure 15, central panel, where a window average over 0.1ps (red curve) was superimposed to the relaxation data. In this mutant the ligand is always trapped in the distal heme pocket, and forced to interact mostly with the binding site residues; ligand-residues collisions could then account for the appearance of slow frequency oscillations in ligand cooling, as well as for the higher temperature of the ligand in the initial conditions.
Figure 15.
Relaxation in time of the NO temperature after continuous illumination. Upper panel: native Mb, central panel: V68W mutant, lower panel: L29F mutant. The red curve in the inset of the central plot is a window average over 0.1ps, illustrating oscillatory behaviour.
5.3.2 Kinetics of NO recombination
Among the 100 selected initial conditions along the stationary state, in 28, 30 and 22 (in the native, V68W and L29F, respectively) the ligand was in the unbound state. Averaging the ligand status (0 and 1 values for the bound and unbound, respectively) over the trajectories started from these subset of initial conditions, it was possible to measure the kinetics of ligand rebinding over the 100 ps time interval.
In the native protein, in all the trajectories but one, the ligand was found bound at the end of the 100 ps run. The ligand recombined mostly from the binding site (in a time scale of 1–20 ps); in 5 out the 27 trajectories it recombined from the Xe4 cavity (time scale 20–70 ps). In all trajectories of the mutant V68W, the ligand recombined from the binding site.
In L29F, a wide range of configurations was found at the end of the 100 ps trajectories. In three trajectories out of 22, the ligand was found still unbound at the end of the 100 ps. An analysis of these trajectories showed that the ligand remained trapped in Xe4; the bulky Phe29 prevented it from coming back to the binding site in the 100 ps time of the trajectory. In five trajectories the ligand was observed to recombine starting from the CD corner (time scale 20 – 40 ps); in all the others, it recombined from the binding site, on a time scale of 2 – 20 ps. At short times, the Phe29 squeezes the ligand against the heme, and the recombination is fast (time scale 2-20 ps). However, at longer times, the ligand is no longer in the original binding cavity and the re-entry process is activated. The two time scales were also evident in LES (Locally Enhanced Sampling) simulation of ligand diffusion by Gibson et al.67 Similar behaviour has been found in simulations of CO migration in L29F: the ligand escapes from the binding site on a time scale of a few tens of picoseconds to hundred picoseconds.68
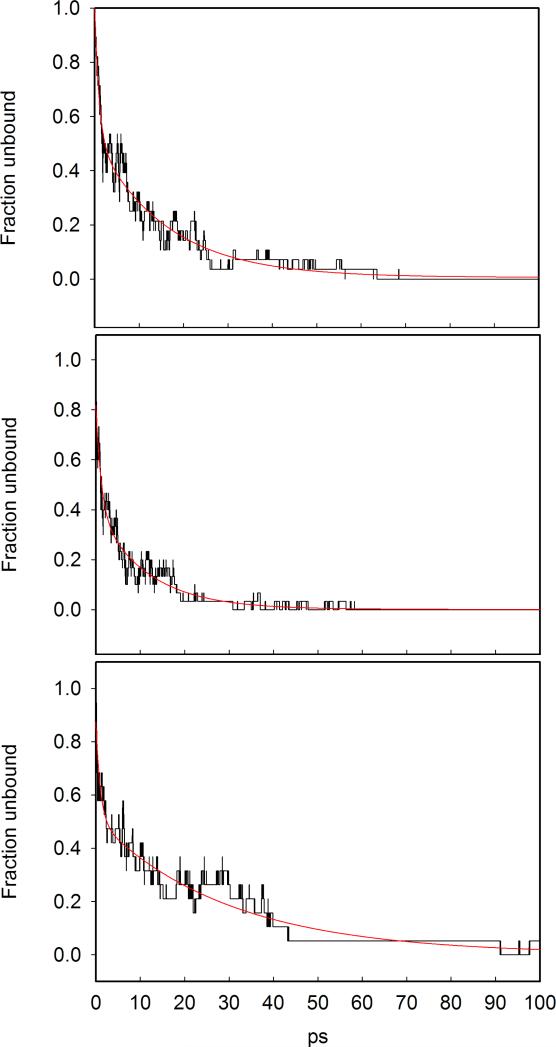
The recombination curves for the three proteins are shown in Figure 16; the values are normalized to the value at t=0. The red curves are the results of fitting the data with a double exponential decay. Two processes are observed with very different time scales. The fast decay, on the sub-picosecond time scale, is merely due to a first fast switching between the energy surfaces. The slow process includes significant spatial diffusion of the ligand. The time constants for the slow process are ≃ 16 ps, 11 ps and 29ps for the native, the V68W and the L29F, respectively. Notwithstanding the poor statistics, we were able to reproduce, at least qualitatively, the order of rebinding of the mutants in comparison to the wild type. In particular, the recombination in V68W is ≃ 1.4 faster than in the native, in good agreement with the value of ≃ 1.3 for the fast kinetic phases in V68W(NO) and Mb(NO) measured experimentally by Ionascu et al. at T = 290 K (see Table 1 in reference9). The recombination time in L29F (≃ 29 ps) is larger than in the native, as pointed out in experiments and previous simulations of MbNO.33,67
Figure 16.
Kinetics of ligand rebinding in Mb. Upper panel: native Mb, central panel: V68W mutant, lower panel: L29F mutant. Simulation data are represented by the black line; the best double-exponential fit is represented by the red curve.
6 Conclusions
The fast geminate recombination and energy relaxation of nitric oxide in wild type and mutated myoglobins are investigated. While different components of the process were studied in the past, the present investigation offers a comprehensive model of a particular experimental set up. Multiple events of photon absorption, ligand dissociation, diffusion, and recombination in a single trajectory are modeled in a single computational framework. This setup is appropriate for the ligand nitric oxide that rebinds exceptionally rapidly and to the computational method of D-NEMD.
The multiple photons placed the system at a highly non-equilibrium state, allowing us to probe the system under unusual conditions in which the heme is particularly “hot”. Since nitric-oxide rebinds to the heme extremely rapidly, Molecular Dynamics at the nanosecond scale is sufficient to sample numerous cycles of geminate recombination. Furthermore, the recombination rate of nitric oxide is comparable to the time scale of heme energy relaxation, making it possible to tune and influence the rate of heme cooling, an interesting proposition for future experiments. Indeed, as we illustrate with continuous illumination, the heme relaxation can be delayed to tens of picoseconds (ten times slower than the relaxation observed for a single event of photon absorption). The energy relaxation also shows a complex behavior and we observed oscillations in the kinetic energy of the heme on the picosecond time scale, indicating that persistent modes (on the several picoseconds time scale) have been excited.
Looking at the temperature fluctuations of the native and mutant proteins we were able to identify protein domains that were affected significantly by photon absorption (see Figure 10). Interestingly the subset of residues that shows large temperature variances are from the FG corner and the beginning of the G helix. This thermal excitation may be correlated with the allosteric transition in hemoglobin in which the FG corner of the β chain is undergoing major structural shifts with respect to the C helix of the α chain. Hence the present study provides hints to allostery.
The mutants examined were L29F and V68W. From the perspective of energy build-up in the heme, the last mutant is the most intriguing. The ligand never escapes from the much tighter heme pocket (once tryptophan is placed at the 68 position, see Figure 1(b), central panel). It remains throughout the calculation in the heme pocket, and quickly rebinds to the heme after dissociation events. The stationary state of the heme is therefore hotter than that of any other mutant. This is also the mutant for which oscillations in the heme kinetic energy have been observed. Hence, it is possible to fine-tune the protein, not only structurally but also in a way that influences its energy relaxation.
Future experiment combining D-NEMD simulations together with carefully tuned mutations can be used to probe how a chemical signal (formation and dissociation of bonds) is mechanically translated to large scale motions we typically find in motor and allosteric transitions. By enhancing signals of dissociation (by collecting multiple events), experimentally and computationally, we are more likely to recover signals of early events in conformational transitions of proteins, and critical adjustments of bio-macromolecules that could assist cellular control.
Figure 7.
Same as in Figure 6 for the V68W mutant.
Acknowledgement
We acknowledge the SFI grant 08-IN.1-I1869 for financial support and the SFI/HEA Irish Center for High-End Computing (ICHEC) for the provision of computational facilities. G.Ciccotti acknowledges the Istituto Italiano di Tecnologia (IIT) under the seed project grant N.259SIMBEDD-Advanced Computational Methods for Biophysics, Drug Design and Energy Storage for financial support. R. Elber acknowledges NIH support (GM059796). G. Cottone would like to thank S. Giuffrida, S. Meloni and L. Maragliano for useful discussions.
References
- 1.Antonini E, Brunori M. Hemoglobin and myoglobin and their interactions with ligands. Amsterdam; North Holland: 1971. [Google Scholar]
- 2.Gibson Q. J. Physiol. 1956;134:112–122. doi: 10.1113/jphysiol.1956.sp005627. [DOI] [PMC free article] [PubMed] [Google Scholar]
- 3.Gibson QH, Olson JS, Fanning JC, Cleary EG. Journal of Biological Chemistry. 1986;261:10228–10239. [PubMed] [Google Scholar]
- 4.Austin RH, Beeson KW, Eisenstein L, Frauenfelder H, Gunsalus IC. Biochemistry. 1975;14:5355–5373. doi: 10.1021/bi00695a021. [DOI] [PubMed] [Google Scholar]
- 5.Henry ER, Sommer JH, Hofrichter J, Eaton WA, Gellert M. Journal of Molecular Biology. 1983;166:443–451. doi: 10.1016/s0022-2836(83)80094-1. [DOI] [PubMed] [Google Scholar]
- 6.Elber R. Current Opinion in Structural Biology. 2010;20:162–167. doi: 10.1016/j.sbi.2010.01.002. [DOI] [PMC free article] [PubMed] [Google Scholar]
- 7.Ansari A, Jones CM, Henry ER, Hofrichter J, Eaton WA. Biochemistry. 1994;33:5128–5145. doi: 10.1021/bi00183a017. [DOI] [PubMed] [Google Scholar]
- 8.Henry ER, Levitt M, Eaton WA. Proceedings of the National Academy of Sciences of the United States of America. 1985;82:2034–2038. doi: 10.1073/pnas.82.7.2034. [DOI] [PMC free article] [PubMed] [Google Scholar]
- 9.Ionascu D, Gruia F, Ye X, Yu A, Rosca F, Beck C, Demidov A, Olson JS, Champion PM. Journal of the American Chemical Society. 2005;127:16921–16934. doi: 10.1021/ja054249y. [DOI] [PMC free article] [PubMed] [Google Scholar]
- 10.Tilton RF, Kuntz ID, Petsko GA. Biochemistry. 1984;23:2849–2857. doi: 10.1021/bi00308a002. [DOI] [PubMed] [Google Scholar]
- 11.Elber R, Karplus M. Journal of the American Chemical Society. 1990;112:9161–9175. [Google Scholar]
- 12.Elber R, H. GQ. Journal of Physical Chemistry B. 2008;112:6147–6154. doi: 10.1021/jp0769779. [DOI] [PubMed] [Google Scholar]
- 13.Ruscio JZ, Kumar D, Shukla M, Prisant MG, Murali TM, Onufriev AV. Proceedings of the National Academy of Sciences of the United States of America. 2008;105:9204–9209. doi: 10.1073/pnas.0710825105. [DOI] [PMC free article] [PubMed] [Google Scholar]
- 14.Maragliano L, Cottone G, Ciccotti G, Vanden-Eijnden E. Journal of the American Chemical Society. 2010;132:1010–1017. doi: 10.1021/ja905671x. [DOI] [PubMed] [Google Scholar]
- 15.Nishihara YS, Kato S. Chemical Physics Letters. 2008;464:220–225. [Google Scholar]
- 16.Ceccarelli M, Anedda R, Casu M, Ruggerone P. Proteins: Structure, Function and Bioinformatics. 2008;71:1231–1236. doi: 10.1002/prot.21817. [DOI] [PubMed] [Google Scholar]
- 17.Cohen J, Arkhipov A, Braun R, Schulten K. Biophysical Journal. 2006;91:1844–1857. doi: 10.1529/biophysj.106.085746. [DOI] [PMC free article] [PubMed] [Google Scholar]
- 18.Aranda R, Levin EJ, Schotte F, Anfinrud PA, Phillips GN. Acta Crystallographica Section D–Biological Crystallography. 2006;62:776–783. doi: 10.1107/S0907444906017318. [DOI] [PubMed] [Google Scholar]
- 19.Bourgeois D, Vallone B, Arcovito A, Sciara G, Schotte F, Anfinrud PA, Brunori M. Proceedings of the National Academy of Sciences of the United States of America. 2006;103:4924–4929. doi: 10.1073/pnas.0508880103. [DOI] [PMC free article] [PubMed] [Google Scholar]
- 20.Srajer V, Ren Z, Teng TY, Schmidt M, Ursby T, Bourgeois D, Pradervand C, Schildkamp W, Wulff M, Moffat K. Biochemistry. 2001;40:13802–13815. doi: 10.1021/bi010715u. [DOI] [PubMed] [Google Scholar]
- 21.Perutz MF, Wilkinson AJ, Paoli M, Dodsonet GG. Annual Review of Biophysics and Biomolecular Structure. 1998;27:1–34. doi: 10.1146/annurev.biophys.27.1.1. [DOI] [PubMed] [Google Scholar]
- 22.Gelin BR, Karplus M. Proceedings of the National Academy of Sciences of the United States of America. 1977;74:801–805. doi: 10.1073/pnas.74.3.801. [DOI] [PMC free article] [PubMed] [Google Scholar]
- 23.Kholodenko Y, Volk M, Gooding E, Hochstrasser RM. Chemical Physics. 2000;259:71–87. [Google Scholar]
- 24.Kruglik SG, Yooa B-K, Franzenc S, Vosa MH, Martina J-L, Negrerie M. Proceedings of the National Academy of Sciences of the United States of America. 2010;107:13678–13683. doi: 10.1073/pnas.0912938107. [DOI] [PMC free article] [PubMed] [Google Scholar]
- 25.Petrich JW, Lambry JC, Balasubramanian S, Lambright DG, Boxer SG, Martin JL. Journal of Molecular Biology. 1994;238:437–444. doi: 10.1006/jmbi.1994.1302. [DOI] [PubMed] [Google Scholar]
- 26.Li P, Sage JT, Champion PMG. Journal of Chemical Physics. 1992;97:3214–3227. [Google Scholar]
- 27.Gao Y, Koyamac M, El-Mashtolyb SF, Hayashid T, Haradad K, Mizutanic Y, Kitagawa T. Chemical Physics Letters. 2006;429:239–243. [Google Scholar]
- 28.Lim MH, Jackson TA, Anfinrud PA. Journal of Physical Chemistry. 1996;100:12043–12051. [Google Scholar]
- 29.Henry ER, Eaton WA, Hochstrasser RM. Proceedings of the National Academy of Sciences of the United States of America. 1986;83:8982–8986. doi: 10.1073/pnas.83.23.8982. [DOI] [PMC free article] [PubMed] [Google Scholar]
- 30.Zhang YH, Fujisaki H, Straub JE. Journal of Physical Chemistry B. 2007;111:3243–3250. doi: 10.1021/jp065877k. [DOI] [PubMed] [Google Scholar]
- 31.Bu LT, Straub JE. Journal of Physical Chemistry B. 2003;107:12339–12345. [Google Scholar]
- 32.Sagnella DE, Straub JE. Journal of Physical Chemistry B. 2001;105:7057–7063. [Google Scholar]
- 33.Li HY, Elber R, Straub JE. Journal of Biological Chemistry. 1993;268:17908–17916. [PubMed] [Google Scholar]
- 34.Meuwly M, Becker MB, Stote R, Karplus M. Biophysical Chemistry. 2002;98:193–207. doi: 10.1016/s0301-4622(02)00093-5. [DOI] [PubMed] [Google Scholar]
- 35.Schaad O, Zhou HX, Szabo A, Eaton WA, Henry ER. Proceedings of the National Academy of Sciences of the United States of America. 1993;90:9547–9551. doi: 10.1073/pnas.90.20.9547. [DOI] [PMC free article] [PubMed] [Google Scholar]
- 36.Ciccotti G, Jacucci G. Physical Review Letters. 1975;35:789–792. [Google Scholar]
- 37.Ciccotti G, Jacucci G, McDonald IR. Journal of Statistical Physics. 1979;21:1–22. [Google Scholar]
- 38.Ciccotti G, Pierleoni C, Ryckaert JP. In: Microscopic simulations of complex hydrodynamic phenomena. Mareschal M, Holian BL, editors. Plenum Press; New York: 1992. Chapter Theoretical foundations and rheological applications of nonequilibrium molecular dynamics.
- 39.Orlandini S, Meloni S, Ciccotti G. Physical Chemistry Chemical Physics. 2011;13:13177–13181. doi: 10.1039/c1cp20778d. [DOI] [PubMed] [Google Scholar]
- 40.Mugnai ML, Caprara S, Ciccotti G, Pierleoni C, Mareschal M. Journal of Chemical Physics. 2009;131:064106. doi: 10.1063/1.3174392. [DOI] [PubMed] [Google Scholar]
- 41.Elber R, Roitberg A, Simmerling C, Goldstein R, Li H, Verkhivker G, Keasar C, Zhang J, Ulitsky A. Computer Physics Communications. 1995;91:159–189. [Google Scholar]
- 42.Jorgensen WL, Tiradorives J. Journal of the American Chemical Society. 1988;110:1657–1666. doi: 10.1021/ja00214a001. [DOI] [PubMed] [Google Scholar]
- 43.Jorgensen WL, Chandrasekhar J, Madura JD, Impey RW, Klein ML. Journal of Chemical Physics. 1983;79:926–935. [Google Scholar]
- 44.Landau LD. Physics of the Soviet Union. 1932;2:46–51. [Google Scholar]
- 45.Zener C. Proceedings of the Royal Society of London. 1932;137:696–702. [Google Scholar]
- 46.Kuriyan J, Witz S, Karplus M, Petsko GA. Journal of Molecular Biology. 1986;192:133–154. doi: 10.1016/0022-2836(86)90470-5. [DOI] [PubMed] [Google Scholar]
- 47.Olson JS, Soman J, Phillips GN. IUBMB Life. 2007;59:552–562. doi: 10.1080/15216540701230495. [DOI] [PubMed] [Google Scholar]
- 48.Humphrey W, Dalke A, Schulten KJ. Molecular Graphics. 1996;14:33–38. doi: 10.1016/0263-7855(96)00018-5. [DOI] [PubMed] [Google Scholar]
- 49.Schotte F, Lim M, Jackson TA, Smirnov AV, Soman J, Olson JS, Phillisp GN, Wulff M, Anfinrud PA. Science. 2003;300:1944–1947. doi: 10.1126/science.1078797. [DOI] [PubMed] [Google Scholar]
- 50.Allen MP, Tildesley DJ. Computer simulation of liquids. Clarendon Press; Oxford: 1987. [Google Scholar]
- 51.Essmann U, Perera L, Berkowitz M, Darden T, Lee H, Pedersen LG. Journal of Chemical Physics. 1995;103:8577–8593. [Google Scholar]
- 52.Ryckaert JP, Ciccotti G, Berendsen HJC. Journal of Computational Physics. 1977;23:327–341. [Google Scholar]
- 53.Ciccotti G, Ryckaert JP. Computational Physics Reports. 1986;4:345–392. [Google Scholar]
- 54.Weinbach Y, Elber R. Journal of Computational Physics. 2005;209:193–206. [Google Scholar]
- 55.Andersen HC. Journal of Computational Physics. 1983;52:24–34. [Google Scholar]
- 56.Martyna GJ, Tuckerman ME, Tobias DJ, Klein ML. Molecular Physics. 1996;87:1117–1157. [Google Scholar]
- 57.Frauenfelder H, McMahon BH, Austin RJ, Chu K, Groves JT. Proceedings of the National Academy of Sciences of the United States of America. 2001;98:2370–2374. doi: 10.1073/pnas.041614298. [DOI] [PMC free article] [PubMed] [Google Scholar]
- 58.Kabsch W. Acta Crystallographica. 1976;32:922–923. [Google Scholar]
- 59.Kuczera K, Kuryan J, Karplus M. Journal of Molecular Biology. 1990;213:351–373. doi: 10.1016/S0022-2836(05)80196-2. [DOI] [PubMed] [Google Scholar]
- 60.Petrich JW, Poyart C, Martin JL. Biochemistry. 1988;27:4049–4060. doi: 10.1021/bi00411a022. [DOI] [PubMed] [Google Scholar]
- 61.Lingle R, Xu X, Zhu H, Yu SC, Hopkins JB. Journal of Physical Chemistry. 1991;95:9320–9331. [Google Scholar]
- 62.Mizutani Y, Kitagawa T. Science. 1997;278:443–446. doi: 10.1126/science.278.5337.443. [DOI] [PubMed] [Google Scholar]
- 63.Lian T, Locke B, Kholodenko Y, Hochstrasser RM. Journal of Physical Chemistry. 1994;98:11648–11656. [Google Scholar]
- 64.Genberg L, Heisel F, Mclendon G, Miller RD. Journal of Physical Chemistry. 1987;91:5521–5524. [Google Scholar]
- 65.Henry ER, Hochstrasser RM. Proceedings of the National Academy of Sciences of the United States of America. 1987;84:6142–6146. doi: 10.1073/pnas.84.17.6142. [DOI] [PMC free article] [PubMed] [Google Scholar]
- 66.Bu LT, Straub JE. Journal of Physical Chemistry B. 2003;107:10634–10639. [Google Scholar]
- 67.Gibson QH, Regan R, Elber R, Olson JS, Carver TE. Journal of Biological Chemistry. 1992;267:22022–22034. [PubMed] [Google Scholar]
- 68.Nutt DR, Meuwly JE. Proceedings of the National Academy of Sciences of the United States of America. 2004;101:5998–6002. doi: 10.1073/pnas.0306712101. [DOI] [PMC free article] [PubMed] [Google Scholar]


