

Abstract
Rce1p catalyzes the proteolytic trimming of C-terminal tripeptides from isoprenylated proteins containing CAAX-box sequences. Because Rce1p processing is a necessary component in the Ras pathway of oncogenic signal transduction, Rce1p holds promise as a potential target for therapeutic intervention. However, its mechanism of proteolysis and active site have yet to be defined. Here, we describe synthetic peptide analogues that mimic the natural lipidated Rce1p substrate and incorporate photolabile groups for photoaffinity-labeling applications. These photoactive peptides are designed to crosslink to residues in or near the Rce1p active site. By incorporating the photoactive group via p-benzoyl-L-phenylalanine (Bpa) residues directly into the peptide substrate sequence, the labeling efficiency was substantially increased relative to a previously-synthesized compound. Incorporation of biotin on the N-terminus of the peptides permitted photolabeled Rce1p to be isolated via streptavidin affinity capture. Our findings further suggest that residues outside the CAAX-box sequence are in contact with Rce1p, which has implications for future inhibitor design.
Keywords: Photoaffinity Labeling, Benzophenone, Bpa, Rce1, Prenyl Protease, Protein prenylation, CAAX Processing, Farnesyl
1. Introduction
1.1. The CAAX prenyl protease, Ras Converting Enzyme 1 (Rce1p)
Ras Converting Enzyme 1 (Rce1p) modifies CAAX proteins (Ras, RhoB), essential parts of all mammalian cells. If these proteins become constitutively activated, they can play a role in cancerous signal transduction.1, 2 The first step in CAAX (C = cysteine, A = an aliphatic amino acid, X = one of several amino acids) protein processing is isoprenylation, a cytosolic event. Prenyltransferase enzymes transfer either a C15 or C20 (farnesyl or geranylgeranyl, respectively) isoprenoid lipid to the CAAX cysteine, rendering it more hydrophobic and often enhancing protein association with membranes.3, 4 This is followed by endoproteolytic trimming of the AAX tripeptide by the isoprenyl protein specific protease, Rce1p, or the functionally related Ste24p.5, 6 The final processing step involves carboxylmethylation of the C-terminal prenyl cysteine by the isoprenylcysteine carboxymethyltransferase (ICMT), also called Ste14p in yeast.7 Disruption of CAAX protein function has been a therapeutic target in drug discovery, with most efforts focused on farnesyltranferase inhibitors (FTIs). Rce1p represents an additional target for inhibition of aberrant cell signaling because it is required for full biological activity of CAAX proteins in some cases.8 Indeed, Rce1p modulates Ras membrane localization and inhibition of Rce1p alters Ras function.9
Rce1p is reported to be an integral membrane protein localized within the endoplasmic reticulum (ER), and the processing of its CAAX substrates is an ER membrane-associated event.6, 10–12 The critical catalytic residues of Rce1p are purported to be embedded in the membrane to facilitate interaction with isoprenoid-modified substrates, but the structure and topology of Rce1p have yet to be resolved.13 Based on sequence alignment studies, Rce1p is predicted to be heptahelical, possessing seven transmembrane spanning segments.14 More detailed structural analysis including crystallization of Rce1p has not been accomplished because of its membrane-bound nature.12 Despite the fact that integral membrane proteins constitute 25–30% of the average proteome and approximately 50% of all medically relevant drug targets in humans, they continue to remain poorly characterized.15 The lack of structural data is due to difficulties in expression, purification and solubilization as well as low abundance of protein.15, 16 Those problems are compounded by the challenges associated with crystallization or NMR analysis of such proteins.
Mutation, inhibition, and bioinformatic studies have been performed to determine the mechanism and protease class of Rce1p. Sequential analysis of Rce1p identified certain invariant residues (i.e. E156, H194, and H248 of yeast Rce1p) that when mutated, were found to be necessary for normal Rce1p activity.13, 14, 17 Analogous glutamate and histidine residues are necessary for T. brucei Rce1p activity, highlighting their significance for proper Rce1p function.11 These residues are also conserved among a family of related prokaryotic proteins that largely have unknown function.18 The confirmation that yeast Rce1p was inhibited by 1,10-phenanthroline and excess zinc further supports the possibility of a metal-dependent protease mechanism.12, 13 However, until its structure is fully characterized, the proteolytic mechanism of Rce1p remains uncertain.12
1.2. Selective Labeling of Rce1p using Affinity-based Photoprobes
Multiple approaches have been used in attempts to characterize the structure and mechanism of Rce1p. Both competitive inhibitors and active-site directed, irreversible affinity-labeling reagents have been designed, but these have not yet yielded a consistent picture for a mechanism.19–21 Site-directed mutagenesis has also been useful in identifying amino acids that are necessary for Rce1p function.13, 14 However, mutation of residues in the enzyme sequence can cause architectural changes that affect enzyme-protein interactions or otherwise compromise the natural processing activity of an enzyme. An alternative approach for characterizing protein-ligand binding is the utilization of photoactivatable analogues that mimic the natural substrate protein. This technique has been used successfully in profiling several systems, including G protein coupled receptors (GPCRs) and metalloproteases.22–25 Lipid-modifying enzymes can also be labeled without compromising activity using affinity-based probes that incorporate a photoreactive group capable of crosslinking to nearby residues upon irradiation.16, 26 The irreversible covalent linkage formed between the photoprobe and target protein allows for structural characterization of the resulting enzyme-probe interaction. Enzymatic digestion of the covalent photoadducts formed in the cross-linking reaction followed by LC-MS-MS sequencing enables identification of labeled peptide fragments.27, 28
Benzophenone photophores have been used broadly in photoaffinity-labeling applications because of their chemical stability and wavelength of activation (365 nm), which is not damaging to proteins.27, 29, 30 In particular, benzophenone-containing Bpa (p-benzoyl-L-phenylalanine) residues have proven useful because of their ease of synthesis and high crosslinking efficiency.24, 25, 27 In earlier work, we reported on the use of a compound that incorporated a benzophenone-functionalized isoprenoid into a peptide substrate for Rce1p. In this study, we have extended our earlier work by preparing a similar probe employing a longer isoprenoid spacer. We have also explored the utility of benzophenone-functionalized peptides by directly substituting Bpa residues into the native, farnesylated K-Ras4b sequence (Figure 1). This latter design greatly increased the efficiency of Rce1p labeling relative to our earlier work.
Figure 1.

Photoactivatable peptide substrate for photoaffinity labeling of Rce1p containing a biotin-PEG3 spacer for SPD isolation of cross-linked protein.
2. Results and Discussion
2.1. Design of Rce1p Substrate Analogues Incorporating Benzophenone Photophores
The internally quenched fluorogenic peptide substrate 2 (Figure 2) is a farnesylated nona-peptide based on the K-Ras4b C-terminal sequence, KSKTKC(farnesyl)VIM, that has been used in proteolysis assays to monitor Rce1p activity.10, 12, 31, 32 It contains an N-terminal Abz (2-aminobenzoyl) fluorophore and a dinitrophenyl quencher (ε-dinitrophenyl lysine) that replaces the P1′ (V) position.31 The peptide has higher fluorescent yield upon Rce1p-catalyzed cleavage of the –K(Dnp)IM tripeptide, and the time-dependent increase in fluorescence is used to monitor the rate of endoproteolysis.
Figure 2.

Structures of isoprenylated peptide substrate, 2, derived from the C-terminal sequence of mammalian K-Ras4b, benzophenone-modified isoprenoids 3 and 5 used for peptide functionalization, and substrate analogues 4 and 6, incorporating benzophenone-modified isoprenoids.
Compounds 4 (previously reported by our lab) and 6 (Figure 2) are analogues of 2, containing photoactive benzophenone-modified isoprenoids linked to the peptide; in each case, the benzophenone group is tethered to the isoprenoidal portion of the probe by a stable ether bond to permit photocrosslinking of Rce1p.27, 33, 34
Peptide 1 (Figure 2), containing a free cysteine thiol, was synthesized as previously described and alkylated with farnesyl bromide to create Peptide 2 (Figure 2).35, 36 The aryl ketone-containing peptide photophores, 4 and 6 (Figure 2), were prepared in a similar fashion using benzophenone-modified isoprenoids 3 and 5 (Figure 2).37, 38
Biotin was incorporated on the probes to allow for selective purification of cross-linked protein via streptavidin pull-down. Peptide 7 (Figure 3) containing an N-terminal biotin linked to the peptide via a PEG3 spacer and a Dde-protected lysine (to allow for introduction of a fluorophore) was synthesized as previously described,35 followed by alkylation with 3 and 5 (Figure 2) to obtain peptides 8 and 9.
Figure 3.

Structures of biotinylated peptide 7, containing a free thiol, and 8 and 9, following alkylation using the benzophenone-modified isoprenoids, 3 and 5.
Probes 11–14 (Figure 4) were developed in order to explore the efficiency of labeling when the photoactive benzophenone group is incorporated into the actual peptide substrate sequence. In these molecules, the native, farnesylated K-Ras4b sequence was retained in all respects except for substitution of the non-natural, photoreactive amino acid, p-benzoyl-L-phenylalanine (Bpa), at specific (P6 – P3) positions upstream of the scissile bond on the peptide. A biotin affinity tag was again introduced at the N-terminus.
Figure 4.

Rce1p substrate analogues incorporating a photoactivatable Bpa residue at alternating P6 (11) – P3 (14) positions proximal to the naturally recognized farnesyl-cysteine moiety.
2.2. HPLC and MS-MS Analysis of Enzymatic Processing of 6
Peptide 6 was evaluated as an Rce1p substrate and the cleavage activity was characterized using RP-HPLC. Peptide 6 (40 μM) was incubated with Rce1p-containing membranes (25 μg/mL) at 35 °C for approximately 4 h in a large-scale (1–2 mL) proteolytic assay that generated the Rce1p-catalyzed proteolysis product 10 (Figure 5, left). Use of an HPLC instrument equipped with a diode array detector allowed for simultaneous evaluation of two UV wavelengths. The 220 nm wavelength (Figure 5, right, solid trace) permitted general visualization of peptide and the 349 nm wavelength (Figure 5, right, dotted trace) revealed specific information on the presence or absence of the Dnp fluorophore. Peaks at tR = 46.5 min in both 220 nm and 349 nm traces indicate unprocessed peptide 6 with an intact Dnp-containing CAAX sequence. Loss of the Dnp group at tR = 28 min in product 10 is denoted by loss of absorbance at 349 nm (Figure 5, right, dotted trace) indicating Rce1p-catalyzed cleavage of the -K(Dnp)IM tripeptide. However, a peak at tR = 28 min is still visible at the 220 nm wavelength (Figure 5, right, solid trace) suggesting the formation of product 10 after loss of the –AAX tripeptide.
Figure 5.

Left: Structure of product 10 derived from Rce1p-catalyzed proteolysis of 6. Right: RP-HPLC chromatogram of Rce1p proteolytic processing of 6. Conversion of 6 to 10 is illustrated by the loss of absorbance at 349 nm corresponding to loss of Dnp upon Rce1p-catalyzed cleavage of the –AAX tripeptide. Solid trace: 220 nm; dotted trace: 349 nm.
Purified unprocessed Peptide 6 was characterized by ESI-MS-MS (see Figure 1A of Supporting Information). The most abundant, triply-charged [M+3H]3+ parent ion (m/z = 566.6) in the ESI-MS was selected for MS-MS sequencing of 6. Fragmentation of that ion yielded several b-, and y-type fragments; eight out of nine b-type ions and five out of nine y-type ions were observed confirming the proposed structure of 6 (see Table 1 in the Supporting Information for complete listing and assignments). The most abundant ions in the ESI-MS-MS of 6 were doubly-charged parent ions that had lost benzophenone (-d) (m/z = 743.4) and C10-prenyl benzophenone (-e) (m/z = 676.3) (Supporting Information, Figure 1A). Cleavage of the thioether bond linking the benzophenone isoprenoid to the peptide (-e) was the most common mode of fragmentation. In addition, very intense ions from benzophenone fragments (BP) (m/z = 195.1) and (d) (m/z = 213.1) were observed.
The Rce1p-catalyzed proteolysis product, 10, was also characterized by ESI-MS-MS. A large-scale assay with 6 was performed as above in order to generate 10 and evaluate its MS fragmentation. The assay material was purified using reversed phase chromatography and analyzed by ESI-MS. Direct infusion of the products obtained from Rce1p-catalyzed proteolysis of 6 revealed that the dominant [M+2H]2+ species (m/z = 580.4) in the ESI-MS was consistent with the expected product 10 (Figure 5, left). MS-MS fragmentation of that ion resulted in the formation of b- and y-type ions all consistent with the proposed structure for 10 (see Figure 1B of Supporting Information). In total, five out of six b-type ions and five out of six y-type ions were observed (see Table 1 in the Supporting Information). As was seen in the fragmentation of 6, a large number of ions where loss of the benzophenone (-b, -d) and prenyl-benzophenone (-c and –e) moieties had occurred were observed, including ions related to the doubly-charged parent ion (m/z = 474.4) (Supporting Information, Figure 1B). Again, very intense ions from benzophenone fragments (BP) (m/z = 195.1) and (d) (m/z = 213.1) were also noted. These ions may be useful as signature ions in future MS analysis for identification of cross-linked species.
2.3. Fluorescence-based Kinetic Analysis of Enzymatic Processing of 6
The aforementioned fluorescence-based proteolysis assay31, 32 was previously used to evaluate Rce1p proteolytic processing of 4 and obtain kinetic parameters.35 For purposes of comparison, the corresponding parameters for 6 were evaluated using the same method.
Carbonate washed, Rce1p-enriched membranes isolated from yeast over-expressing yeast Rce1p as the sole CAAX protease10, 12 were added to a solution containing the peptide substrates. Rce1p activity was monitored using a fluorescence microplate reader to measure the rate of fluorescence production upon cleavage of the substrate (i.e. release of the -K(Dnp)IM tripeptide). Kinetic evaluation demonstrated that 6 is an Rce1p substrate with a KM of 9.6 μM and a Vmax of 0.85 nmol/min/mg protein (Figure 6, Table 1). Comparison of those values with kinetic parameters obtained using 2 and 4 suggests that the binding affinity of 6 is 4-fold less than that of 4 but compound 6 binds to Rce1p with similar affinity as 2 (Table 1). The maximal processing rate (Vmax) of 6 is approximately 7-fold less than that obtained with 2 but 9-fold greater than that of 4. In addition, the efficiency (Vmax/KM) of Rce1p processing of 6 is approximately double that of 4 but 10-fold lower than that of 2. The kinetic data was fit to the Hill Equation instead of the Michaelis-Menten Equation since it provided a better fit for the sigmoidally shaped curves.35 Interestingly, the Hill coefficient, h (Table 1) for 6 was 1.8, somewhat smaller than the values of 2.7 obtained for 2 and 2.8 for 4, but still greater than unity. The kinetic data suggest that Rce1p is demonstrating positive cooperative binding and may possess multiple substrate binding sites. Given the impure nature of the Rce1p used in these experiments, it is not possible to further interpret these results on a molecular level in greater detail; consequently, the significance of these results remains unclear.
Figure 6.

Kinetic analysis of Rce1p-catalyzed proteolysis of benzophenone-modified substrate 6. Rate versus substrate concentration using peptide 6.
Table 1.
Kinetic parameters observed for Rce1p with benzophenone-modified photoprobes 4 and 6 and farnesylated peptide 2.
| Substrate | KM (μM) | Vmax (nmol/min/mg protein) | Vmax/KM (L/min/mg protein) | h |
|---|---|---|---|---|
| 2 (n=2)a | 6.4 ± 0.2 a | 5.6 ± 0.1 a | 8.6×10⁻⁴ | 2.7a |
| 4 (n=5)a | 1.9 ± 0.3 a | 0.093 ± 0.005 a | 4.8×10⁻⁵ | 2.8a |
| 6 (n=5) | 9.6 ± 2.0 | 0.85 ± 0.1 | 8.9×10⁻⁵ | 1.8 |
From Kyro, et al.35; n = replicate; h = Hill coefficient
2.4. Analysis of Labeling Efficiency of Rce1p with Photoactive Peptides
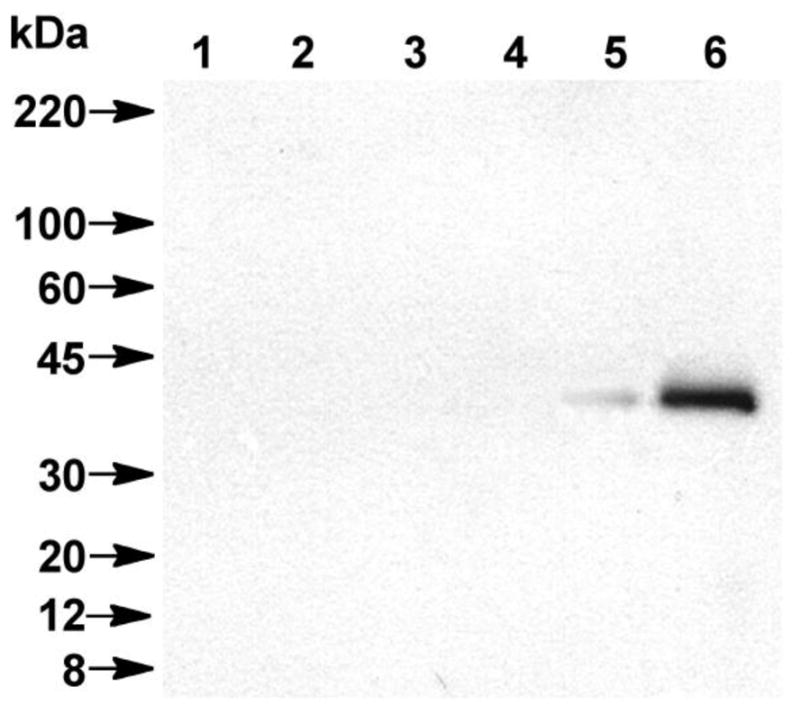
Following confirmation that the new benzophenone-modified isoprenoid 6 could serve as a substrate for Rce1p, the biotinylated derivatives 8 and 9 (Figure 3) were evaluated as photoaffinity-labeling probes. Given that the goal of these experiments was to increase labeling efficiency, it was also decided to evaluate the Bpa-containing farnesylated K-Ras peptides 11–14 (Figure 4) in which the photoactive group was integrated within the peptide rather than the isoprenoid. Thus, solutions of 8 and 9 and 11–14 were diluted to 15 μM and irradiated in the presence of Rce1p-enriched membranes (25 μg/mL) for 20 min at 4 °C. The sample was subjected to protein precipitation, which facilitated removal of unincorporated probe, followed by streptavidin pull-down designed to concentrate crosslinked Rce1p species. The recovered protein was fractionated by SDS-PAGE and analyzed by Western blotting using antibodies directed against HA, an epitope tag incorporated into Rce1p via recombinant methods.13
Irradiation of the probes in the presence of Rce1p-containing membranes resulted in the appearance of bands at approximately 41 kDa, the predicted mass of HA-epitope tagged Rce1p (Figure 7). Comparison of the labeling obtained with 9 (Figure 7, lane 2) with that of previously described35 probe 8 (Figure 7, lane 1) revealed that probe 9 labeled with significantly less efficiency (4-fold less) than was observed with 8. By contrast, the new Bpa-containing probes 12 and 13 (see Figure 7, lanes 4 and 5) labeled Rce1p with efficiencies comparable with probe 8. Excitingly, the labeling efficiencies of 11 and 14 (see Figure 7, lanes 3 and 6) were significantly improved (up 4-fold) compared with 8. Due to its superior solubility, 14 was chosen for use in subsequent labeling experiments.
Figure 7.

Western blot analysis (left) and densitometric quantification (right) of photolabeled Rce1p using probes 8, 9 and 11–14, detected with anti-HA following SPD and SDS-PAGE separation. Lanes 1–6 correspond to Rce1p-containing membranes (RCE1-HA) photolyzed with probes 8, 9 and 11–14 (all at 15 μM), respectively. Columns represent densitometric data obtained from three replicate experiments using probes 8, 9 and 11–14.
2.5. ESI-MS-MS Analysis of Bpa-containing Peptides 11–14
Probes incorporating Bpa into the peptide backbone (11–14) vs. the isoprenoid moiety (8–9) appeared to yield better overall photolabeling of Rce1p. Hence, the MS-MS spectra of these compounds were evaluated to facilitate analysis of cleavage products. Accordingly, peptides 11–14 were sequenced by ESI-MS-MS to confirm their structures prior to proteolytic cleavage by Rce1p. The most abundant, doubly-charged [M+2H]2+ parent ions in the ESI-MS (m/z = 897.7; m/z = 918.3; m/z = 897.6) were selected for fragmentation of 11, 12, and 13, respectively, by MS-MS. The most abundant, triply-charged [M+3H]3+ parent ion (m/z = 607.8) was selected for fragmentation of 14 by MS-MS. Fragmentation of these ions yielded several b-type and some y-type fragments. Seven out of nine b-type ions were observed in the spectrum of 11. In the spectra of 12 and 13, a full set of b-type ions (nine out of nine b-type ions) were observed. The spectrum of 14 revealed eight out of nine b-type ions and three out of nine y-type ions. Consistently abundant in all of the spectra were doubly-charged parent ions that had lost the farnesyl group (m/z = 795.4, 816.1, 795.4, and 808.9; 11–14, respectively). In addition, a very intense ion from a biotin fragment (B) (m/z = 270.1) was observed in all of the spectra as well as ions representing loss of the biotin fragment (-B) (C12H20N3O2S+) and loss of the farnesyl group (-f) (C15H25) (see Supporting Information for ESI-MS-MS spectra and Table 2 for complete listing and assignments).
2.6. HPLC and MS-MS Analysis of Enzymatic Processing of 14
Because the best labeling results obtained were with probe 14, a compound containing a non-natural residue within the peptide sequence, we thought it was important to verify that 14 was indeed a substrate for Rce1p. Accordingly, 14 (20 μM) was incubated with Rce1p-containing membranes (25 μg/mL) at 35 °C for approximately 4 h in a large-scale (1–2 mL) proteolytic assay to generate the Rce1p-catalyzed proteolysis product 15 (Figure 8, left) and analyzed by RP-HPLC. The smaller peak at tR = 64.5 min in the HPLC trace (Figure 8, right) indicates unprocessed peptide 14 with an intact CAAX sequence. The larger peak at tR = 60.5 min with lower retention time is product 15 (after loss of the –VIM tripeptide), confirming that 14 is indeed a bona fide substrate. Importantly, the fact that 14 is an alternative substrate for Rce1p is consistent with the hypothesis that this probe is labeling the active site of the enzyme upon photolysis. A 79% conversion indicating a 4:1 ratio of product to starting material was determined by integrating the full-length and product peaks in the chromatogram. It should be noted that the extent of conversion of 14 to 15 described here (Figure 8, right) is greater than that observed for the processing of 6 to 10 (Figure 5, right) carried out under similar conditions; this suggests that 14 is a more efficient substrate than 6 for yeast Rce1p. Since the main objective of the studies reported here was to identify probes that crosslink with greater efficiency, we did not pursue more detailed kinetic analyses of these compounds.
Figure 8.

Left: Structure of product 15 derived from Rce1p-catalyzed proteolysis of 14. Right: RP-HPLC chromatogram illustrating a 4:1 conversion (79%) of 14 to 15 after 4 h of incubation and proteolytic processing by Rce1p.
To confirm the identity of product 15, it was evaluated by MS fragmentation by comparison to 14 (see Figure 2 of Supporting Information). The assay material was purified using reversed phase chromatography and analyzed by ESI-MS. The most abundant [M+2H]2+ species (m/z = 739.4) was selected for MS-MS fragmentation and was consistent with the expected product 15 (Supporting Information, Figure 2B). A full set of b-type ions (six out of six b-type ions) were generated along with several y-type ions (three out of six y-type ions) (see Table 3 of Supporting Information for complete listing and assignments). As was seen for the spectrum of 14 (Supporting Information, Figure 2A), the spectrum of 15 (Supporting Information, Figure 2B) contained a very intense doubly-charged parent ion that had lost the farnesyl group (m/z = 637.3). The characteristic biotin fragment (B) (m/z = 270.1) was also seen along with ions indicating loss of either the biotin fragment (-B) or the farnesyl (-f).
2.7. Photolysis Time Course to Determine Maximal Labeling of Rce1p
Next, the optimal irradiation time for maximal cross-linking of Rce1p was determined in a time course study where 14 (15 μM) was photolyzed with Rce1p-containing membranes for varying amounts of time (0 to 60 min) (see Figure 3 of Supporting Information). As the photolysis time was increased from 0 to 30 min, there was a corresponding increase in Rce1p labeling. The most abundant labeling time appeared to be 30 min (Supporting Information Figure 3, Lane 3), after which the amount of labeling gradually decreased. Consequently, 30 min was chosen as the optimal labeling time for Rce1p and was used in subsequent photolysis experiments.
Theoretically, increasing the duration of UV exposure should result in more abundant labeling. In a study done by Sato and coworkers, cross-linking experiments were performed for up to 10 h using Bpa-containing protein with no decrease in labeling or radiation damage.24 However, in our labeling reactions we observed a decrease in labeling after 30 min of irradiation. We attribute the decrease in labeling over time to proteolytic degradation or aggregation of the membrane material during the photolysis step.
Post-photolysis, proteolytic degradation was minimized by inclusion of protease inhibitors in all subsequent steps of the procedure, which were also performed on ice. By evaluating the unbound fraction from the streptavidin pull-down via Western blot, it was confirmed that proteolysis had indeed occurred during photolysis. Following 30 min of irradiation, increasing photolysis time resulted in a decrease of the 41 kDa Rce1p signal with a concurrent increase in the abundance of lower molecular weight bands thought to be proteolytic fragments. The longest photolysis times yielded general degradation of all of the bands and loss of most of the HA signal (data not shown).
2.8. Photoaffinity-labeling of Rce1p using Bpa-containing Substrate 14
With the determination of an optimal labeling time of 30 min, photoaffinity-labeling of Rce1p and two null strains was employed in order to verify that the protein labeled by probe 14 was indeed Rce1p. As in the above experiments, a carbonate-washed membrane fraction from S. cerevisiae was used as the source for Rce1p (RCE1-HA in rce1Δ ste24Δ background). Negative control experiments were performed using membranes isolated from strains lacking both CAAX proteases (rce1Δ ste24Δ) or both CAAX proteases and the yeast ICMT (rce1Δ ste24Δ ste14Δ).
Specific labeling of Rce1p was observed when 14 was photolyzed in the presence of Rce1p-containing membranes, as evidenced by the anti-HA-reactive band observed at 41 kDa (Figure 9, Lane 6). This band was absent in the control strains lacking Rce1p either in the absence (Figure 9, Lanes 1 & 3) or presence (Figure 9, Lanes 2 & 4) of irradiation. When Rce1p was treated with 14 in the absence of irradiation (Figure 9, Lane 5), a small amount of Rce1p was visualized, attributable to nonspecific binding of Rce1p to the streptavidin resin employed in the pull-down. Increasing the detergent concentration used in the pull-down decreased the nonspecific labeling but it could not be completely eliminated.
Figure 9.
Western blot analysis of photolabeled products generated by probe 14 as detected with anti-HA following SPD and SDS-PAGE separation. Lane 1: Membranes lacking Rce1p (rce1Δ ste24Δ) and no UV irradiation. Lane 2: Membranes lacking Rce1p (rce1Δ ste24Δ) with UV irradiation. Lane 3: Membranes lacking Rce1p, Ste24p, and Ste14p (rce1Δ ste24Δ ste14Δ) and no UV irradiation. Lane 4: Membranes lacking Rce1p, Ste24p, and Ste14p (rce1Δ ste24Δ ste14Δ) and UV irradiation. Lane 5: Rce1p-containing membranes (RCE1-HA) and no UV irradiation. Lane 6: Rce1p-containing membranes (RCE1-HA) and UV irradiation. 14 was used at 15 μM in all instances.
2.9. Competition Experiments using 2 and 14
As further validation of 14 being an active site probe, a competitive experiment was performed using 14 and substrate 2 (Figure 2), a known Rce1p substrate that lacks a photolabile Bpa group and contains a farnesyl cysteine. Irradiation of Rce1p under mixed substrate conditions (15 μM 14 and 50 μM 2) resulted in a slight diminution in cross-linked Rce1p relative to 14 alone (84% labeling observed, Figure 10). With 100 μM of competitor 2, the labeling was almost completely abolished (7% labeling observed), indicating a dose-dependent inhibition of labeling. These results suggest that the two compounds were competing for the same binding site in Rce1p and that probe 14 is labeling the active site of Rce1p.
Figure 10.

Photoaffinity labeling and chemiluminescent detection of Rce1p under competing substrate conditions. (A) Western blot analysis of photolabeled Rce1p with probe 14 (15 μM) in the absence or presence of competitor 2 (50 or 100 μM) as detected with anti-HA following SPD and SDS-PAGE separation. Lane 1: Rce1p-containing membranes (RCE1-HA) with UV irradiation. Lane 2: Rce1p-containing membranes (RCE1-HA) and farnesylated competitor 2 (50 μM) with UV irradiation. Lane 3: Rce1p-containing membranes (RCE1-HA) and farnesylated competitor 2 (100 μM) with UV irradiation. (B) Densitometric quantification of photolabeled Rce1p. Columns represent densitometric data obtained from four replicate experiments. Sample ordering is the same as in panel A.
3. Conclusions
In earlier work, we synthesized and characterized the benzophenone-functionalized isoprenoids 4 and 8 and confirmed their efficacy as Rce1p substrates. In this study, we synthesized novel, photolabile Rce1p substrates designed to optimize the photolabeling efficiency of benzophenone-containing probes. By increasing the length of the isoprenoidal portion of 4 to create 6, the Rce1p processing efficiency (Vmax/KM) of the benzophenone-modified isoprenoids was increased approximately two-fold with little impact on KM (9.6 μM and 6.4 μM for 6 and 2, respectively). However, photolabeling experiments with the new probe did not result in improved levels of crosslinking. Hence, we explored the utility of a series of photoactivatable, Bpa-containing probes that retained the naturally-recognized farnesyl-cysteine moiety. Evaluation of the cross-linking efficiency of these probes revealed that all of the probes labeled Rce1p, with the most intense labeling observed with probes 11 and 14. Importantly, the amount of cross-linking obtained with 14 was over 4-fold greater than that obtained with the previously described probe 8. The ability of Rce1p to process 14 to its expected product 15 was confirmed by a combination of RP-HPLC and ESI-MS-MS analysis. The specificity of 14 for the Rce1p active site was further supported by competition experiments utilizing substrate 2, whose presence reduced photolabeling of Rce1p in a dose-dependent manner, suggesting that labeling does indeed occur in the enzyme active site.
Through this study, we have successfully demonstrated increased photolabeling efficiency of benzophenone-containing Rce1p substrate peptides. By incorporating biotin on the N-terminus as an affinity tag for purification, retaining the naturally recognized farnesyl-cysteine, and incorporating a photolabile Bpa residue into the peptide sequence of an established substrate sequence, the yield of cross-linked product was significantly increased. This approach has potential utility for further investigation into the mechanism and active site identification of Rce1p. By increasing the labeling efficiency of substrate photoprobes, further structural information on Rce1p may be obtained via isolation and characterization of the covalent enzyme-probe complex. This strategy for probe design may also be useful for studies of other enzymes that act on prenylated proteins including Ste24p and ICMT.3, 39–41 Finally, it is important to note that the crosslinking results reported here suggest that residues outside the CAAX-box are in contact with Rce1p despite the fact that the minimal substrate recognized by Rce1p appears to be an isoprenylated CAAX tetrapeptide.3, 14, 32 If these upstream interactions involve any specific contacts with the enzyme, it may be fruitful to incorporate such features in future inhibitor designs.
4. Experimental
4.1. General
Analytical TLC was performed on precoated (0.25 mm) silica gel 60F-254 plates purchased from E. Merck. Flash chromatography silica gel (60–120 mesh) was obtained from E. M. Science. TFP-PEG3-Biotin was from Thermo Scientific. Bpa peptides (11–14) were from Anaspec. Yeast protease inhibitor cocktail (P8215) and all other reagents were from Sigma Aldrich. Reactions were performed at room temperature unless otherwise noted. RP-HPLC analysis was carried out using a Beckman Model 125/168 instrument equipped with a diode array UV detector. Preparative RP-HPLC separations employed a Phenomenex Luna 10μ 100 Å C18(2) column (10.00 mm × 25 cm). Analytical RP-HPLC separations employed a Varian Microsorb-MV 5μ 100 Å C18 column (4.6 mm × 25 cm) with a Phenomenex Luna 5μ guard cartridge (4.6 mm × 3 cm). Retention times (tR) were based on analytical RP-HPLC using a linear gradient from 100% H2O to 40% H2O/70% CH3CN over 70 min and a flow rate of 1.0 mL/min. Peptide concentrations were determined by mass (11–14) or by UV spectroscopy of the Dnp quencher (6 and 9) (349 nm, ε =18,000 cm−1 M−1, pH 7). The fluorogenic peptides were protected from light as much as possible to avoid photobleaching of the fluorophore. C18 Sep-Pak columns were purchased from Waters and protein precipitation kits were purchased from CalBiochem. Spin columns, streptavidin resin, and ECL substrate solutions were purchased from Pierce. Autoradiographic film was purchased from Bioexpress. Antibodies were purchased from Covance and GE Healthcare. Densitometry measurements were performed using a Biorad Molecular Imager, FX phosphorimager.
4.1.1. Yeast Strains and Plasmids
The parent yeast strain used in this study is SM3614 (MATa trp1 leu2 ura3 his4 ste24::LEU2rce1::TRP1).42 SM3614 was transformed with plasmid pRS316 (CEN URA3) or pWS479 (2μURA3PPGK-RCE1::HA) to create rce1Δ and wildtype (WT) strains, respectively.13, 43 Yeast transformations were carried out according to established methods.44 Transformed yeast strains were grown at 30 °C in synthetic complete medium lacking uracil (SC-Ura).
4.1.2. Abbreviations
Abz, 2-aminobenzoyl; BP, benzophenone; Bpa, p-benzoyl-L-phenylalanine, C5BP, 3-methylbenzophenone prenyl ether; C10BP, 3-methylbenzophenone geranyl ether; CLEAR, cross-linked ethoxylate acrylate resin; Dde, 1-(4,4-dimethyl-2,6-dioxocyclohexylidene) ethyl; DI, deionized; DIEA, diisopropylethylamine; DMF, N,N-dimethylformamide; DMSO, dimethyl sulfoxide; Dnp, dinitrophenyl; ECL, enhanced chemiluminescence; ER, endoplasmic reticulum; ESI-MS, electrospray ionization mass spectrometry; FA, formic acid; Fmoc, 9-fluorenylmethyloxycarbonyl; f, farnesyl; GPCR, G protein coupled receptor; HA, hemagglutinin; HRP, horseradish peroxidase; BME, 2-mercaptoethanol; OAc, acetate; PBS, phosphate buffered saline; PEG, polyethylene glycol; PVDF, polyvinylidene difluoride; PMSF, phenylmethanesulfonyl fluoride; RIPA, radioimmunoprecipitation assay; RP-HPLC, reversed-phase high pressure liquid chromatography; SA, streptavidin; SDS, sodium dodecyl sulfate; SPD, streptavidin pull-down; SPPS, solid-phase peptide synthesis; TBST, Tris-buffered saline containing Tween 20; TFA, trifluoroacetic acid; TFP, tetrafluorophenyl.
4.2. Chemical Synthesis
4.2.1. Synthesis of Abz-KSKTKC(C10BP)K(Dnp)IM, 6
Abz-KSKTKCK(Dnp)IM,35 1 (10.0 mg, 7.4 μmol, 1.0 equiv) was dissolved in 10.0 mL of 2:1:1 DMF/n-butanol/0.1% aqueous TFA (v/v/v) and (3-((((2E,6E)-8-bromo-2,6-dimethylocta-2,6-dien-1-yl)oxy)methyl)phenyl)(phenyl)methanone, 5 (13.0 mg, 30 μmol, 4.0 equiv), synthesized according to published methods,33, 45 was added. Zn(OAc)2 (8.0 mg, 37 μmol, 5.0 equiv) was dissolved in a small amount 0.1% aqueous TFA (200 μL) and added to the reaction. The reaction was monitored by RP-HPLC and was complete in 2.5 h. The crude material was diluted with 0.1% aqueous TFA and purified by RP-HPLC using 0.1% TFA/H2O (solvent A) and 0.1% TFA/CH3CN (solvent B) and the following elution profile performed at 5.0 mL/min: 5.0 min 0% solvent B; linear gradient from 0% to 60% solvent B over 120 min. The solvent mixture was removed by lyophilization yielding 1.3 mg (10%) of 6. Purity by RP-HPLC: 92.6%, tR = 57.5 min., ESI-MS (m/z): [M+2H]2+ calcd for C82H122N16O19S2 849.4251, found 849.9947; [M+3H]3+ calcd for C82H123N16O19S2 566.6192, found 566.9992. UV ε349 = 18,000 mM−1•cm−1.
4.2.2. Synthesis of Biotin-K(Dde)KSKTKC(C10BP)K(Dnp)IM, 9
Biotin-K(Dde)KSKTKCK(Dnp)IM,35 7 (10.0 mg, 5.0 μmol, 1.0 equiv) was dissolved in 2.0 mL of 2:1:1 DMF/n-butanol/0.1% aqueous TFA (v/v/v) and (3-((((2E,6E)-8-bromo-2,6-dimethylocta-2,6-dien-1-yl)oxy)methyl)phenyl)(phenyl)methanone, 5 (8.5 mg, 20 μmol, 4.0 equiv), was added. Zn(OAc)2 (5.5 mg, 25 μmol, 5.0 equiv) was dissolved in a small amount 0.1% aqueous TFA (100 μL) and added to the reaction. The reaction was monitored by RP-HPLC. Following 2 h of reaction time, 200 μL of BME was added to quench the reaction and reverse any sulfonium salt formation.36 The mixture was stirred for 2.5 h, filtered, diluted with 0.1% aqueous TFA and purified by RP-HPLC using 0.1% TFA/H2O (solvent A) and 0.1% TFA/CH3CN (solvent B) and the following elution profile performed at 2.5 mL/min: 5.0 min 0% solvent B; linear gradient from 30% to 100% solvent B over 140 min. The solvent mixture was removed by lyophilization to afford 5.3 mg (44%) of 9. Purity by RP-HPLC: 96.2%, tR = 66 min., ESI-MS (m/z): [M+2Na]2+ calcd for C115H179N21O28S3Na2 1222.1096, found 1221.8616; [M+2Na+H]3+ calcd for C115H180N21O28S3Na2 815.0730, found 814.9139; [M+2Na+2H]4+ calcd for C115H181N21O28S3Na2 611.5548, found 611.4392. UV ε349 = 18,000 mM−1 • cm−1.
4.3. Mass Spectrometric and HPLC Analysis
4.3.1. Large-scale Proteolysis Reactions for Product Structure Identification
Stock concentrations of 6 and 14 were diluted in Hepes buffer (100 mM Hepes, 5 mM MgCl2, pH 7.5) to 40 μM (6) and 20 μM (14). Rce1p-containing membranes were added to a final concentration of 0.25 mg/mL (total protein) in a total assay volume of 1–2 mL. The samples were mixed briefly and incubated in a 35°C water bath for approximately 4 h. The crude product was purified using Sep-Pak reversed phase C18 columns equilibrated in 2 × 10 mL 0.1% TFA/CH3CN (solvent B) followed by 2 × 10 mL 0.1% TFA/H2O (solvent A). The reaction mixtures containing proteolyzed peptide were applied to the columns and fractions were eluted using 4–6 mL of solvents A and B with a 10% incremental stepwise gradient from 0–100% B at a flow rate of 3–5 mL/min.
The individual fractions were evaluated by ESI-MS, which revealed the presence of doubly- and triply-charged parent ions of the products of cleavage, 10 and 15, in the 40 and 50% B fractions, respectively, as well as doubly- and triply-charged parent ions of the starting materials, 6 and 14, in the 50% B fraction only. These fractions were lyophilized and re-dissolved in solvent A (6 and 10) or 1:1 solvents A:B (14 and 15) prior to HPLC and MS/MS analysis.
4.3.2. RP-HPLC Analysis of Benzophenone-containing Substrates Following Enzymatic Processing by Rce1p
HPLC of proteolysis product 10: The 40 and 50% B fractions were pooled, lyophilized, and dissolved in 1 mL of 100% solvent A (0.1% TFA/H2O). The solution was loaded onto a Phenomenex Luna 10μ 100 Å C18(2) preparatory column (10.00 mm × 25 cm), and RP-HPLC applied using a linear gradient from 30–100% B over 140 min and a flow rate of 2.5 mL/min. The cleaved product (10) peak denoted by loss of Dnp at 349 nm was found at tR = 28 min (42% B), ESI-MS (m/z): [M+2H]2+ (mono) calcd for C59H88N10O12S1 580.3146, found 580.3892. The starting material (6) eluted at tR = 46.5 min (51% B), ESI-MS (m/z): [M+2H]2+ (mono) calcd for C82H122N16O19S2 849.4251, found 849.5634.
HPLC of proteolysis product 15: The 50% B fraction containing both unprocessed 14 and product 15 was lyophilized and dissolved in 100 μL of 50% B. The solution was injected onto a Varian Microsorb-MV 5μ 100 Å C18 analytical column (4.6 mm × 25 cm) and RP-HPLC applied using a linear gradient from 0–70% B over 70 min and a flow rate of 1.0 mL/min. The cleaved product (15) peak was found at tR = 60.5 min (56% B), ESI-MS (m/z): [M+2H]2+ (av) calcd for C75H122N12O14S2 740.0028, found 739.9970; [M+3H]3+ (mono) calcd for C75H123N12O14S2 493.2902, found 493.3000. The starting material (14) eluted at tR = 64.5 min (60% B), ESI-MS (m/z): [M+2H]2+ (mono) calcd for C91H151N15O17S3 911.0282, found 911.0600; [M+3H]3+ (av) calcd for C91H152N15O17S3 608.1683, found 608.0798.
4.3.3. MS-MS Analysis of Benzophenone-containing Substrates Following Enzymatic Processing by Rce1p
The lyophilized 40% and 50% B samples containing 10 and 15, respectively, were dissolved in 30 μL of 100% solvent A (0.1% TFA/H2O) (10) or 50 μL of 50% solvent B (0.1% TFA/CH3CN) (15) and further diluted with an equal volume of 50% CH3CN and 0.1% formic acid in water to a final concentration of approximately 1 μg/μL prior to MS analysis. MS was performed by direct injection (10 μL) into a QSTAR Pulsar i quadrupole-TOF (time-of-flight) mass spectrometer equipped with a turbo ionspray source, collected as individual scans for approximately 1 sec. The ion spray voltage was 5000 V during MS acquisition and 4500 V during MS/MS with a collision energy adjusted until the precursor ion selected was reduced to 10–50% of its peak intensity at 0% collision energy. The instrument used an external calibration of renin using the monoisotopic peaks of [M+2H]2+ (m/z = 580.3) (10) and [M+2H]2+ (m/z = 739.4) (15). Mass spectra were the average of scans collected in positive mode over a 0.2 min acquisition period. MS results were evaluated with Analyst software and MS/MS fragmentation predicted using UCSF Protein Prospector v 5.5.0 (http://prospector.ucsf.edu).
4.4. Kinetic Assay
4.4.1. Rce1p Isolation and in vitro Fluorescence-based CAAX Proteolysis Assay
Carbonate-washed membrane fractions containing yeast Rce1p were used as the source of enzyme. Membranes were isolated according to previous methods as 1.0 mg/mL total protein stock solutions in lysis buffer (50 mM Tris, pH 7.5, 0.2 M sorbitol, 1 mM EDTA, 0.2% NaN3) containing a protease inhibitor cocktail (1 μg/mL each chymostatin, leupeptin, pepstatin; 0.85 μg/mL aprotinin; 1 mM PMSF) and stored at −80 °C.10, 12 The membranes were diluted with an equal volume of assay buffer (100 mM Hepes, pH 7.5, 5 mM MgCl2) to 0.5 mg/mL and preincubated in a metallic block for 10 min at 30 °C. Substrates 2, 4, and 6 were serially diluted in assay buffer from their stock concentrations (100, 90, and 90 μM, respectively) into a 96-well V-shaped microtiter plate (three 15 μL replicates) and transferred to 384-well black flat bottom microtiter plate; 10 concentration points for each substrate. The plate was covered with a lid and incubated 10 min at 30 °C. Assays were initiated with the addition of 15 μL of diluted membranes to the diluted substrates in the wells, resulting in a final membrane protein concentration of 0.25 mg/mL, substrate concentrations ranging from 0–50 μM (2), or 0–45 μM (4 and 6), and a total assay volume of 30 μL. The fluorescence in the samples was measured every 30–60 s for 1 h at 30 °C with 5 s shaking before each reading at 340/420 nm excitation/emission wavelengths using a BioTek Synergy HT microplate fluorometer.
4.4.2. Kinetic Analysis
Data from experiments was collected as replicates (two for 2 and five for 4 and 6) and analyzed using GraphPad Prism 4.0. Data was fit to the four parameter Hill Equation Y = Vmax * Xh / (KMh + Xh) without constraints after providing approximate initial values. Prior to analysis, the data (RFUsample) was corrected to take into account the observation that RFU and product formation are proportional but do not have a 1:1 relationship. In part, this is due to intermolecular quenching effects that increase as substrate concentration increases. A standard curve was created using trypsin to determine the maximum fluorescence obtainable at various substrate concentrations (RFUtrypsin). Compounds 2, 4, and 6 all contain trypsin cleavage sites. A graph of RFUtrypsin vs. substrate concentration was plotted for each substrate, and a best-fit line determined. The equations of the curves were used to extract the actual product concentration for partially reacted samples (RFUsample). These values were used for Prism analysis.
4.5. Photoaffinity Labeling
All photolysis reactions were conducted at 4 °C in a UV Rayonet photoreactor (Model # RPR-100, Southern New England Ultraviolet Co.) equipped with sixteen RPR-2537 Å lamps and a circulating platform that allows up to thirteen samples to be irradiated simultaneously. All reactions (67.5 μL) were performed in silanized quartz test tubes (10 × 43 mm) and contained 100 mM Hepes, 5 mM MgCl2, pH 7.5, 15 μM photoprobe (8, 9, 11, 12, 13, or 14), and 0.25 μg/μL membranes containing or lacking Rce1p. The reactions were photolyzed for 30 min (unless otherwise noted) using the apparatus described above and quenched by flash-freezing in N2 (l). Immediately after photolysis and prior to quenching, protease inhibitor cocktail (Sigma) (1.35 μL) was added to the samples.
4.5.1. Pull-down of Photolabeled Rce1p on Streptavidin Beads Followed by Western Blot Analysis
Irradiated samples were thawed and concentrated using protein precipitation (CalBiochem), solubilized in RIPA buffer [75 μL; 150 mM NaCl, 50 mM Tris HCl, 1.0% (w/v) sodium deoxycholate, 1.0% (v/v) Triton X-100, pH 7.0] containing 1.5% (w/v) SDS and protease inhibitor cocktail (Sigma) (1:50), and added to spin columns containing streptavidin agarose resin (0.7 μg of protein/μL resin pre-equilibrated with RIPA/1.5% SDS/protease inhibitor cocktail [1:50]) and incubated 4 h at 4 °C. Following brief centrifugation, the resin was washed three times with RIPA/1.5% SDS/protease inhibitor cocktail (Sigma) for 15 min/wash.
The samples were eluted by adding 2× sample buffer [20 μL; 4.0% SDS, 20% glycerol (v/v), 125 mM Tris•HCl (pH 6.8), 10% BME (v/v), 0.004% Bromophenol Blue (w/v)] to each spin column, the eluate heat denatured for 15 min at 70 °C followed by brief centrifugation. The samples were separated by SDS-PAGE electrophoresis (12% Tris-glycine gels) and transferred to a PVDF membrane.
The PVDF membrane was blocked with 5% (w/v) casein in TBST [25 mM Tris, 150 mM NaCl, 0.1% Tween-20 (v/v), pH 7.4] for 1 h at room temperature, then incubated in 2.5% (w/v) casein in TBST containing anti-HA antibody [mAb HA.11 (HA, 16B12, flu tag), 1:10,000 (Covance)] for 1 h at room temperature. The membrane was washed with TBST and PBS [137 mM NaCl, 2.7 mM KCl, 10 mM Na2HPO4, 2 mM KH2PO4] and incubated with 2.5% (w/v) casein in TBST containing secondary antibody [ECL anti-mouse IgG, horseradish peroxidase-linked (NA931, from sheep), 1:15,000 (GE Healthcare)] overnight at 4 °C. The membrane was washed as before and immunodecorated bands visualized using enhanced chemiluminescence (ECL) with autoradiographic film followed by densitometric analysis. For all experiments where the amount of labeling was quantified after pull-down for comparative purposes, the same batch of Rce1p-containing membranes was used for all samples so that they contained equal quantities of Rce1p.
4.5.2. Photoaffinity-labeling of Rce1p using Biotinylated, Photoactive Peptide Substrates
Photolysis reactions were conducted for 20 min as described in section 4.5. Reactions (67.5 μL) contained 100 mM Hepes, 5 mM MgCl2, pH 7.5, 15 μM photoprobe (11, 12, 13, 14, 8, or 9), and 0.25 μg/μL membranes containing or lacking Rce1p. SA pull-down and Western blotting were performed as described in section 4.5.1.
4.5.3. Photolysis Time Course to Determine Maximal Labeling of Rce1p
Membranes containing Rce1p (0.25 μg/μL) were irradiated in the presence of 14 (15 μM) as described in section 4.5 for varying amounts of time (10–60 min). All reactions (67.5 μL) contained 100 mM Hepes, 5 mM MgCl2, pH 7.5, and 15 μM 14. SA pull-down and Western blotting were performed as described in section 4.5.1.
4.5.4. Competition Experiments using 2 and 14
Photolysis reactions were conducted for 30 min as described in section 4.5. All reactions (67.5 μL) contained 100 mM Hepes, 5 mM MgCl2, pH 7.5, 15 μM 14, and 0.25 μg/μL membranes containing Rce1p. 2 was used at 50 μM and 100 μM in the assays evaluating competition. SA pull-down and Western blotting were performed as described in section 4.5.1.
Supplementary Material
Acknowledgments
This research was supported by the National Institutes of Health Grants GM58442 (M.D.D.) and GM067092 (W.K.S.). The authors would like to thank Professor George Barany for use of his automated peptide synthesizer. Some equipment and Bpa peptides 11–14 were supplied by Edgewood Chemical Biological Center (ECBC). We thank Bruce Witthuhn for assistance with acquisition of mass spectral data, LeeAnn Higgins for technical assistance (both of the University of Minnesota Center for Mass Spectrometry and Proteomics), and Emily Hildebrandt for important discussions.
Footnotes
RP-HPLC chromatograms for 6, 9, and 11–14 are provided as Supporting Information as well as MS/MS sequencing and comparative summary tables of mass spectral data for 6 and 10. Additional Supporting Information includes MS/MS sequencing of 11–13, a summary table of mass spectral data for 11–14, and MS/MS sequencing and comparative summary tables of mass spectral data for 14 and 15. Photolysis time course data for 14 is also included.
Publisher's Disclaimer: This is a PDF file of an unedited manuscript that has been accepted for publication. As a service to our customers we are providing this early version of the manuscript. The manuscript will undergo copyediting, typesetting, and review of the resulting proof before it is published in its final citable form. Please note that during the production process errors may be discovered which could affect the content, and all legal disclaimers that apply to the journal pertain.
References
- 1.Roberts PJ, Mitin N, Keller PJ, Chenette EJ, Madigan JP, Currin RO, Cox AD, Wilson O, Kirschmeier P, Der CJ. J Biol Chem. 2008;283:25150. doi: 10.1074/jbc.M800882200. [DOI] [PMC free article] [PubMed] [Google Scholar]
- 2.Wright LP, Philips MR. J Lipid Res. 2006;47:883. doi: 10.1194/jlr.R600004-JLR200. [DOI] [PubMed] [Google Scholar]
- 3.Boyartchuk VL, Ashby MN, Rine J. Science. 1997;275:1796. doi: 10.1126/science.275.5307.1796. [DOI] [PubMed] [Google Scholar]
- 4.Zhang FL, Casey PJ. Annu Rev Biochem. 1996;65:241. doi: 10.1146/annurev.bi.65.070196.001325. [DOI] [PubMed] [Google Scholar]
- 5.Bergo MO, Wahlstrom AM, Fong LG, Young SG. Methods Enzymol. 2008;438:367. doi: 10.1016/S0076-6879(07)38026-9. [DOI] [PMC free article] [PubMed] [Google Scholar]
- 6.Schmidt WK, Tam A, Fujimura-Kamada K, Michaelis S. Proc Natl Acad Sci U S A. 1998;95:11175. doi: 10.1073/pnas.95.19.11175. [DOI] [PMC free article] [PubMed] [Google Scholar]
- 7.Romano JD, Michaelis S. Mol Biol Cell. 2001;12:1957. doi: 10.1091/mbc.12.7.1957. [DOI] [PMC free article] [PubMed] [Google Scholar]
- 8.Bergo MO, Ambroziak P, Gregory C, George A, Otto JC, Kim E, Nagase H, Casey PJ, Balmain A, Young SG. Mol Cell Biol. 2002;22:171. doi: 10.1128/MCB.22.1.171-181.2002. [DOI] [PMC free article] [PubMed] [Google Scholar]
- 9.Otto JC, Kim E, Young SG, Casey PJ. J Biol Chem. 1999;274:8379. doi: 10.1074/jbc.274.13.8379. [DOI] [PubMed] [Google Scholar]
- 10.Manandhar SP, Hildebrandt ER, Schmidt WK. J Biomol Screen. 2007;12:983. doi: 10.1177/1087057107307226. [DOI] [PMC free article] [PubMed] [Google Scholar]
- 11.Mokry DZ, Manandhar SP, Chicola KA, Santangelo GM, Schmidt WK. Eukaryotic Cell. 2009;8:1891. doi: 10.1128/EC.00169-09. [DOI] [PMC free article] [PubMed] [Google Scholar]
- 12.Porter SB, Hildebrandt ER, Breevoort SR, Mokry DZ, Dore TM, Schmidt WK. Biochim Biophys Acta. 2007;1773:853. doi: 10.1016/j.bbamcr.2007.03.004. [DOI] [PMC free article] [PubMed] [Google Scholar]
- 13.Plummer LJ, Hildebrandt ER, Porter SB, Rogers VA, McCracken J, Schmidt WK. J Biol Chem. 2006;281:4596. doi: 10.1074/jbc.M506284200. [DOI] [PMC free article] [PubMed] [Google Scholar]
- 14.Dolence JM, Steward LE, Dolence EK, Wong DH, Poulter CD. Biochemistry. 2000;39:4096. doi: 10.1021/bi9923611. [DOI] [PubMed] [Google Scholar]
- 15.White MA, Clark KM, Grayhack EJ, Dumont ME. J Mol Biol. 2007;365:621. doi: 10.1016/j.jmb.2006.10.004. [DOI] [PMC free article] [PubMed] [Google Scholar]
- 16.Gubbens J, Vader P, Damen JMA, O’Flaherty MC, Slijper M, De Kruijff B, De Kroon AIPM. J Proteome Res. 2007;6:1951. doi: 10.1021/pr060561a. [DOI] [PubMed] [Google Scholar]
- 17.Pei J, Grishin NV. Trends Biochem Sci. 2001;26:275. doi: 10.1016/s0968-0004(01)01813-8. [DOI] [PubMed] [Google Scholar]
- 18.Pei J, Mitchell DA, Dixon JE, Grishin NV. J Mol Biol. 2011;410:18. doi: 10.1016/j.jmb.2011.04.066. [DOI] [PMC free article] [PubMed] [Google Scholar]
- 19.Chen Y, Ma Y, Rando RR. Biochemistry. 1996;35:3227. doi: 10.1021/bi952529s. [DOI] [PubMed] [Google Scholar]
- 20.Ma YT, Gilbert BA, Rando RR. Biochemistry. 1993;32:2386. doi: 10.1021/bi00060a033. [DOI] [PubMed] [Google Scholar]
- 21.Roberts MJ, Troutman JM, Chehade KAH, Cha HC, Kao JPY, Huang X, Zhan C, Peterson YK, Subramanian T, Kamalakkannan S, Andres DA, Spielmann HP. Biochemistry. 2006;45:15862. doi: 10.1021/bi061704+. [DOI] [PubMed] [Google Scholar]
- 22.Chan EWS, Chattopadhaya S, Panicker RC, Huang X, Yao SQ. J Am Chem Soc. 2004;126:14435. doi: 10.1021/ja047044i. [DOI] [PubMed] [Google Scholar]
- 23.Perodin J, Deraeet M, Auger-Messier M, Boucard AA, Rihakova L, Beaulieu ME, Lavigne P, Parent JL, Guillemette G, Leduc R, Escher E. Biochemistry. 2002;41:14348. doi: 10.1021/bi0258602. [DOI] [PubMed] [Google Scholar]
- 24.Sato S, Mimasu S, Sato A, Hino N, Sakamoto K, Umehara T, Yokoyama S. Biochemistry. 2011;50:250. doi: 10.1021/bi1016183. [DOI] [PubMed] [Google Scholar]
- 25.Wittelsberger A, Thomas BE, Mierke DF, Rosenblatt M. FEBS Letters. 2006;580:1872. doi: 10.1016/j.febslet.2006.02.050. [DOI] [PubMed] [Google Scholar]
- 26.Best MD, Rowland MM, Bostic HE. Accts Chem Res. ACS ASAP; [Google Scholar]
- 27.Dorman G, Prestwich GD. Biochemistry. 1994;33:5661. doi: 10.1021/bi00185a001. [DOI] [PubMed] [Google Scholar]
- 28.Jahn O, Eckart K, Tezval H, Spiess J. Anal Bioanal Chem. 2004;378:1031. doi: 10.1007/s00216-003-2353-8. [DOI] [PubMed] [Google Scholar]
- 29.Brunner J. Annu Rev Biochem. 1993;62:483. doi: 10.1146/annurev.bi.62.070193.002411. [DOI] [PubMed] [Google Scholar]
- 30.Rajagopalan K, Chavan AJ, Haley BE, Watt DS. J Biol Chem. 1993;268:14230. [PubMed] [Google Scholar]
- 31.Hollander I, Frommer E, Mallon R. Anal Biochem. 2000;286:129. doi: 10.1006/abio.2000.4795. [DOI] [PubMed] [Google Scholar]
- 32.Hollander I, Frommer E, Aulabaugh A, Mallon R. Biochim Biophys Acta. 2003;1649:24. doi: 10.1016/s1570-9639(03)00150-x. [DOI] [PubMed] [Google Scholar]
- 33.Kale TA, Raab C, Yu N, Dean DC, Distefano MD. J Am Chem Soc. 2001;123:4373. doi: 10.1021/ja0012016. [DOI] [PubMed] [Google Scholar]
- 34.Kale TA, Turek TC, Chang V, Gautam N, Distefano MD. Methods Enzymol. 2002;344:245. doi: 10.1016/s0076-6879(02)44719-2. [DOI] [PubMed] [Google Scholar]
- 35.Kyro K, Manandhar SP, Mullen D, Schmidt WK, Distefano MD. Bioorg Med Chem. 2010;18:5675. doi: 10.1016/j.bmc.2010.06.024. [DOI] [PMC free article] [PubMed] [Google Scholar]
- 36.Xue CB, Becker JM, Naider F. Tetrahedron Lett. 1992;33:1435. [Google Scholar]
- 37.Kale TA, Distefano MD. Org Lett. 2003;5:609. doi: 10.1021/ol026752a. [DOI] [PubMed] [Google Scholar]
- 38.Kale TA, Raab C, Yu N, Aquino E, Dean DC, Distefano MD. J Labelled Compd Radiopharm. 2003;46:29. [Google Scholar]
- 39.Anderson JL, Frase H, Michaelis S, Hrycyna CA. J Biol Chem. 2005;280:7336. doi: 10.1074/jbc.M410292200. [DOI] [PubMed] [Google Scholar]
- 40.Bergo MO, Leung GK, Ambroziak P, Otto JC, Casey PJ, Young SG. J Biol Chem. 2000;275:17605. doi: 10.1074/jbc.C000079200. [DOI] [PubMed] [Google Scholar]
- 41.Tam A, Schmidt WK, Michaelis S. J Biol Chem. 2001;276:46798. doi: 10.1074/jbc.M106150200. [DOI] [PubMed] [Google Scholar]
- 42.Tam A, Nouvet FJ, Fujimura-Kamada K, Slunt H, Sisodia SS, Michaelis S. J Cell Biol. 1998;142:635. doi: 10.1083/jcb.142.3.635. [DOI] [PMC free article] [PubMed] [Google Scholar]
- 43.Sikorski RS, Hieter P. Genetics. 1989;122:19. doi: 10.1093/genetics/122.1.19. [DOI] [PMC free article] [PubMed] [Google Scholar]
- 44.Elble R. BioTechniques. 1992;13:18. [PubMed] [Google Scholar]
- 45.Turek TC, Gaon I, Distefano MD, Strickland CL. J Org Chem. 2001;66:3253. doi: 10.1021/jo991130x. [DOI] [PubMed] [Google Scholar]
Associated Data
This section collects any data citations, data availability statements, or supplementary materials included in this article.