Abstract
Soluble guanylyl cyclase (sGC), the key enzyme for the formation of second messenger cyclic GMP (cGMP), is an authentic sensor for nitric oxide (NO). Binding of NO to sGC leads to strong activation of the enzyme activity. Multiple molecules and steps of NO binding to sGC have been implicated, but the target of the second NO and the detailed binding mechanism remain controversial. In this study, we used 15NO and 14NO and anaerobic sequential mixing-freeze quench EPR to unambiguously confirm that the heme Fe is the target of the second NO. Linear dependence on NO concentrations up to 600 s−1 for the observed rate of the second step of NO binding not only indicates that the binding site of the second NO is different from that in the first step, i.e. the proximal site of the heme, but also support a concerted mechanism in which the dissociation of the His105 proximal ligand occurs simultaneously with the binding of the second NO molecule. Computer modeling successfully predicts the kinetics of formation of a set of five-coordinate NO complexes with the ligand on either the distal or proximal site and supports a selective release of NO from the distal side of the transient bis-NO sGC complex. Thus, as has been demonstrated with cytochrome c', a five-coordinate NO-sGC containing a proximal NO is formed after the binding of the second NO.
Keywords: nitric oxide, soluble guanylyl cyclase, binding mechanism
Mammalian soluble guanylyl cyclase (sGC) is an authentic heme-based sensor for nitric oxide (NO). The catalytic center of sGC is formed by the C-terminal halves of both α and β subunits, while the heme center is located in the N-terminal domain of the β subunit. Resting sGC has a five-coordinate (5c) ferrous heme (Fe(II)) containing a proximal histidine ligand (His105) (1). Binding of NO to the heme center increases its basal activity for catalytic conversion from GTP to cyclic GMP by several hundred times (2, 3). sGC does not bind oxygen, but binds carbon monoxide (CO), which only causes a few fold increase of activity. CO binding to sGC differs from NO binding in three aspects: 1) CO binds sGC as a single-reversible step while NO binds sGC as a multiple, and overall irreversible process with an apparent KD at pM level (4); 2) CO binding to sGC forms a stable six-coordinate (6c) complex, while NO binding causes dissociation of the proximal histidine ligand to form a 5c NO-sGC complex; 3) only one molecule of CO binds to sGC, but two molecules of NO bind to sGC sequentially, and both the first step, formation of a 6c NO complex and the second step, further conversion to a 5c NO complex, exhibit NO concentration dependence (4).
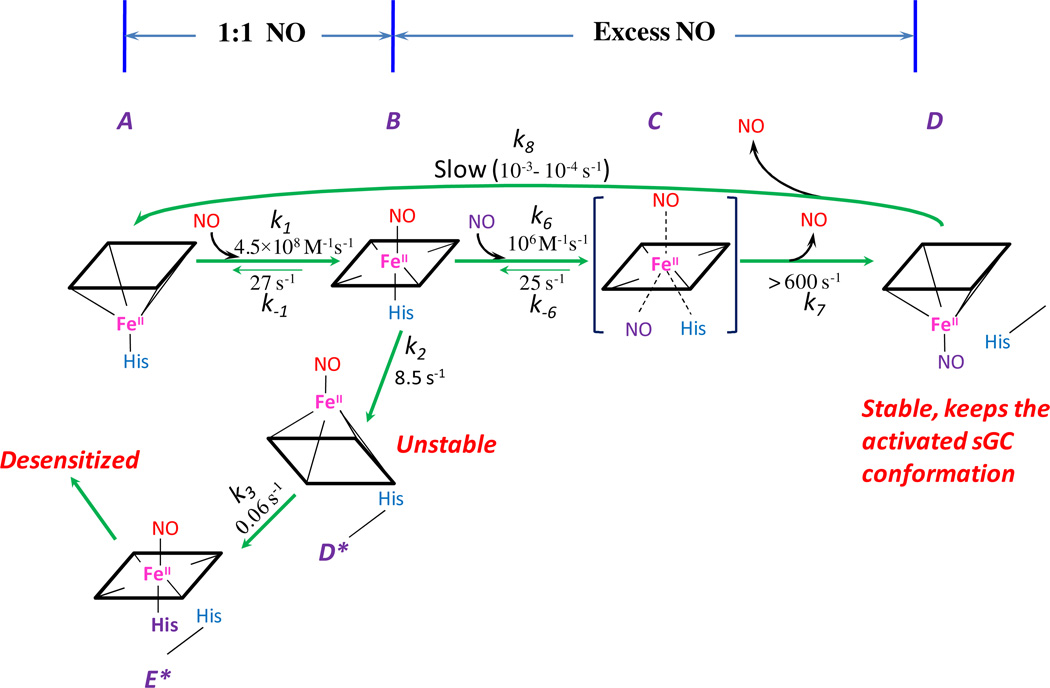
The binding site of the second NO has not been determined. It was postulated to bind to the sGC heme iron as a proximal ligand by displacing the original histidine ligand, His105, similar to that demonstrated for cytochrome c' by mutagenesis and crystallographic analysis (5, 6). An alternative proposal for the binding site of the second NO is a cysteine thiol, or at a non-heme site during the activation process (7–11). However, nitrosation of cysteine does not occur in the absence of oxygen, and even in the presence of oxygen the reaction is too slow to contribute to the observed fast NO binding (12, 13). As no evidence indicates an additional metal center nearby the heme iron that could be a second NO target, it is more plausible to test the idea of heme as the binding site for the second NO molecule as represented by Scheme 1 (A ↔ B ↔C). Based on the observed [NO]-dependence of the B ↔ C conversion, the second molecule of NO has to bind to the heme to cause spectral changes and this site cannot be the distal site of the heme, otherwise [NO]-dependence would not be observed. It is only logical to assume that the second NO targets the proximal side of the heme iron, to form a transient bis-NO sGC complex, Fe(II)(NO)2, (or a quaternary transition complex, C, in Scheme 1), which then transforms further into a stable 5c NO complex, 5pFe(II)NO, (B ↔ C → D in Scheme 1). However, there is no direct evidence for whether the remaining heme-bound NO ligand comes from the 2nd molecule of NO and whether this ligand is at the distal or proximal side of the heme. We would like to resolve these key issues to fully understand the interaction between NO and sGC and the coupling between NO binding and sGC activation.
Scheme 1.
Reaction mechanism between NO and sGC. Species A, B, C, D, D* and E* are identified by rapid-scan UV-Vis spectroscopic and EPR under stoichiometric and excess amount of NO. Rate constants for each chemical step were determined by us at 24 °C except the slow dissociation from D to A, where measurements from literature are used (27, 28). The reactions with stoichiometric NO, A ↔ B → D* → E* → desensitized sGC is a simplified version as compared to Table 1 whereas the cycling from B back to A was measured when 1 mM CO and 25 mM dithionite was added at the time of maximal formation of B (19). The proximal histidine ligand (in purple color) denotes an alternative histidine, likely His107.
To confirm if heme is the target of the second NO and to demonstrate that the second NO binds to the proximal site of the heme, we used 15NO and 14NO as heme ligand structural probes for the two NO binding steps in combination with sequential stopped-flow and freeze-quench/ EPR and followed the kinetics of multiple steps of NO binding to sGC. We took advantage of the power of EPR in discriminating between isotopic NO-sGC binding complexes and succeeded in generating unambiguous answers for the key questions raised above and also derived a unified mechanistic model regarding the interaction between NO and sGC.
Material and Methods
Protein expression and purification
sGC enzyme was expressed in Sf9 cells and purified by anion-exchange and affinity chromatography as detailed previously (13). The sample was supplemented with 1 mM MgCl2 and stored at −80 °C in 25% glycerol. The preparations were at least 95% pure as judged by SDS-PAGE with Coomasie Blue staining and immunoblotting. Anaerobic sGC sample was prepared in a glass tonometer via a 5-cycle vacuum (30 s) /argon replacement (5 min) on an anaerobic train.
Preparation of NO Solutions
14NO solution was prepared using the 99.9% pure 14NO gas, which was further cleaned up from degradation products by passing through a U-shaped tube filled with dry KOH pellets. Anaerobic 50 mM triethanolamine, TEA, pH 7.4, buffer prepared by 10 minutes of nitrogen purging was bubbled for additional 10 min with purified 14NO to obtain a ~2 mM solution. The solution was kept in a gas-tight glass tonometer and stored in an anaerobic chamber (Coy Laboratory Products, Inc. MI). The stock solution of 15NO (Cambridge Isotope Labs, Andover, MA) was prepared similarly. The exact concentration of NO in the stock solution was determined using an oxyhemoglobin (HbO2) assay (14). Working NO solutions of different concentrations were prepared by adding the necessary amount of NO stock to a plastic gas-tight syringe containing anaerobic 50 mM TEA, pH 7.4 and used immediately for measurements.
Monitoring of sGC-NO complex formation
The dynamics of the sGC-NO complex formation was monitored at room temperature (24 °C) in the anaerobic chamber, using a Bio-SEQUENTIAL DX-18MV stopped-flow instrument (Applied Photophysics, Leatherhead, UK). The time-dependent UV-Vis spectra and single-wavelength kinetic data were recorded with a rapid scan photodiode array detector at a rate of 400 scans/sec for up to one second and with single-wavelength mode of the stopped-flow, respectively. We always found good match in kinetics and amplitude change at each wavelength at both rapid-scan and single-wavelength mode, indicating minimal extra photodissociation or photodecomposition of any intermediates caused by stronger light intensity in the rapid scan measurements.
Trapping sGC-NO complexes by freeze quench
Single stage rapid freeze quench (RFQ) at 24 °C was performed using our Update Instrument (Madison, WI) System 1000 located in an anaerobic chamber and prechilled isopentane as previously described (15, 16).
To freeze trap different intermediates of the NO/sGC reaction with two stage mixing, sGC-NO complexes were prepared using the same anaerobic sequential stopped-flow and an open-end flow cell controlled by a double-push program. Two knurled-screw plungers of the instrument were preset to deliver equal volumes of reactants with each push. In the first push, 9 µM sGC sample was mixed with equal volume of 10 µM 14NO and incubated in the aging loop of the stopped-flow instrument for 20 msec. With the second push, the preformed sGC-14NO complex was mixed with equal volumes of 5 or 50 µM 15NO and displaced from the system by 50 mM TEA, pH 7.4. The samples were captured in an EPR tube and immediately plunged into a dry-ice/ethanol bath (−30 °C). It took 5 – 10 s to completely freeze the sample in the 5 mm EPR tube. Subsequently, the sample was transferred out of the anaerobic chamber and into liquid nitrogen. In some control experiments the second NO solution was replaced by buffer. In other experiments sGC was first reacted with 15NO solution, followed by a second mixing with 14NO.
Such freeze-quench experimental arrangement allows for acquisition and direct comparison of both optical and EPR data from identical samples. It also avoids the packing factor of the rapid-freeze in isopentane that adds another ~ 2× dilution and heterogeneity of the final packed samplein our rapid-freeze instrument.
EPR spectroscopy
Liquid nitrogen temperature EPR spectra were recorded with a Bruker EMX spectrometer using a BVT3000 temperature controller and a silver-coated double-jacketed glass transfer line (17). The conditions for EPR measurements at 110K were: frequency, 9.2 GHz; modulation amplitude, 2 G; modulation frequency, 100 kHz; and time constant, 0.33 s.
Mathematical modeling
Numerical integration to simulate our NO complex intermediates, especially the 5c NO-sGC intermediates, was conducted using the feature of a kinetic block, containing all the chemical steps as listed in Table 1 (Scheme 1) and the rate constants determined by us at 24 °C, in the SCoP program (Simulation Resources Inc., Redlands, CA) as we reported previously (18, 19).
Table 1.
Reaction steps and rate constants for the NO binding mechanism of sGC.
| Reaction step | (Terms in Scheme 1) | Rate constant | Value a |
|---|---|---|---|
| 5cFe(II) + NO ↔ 6cFe(II)NO | (A ↔ B) | k1 / k−1 | 4.5 × 10⁸ M−1s−1 / 27 s−1 |
| 6cFe(II)NO ↔ 5cFe(II)NOb | (B ↔ D*) | k2 / k−2 | 8.5 s−1 / 0.001 s−1 |
| 5cFe(II)NO ↔ 6cxFe(II)NOb | (D* ↔ E*) | k3 / k−3 | 0.06 s−1 / 0 s−1 |
| 6cxFe(II)NO ↔ 5cxFe(II)b | k4 / k−4 | 2 s−1 / 0 s−1 | |
| 5cxFe(II) ↔ 5cFe(II)NOb | k5 / k−5 | 0.006 s−1 / 0 s−1 | |
| 6cFe(II)NO + NO ↔ Fe(II)(NO)2 | (B ↔ C) | k6 / k−6 | 1.1 × 10⁶ M−1s−1 / 25 s−1 |
| Fe(II)(NO)2 ↔ 5pFe(II)NO | (C ↔ D) | k7 / k−7 | 1000 s−1 / 0 s−1 |
| 5pFe(II)NO ↔ 5cFe(II) + NO | (D ↔ A) | k8 / k− 8 | 0.0001 s−1 / 0 s−1 |
Results and Discussion
Heme is the binding site of the second NO molecule
Our first goal was to confirm that the heme is the target of the second NO. For this purpose, we used symmetric sequential-mixing stopped-flow of sGC with NO solutions containing different nitrogen isotopes in the two reaction stages. Such kinetic measurement led to two times dilution in the first mixing and another two times dilution in the second mixing (20). To avoid any confusion of the sample concentrations, all values presented here are the starting concentrations "before" mixing unless indicated otherwise.
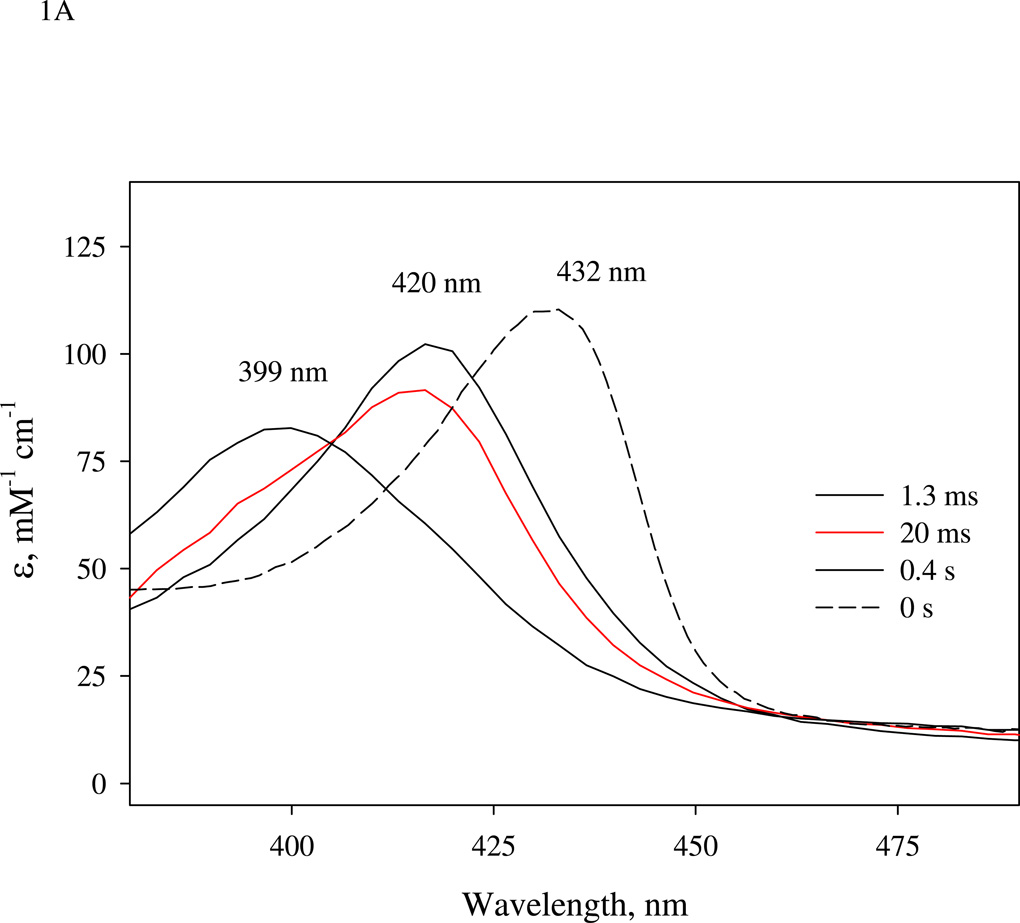
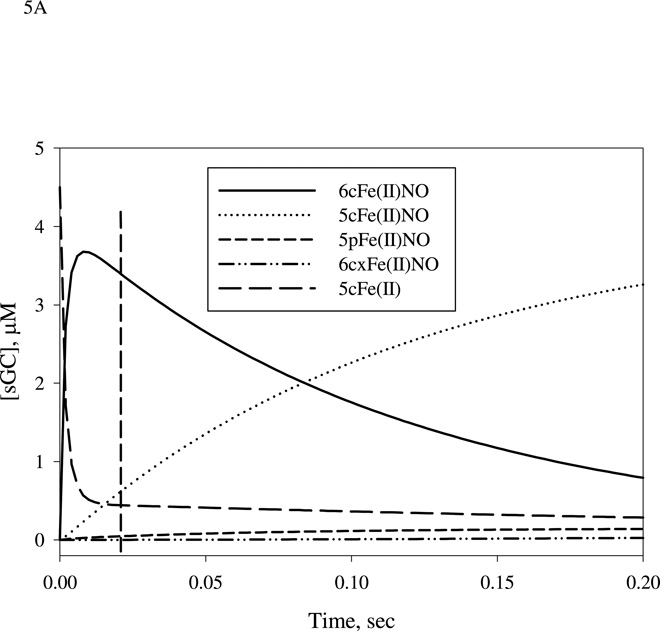
Before conducting the freeze trap EPR kinetic experiments using isotopic NO, we ran parallel optical kinetic measurements to optimize the aging time of the sequential mixing. A one-stage mixing rapid-scan measurement of the anaerobic reaction between ~ 7 µM sGC and 7 µM NO showed a 420 nm intermediate that peaked at at 1.5 ms, mainly the 6c NO-sGC (or 6cFe(II)NO in Table 1)(Fig. 1A). The very fast first step conversion from the resting ferrous sGC, with a Soret peak at 432 nm, to the 6c NO-sGC, was totally complete within the 1.5 ms dead time of our stopped-flow instrument. This intermediate transformed within 1 s further to a species with a 399 nm peak, the 5c NO-sGC (or 5cFe(II)NO in Table 1) with an isosbestic point at 405 nm (Fig. 1A), seemingly indicating that only one chemical step was involved, consistent with previous observations (4, 13). Our recent study indicates that the first-step of NO binding to sGC has an association rate constant (k1) of 4.5 × 10⁸ M−1 s−1 and a dissociation rate constant (k−1) of 27 s−1 at 24 °C (Table 1 and (19)). As estimated by the 420 nm amplitude at 20 ms, ~ 80% of the enzyme was present as 6c NO-sGC (Fig. 1A). This same amount of 6c NO-sGC was predicted by computer simulation (Fig. 5A below). The 20 ms was chosen as the minimal reliable aging time for our sequential stopped-flow instrument, and also the point where the 6c NO-sGC complex is still the dominant sGC species before conversion to 5cNO-sGC.
Figure 1.
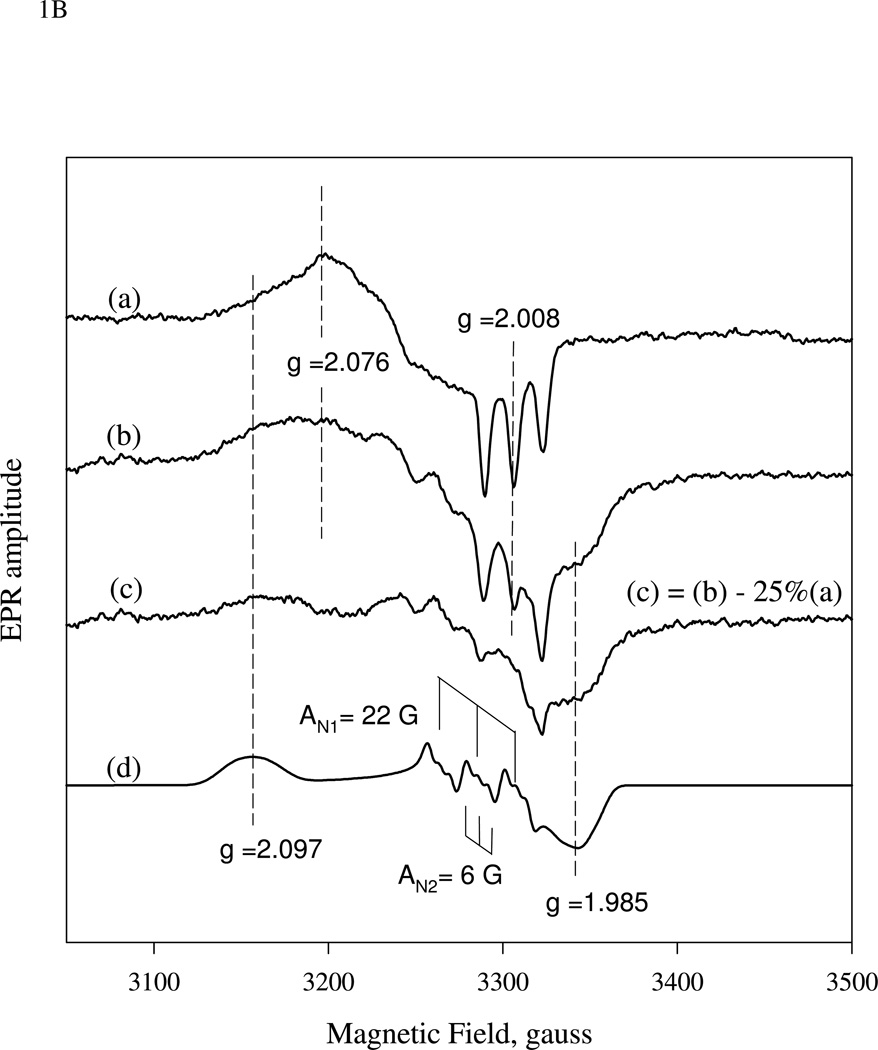
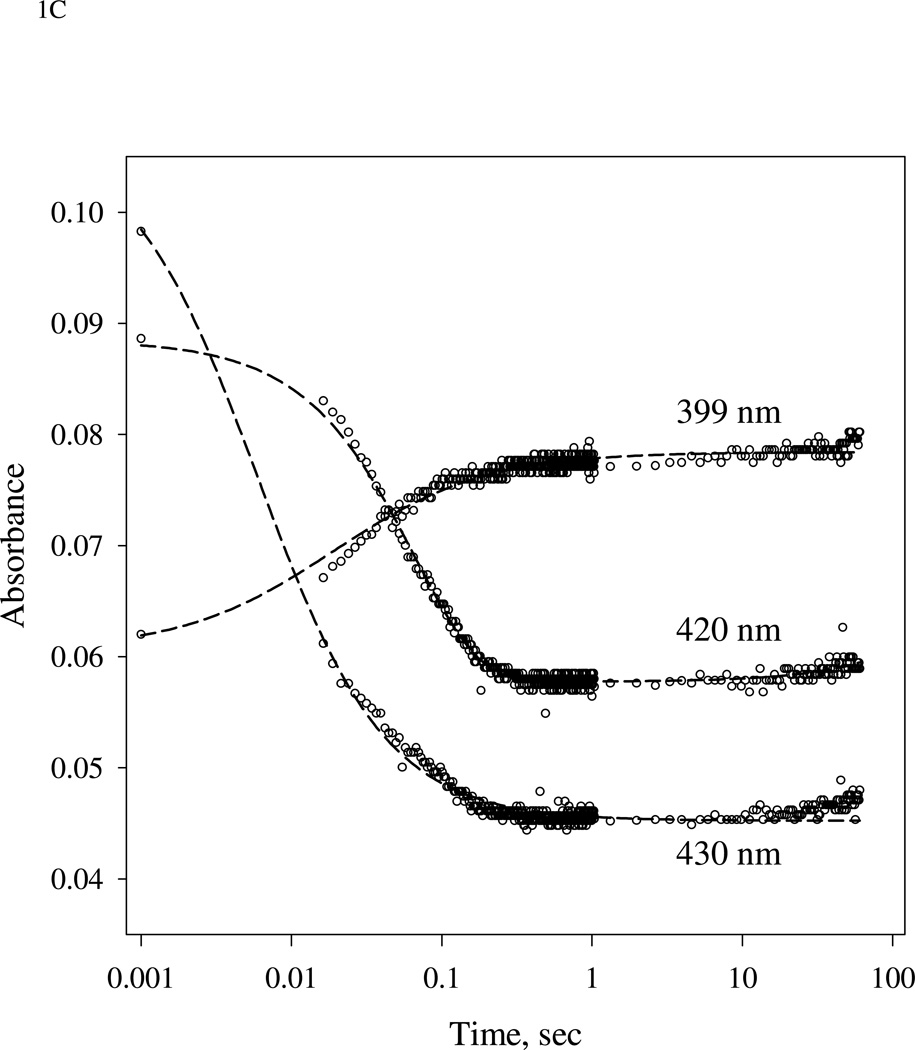
(A).Time-resolved spectra of the reaction between sGC and stoichiometric amount of NO. NO binding reactions of sGC monitored by rapid-scan single mixing at 24 °C. Both sGC and NO were at 7 µM. Three spectra recorded at 1.3 ms, 20 ms and 1.0 s out of the 400 collected are shown. A matching resting Fe(II) sGC spectrum collected on a HP8453 spectrophotometer is also shown as "zero" time control (dashed line). (B). Transient formation of 6c NO-sGC identified by RFQ EPR kinetic measurement. 10 µM each of sGC and NO was reacted at 24 °C by single-stage equal mixing and freeze trapped by cold isopentane (113 K). The ram velocity was 1.25 cm/s and the packing factor was 0.45 (16). The EPR spectra for samples trapped at 20 ms, (b), and 5 s, (a) are one out of three repeats, which show similar results. Spectrum (c) is the difference between (b) and 25% of (a) to reveal the dominant 6c NO-sGC species. Simulation of the EPR of 6c NO-sGC, spectrum (d), was done by Simfonia as frozen powder sample. Hyperfine splitting constants related to the nitrogen nuclei from NO, AN1, and His105, AN2, are indicated. Spectra (a) and (b) are the average of 32 scans. Key g values for the NO-sGC complexes are also indicated. (C). Kinetics of the resting sGC (by A432 nm), 6c NO-sGC (A420 nm) and 5c NO-sGC (A399 nm) in the second stage reaction of the anaerobic sequential stopped flow at 24 °C. Reaction in the first stage was between 5 µM sGC and 5 µM NO, and the mixture, after 20 ms delay, was further reacted with 5 µM NO in the 2nd mixing. Dashed lines are visual guide connecting all data points which are not evenly distributed in logarithmic scale, especially those < 10 ms.
Figure 5.
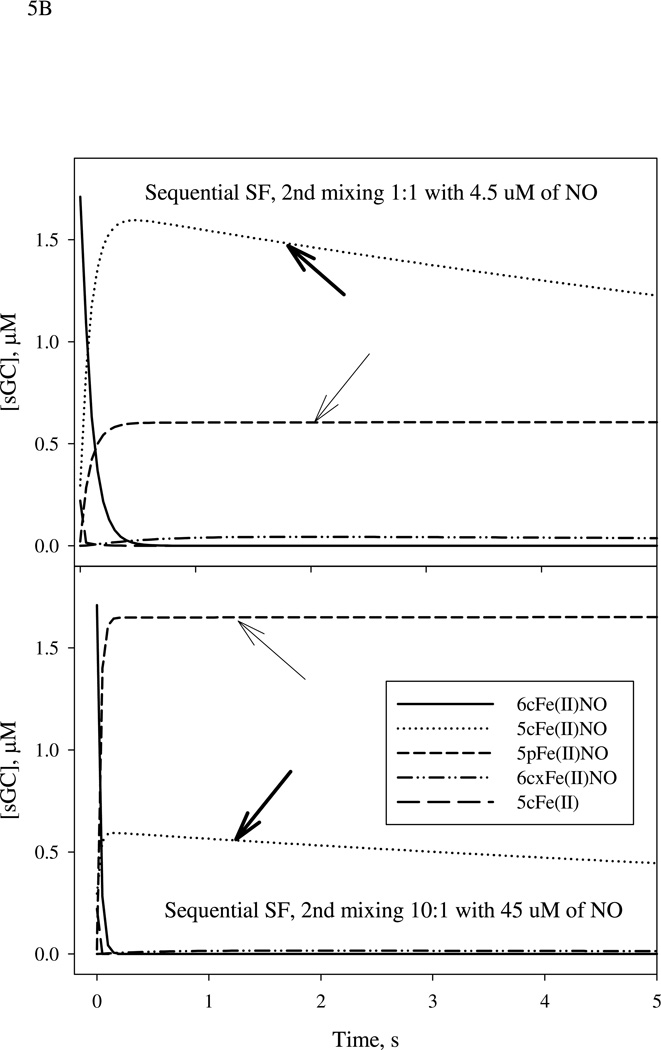
Simulation of the kinetics of 5cFe(II), 6cFe(II)NO, 5cFe(II)NO, 5pFe(II)NO and 6cxFe(II)NO. Data were generated using the parameter values listed in Table 1. A: The optimal aging time of ~20 ms for the formation of 6c Fe(II)NO in the first mixing (solid line) between 9 µM sGC and 10 µM NO is indicated by a vertical dashed line. B: The time-dependent changes of various intermediates, especially those for the five-coordinate NO complexes: 5cFe(II)NO (dotted line) and 5pFe(II)NO (short-dashed line) indicated by thick and thin arrows, respectively, during 5 sec reaction after 2nd mixing with 5 µM (top panel) or 50 µM (bottom panel) of NO. Notice the large change of the relative ratio between 5cFe(II)NO and 5pFe(II)NO when NO:sGC ratio is changed from 1:1 to 10:1. The matching values of this ratio for individual freeze-trap EPR experiments shown in Figs. 2 and 3 were derived by mathematical modeling and are listed in Table 2.
Transient formation of the 6c NO-sGC was also confirmed by one-stage rapid-freeze EPR measurements. As shown in Fig. 1B, equal mixing of 10 µM each of sGC and NO followed by freeze trapped at 20 ms yielded an EPR consistent with a mixture of 6c rhombic and 5c axial low-spin NO-heme complex (spectrum (b)). In contrast, the sample freeze trapped at ~5 seconds after mixing showed a spectrum typical for 5c axial NO-heme (spectrum (a)) with gx= gy = 2.076 and gz= 2.008 with a typical three-line hyperfine, AN = 17 G, caused by the nitrogen nucleus of NO. Arithmetic analysis with spectra (a) and (b) normalized to the same spin concentration indicated that the sample freeze trapped at 20 ms is dominated by the 6c NO-sGC, which accounts for ~75 % of the total sGC (spectrum (c), which is the difference between (b) and 25% of (a)). The EPR spectrum of the resolved 6c NO-sGC was optimally simulated by rhombic NO-heme with g values at 2.097, 2.018 and 1.985 and a 9-line (3×3) hyperfine pattern caused by nitrogen nuclei from NO (AN1 = 22 G) and the proximal histidine, H105 (AN2 = 6G) (spectrum (d)). Although similar EPR result for the 6c NO-sGC was obtained by reacting sGC with NO releaser at −24 °C in a buffer containing 40% ethylene glycol and manual freezing (21), the data shown in Fig. 1B is the first obtained by RFQ EPR. Kinetically, the contribution of 6c NO-sGC to the EPR data appears to match nicely with the optical kinetic data shown in Fig. 1A and that predicted by computer modeling (Fig. 5A).
In the next step we examined the kinetic change of different intermediates of NO sGC interaction in a sequential mixing experiment. The 5 µM sGC was mixed with 5 µM NO at first stage mixing and aged for 20 ms and then reacted with another 5 µM NO in the 2nd stage mixing. The disappearance of 6cFe(II)NO, monitored at 420 nm, and formation of 5c NO-sGC followed at 399 nm, were fast and reached plateau after ~0.2 s (Fig. 1C). The level of 6cFe(II)NO, 5c NO-sGC and even 5c Fe(II) sGC remained pretty much unchanged within 0.5 s – 60 s period after the 2nd mixing (Fig. 1C), indicating that the amount of all 5c sGC-NO species basically plateaued for a period of ≫ 10 s after the 2nd mixing. This result also indicates that during one minute period after the 2nd mixing there is not much cycling from 5c NO-sGC back to the resting ferrous sGC to enable another cycle of NO interaction.
To trap various NO-sGC intermediates for EPR characterization, we generated the maximal amount of 6c NO-sGC in the first stage mixing of the sequential stopped-flow and after 20 ms reaction was further mixed with the second NO with the opposite nitrogen isotope in the second stage. As the nuclear spins of 15N and 14N are 1/2 and 1, respectively, we expected to see a very contrasting 2-line (AN ~ 22 G for 15NO) or 3-line (AN ~ 17 G for 14NO) z-hyperfine splitting pattern in the EPR of the 5c NO-sGC depending upon whether 15NO or 14NO is the remaining heme ligand. Combination of isotopic NO and EPR spectroscopy is probably a much more effective approach in following the identity of the heme-bound NO and its coordination site, either proximal or distal, in the first and second binding steps than other spectroscopic methods, such as Resonance Raman or Mössbauer, considering signal resolution, sample usage and ease of execution of the measurements.
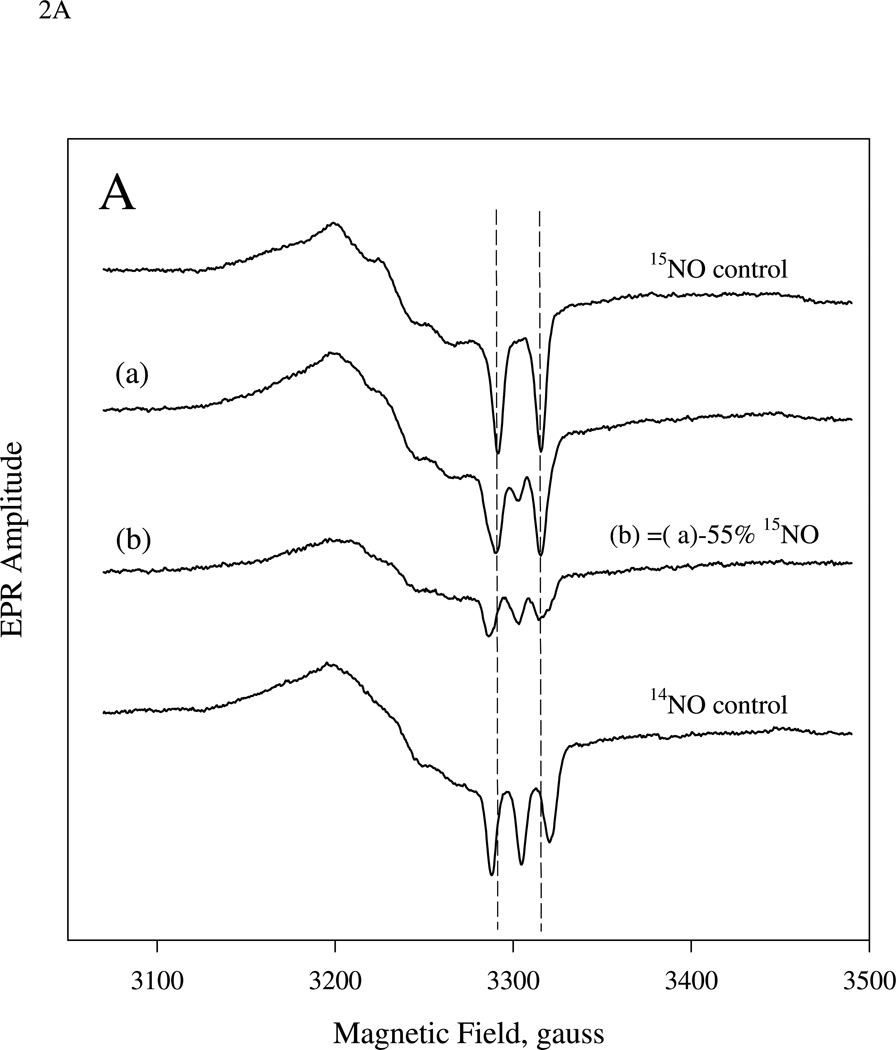
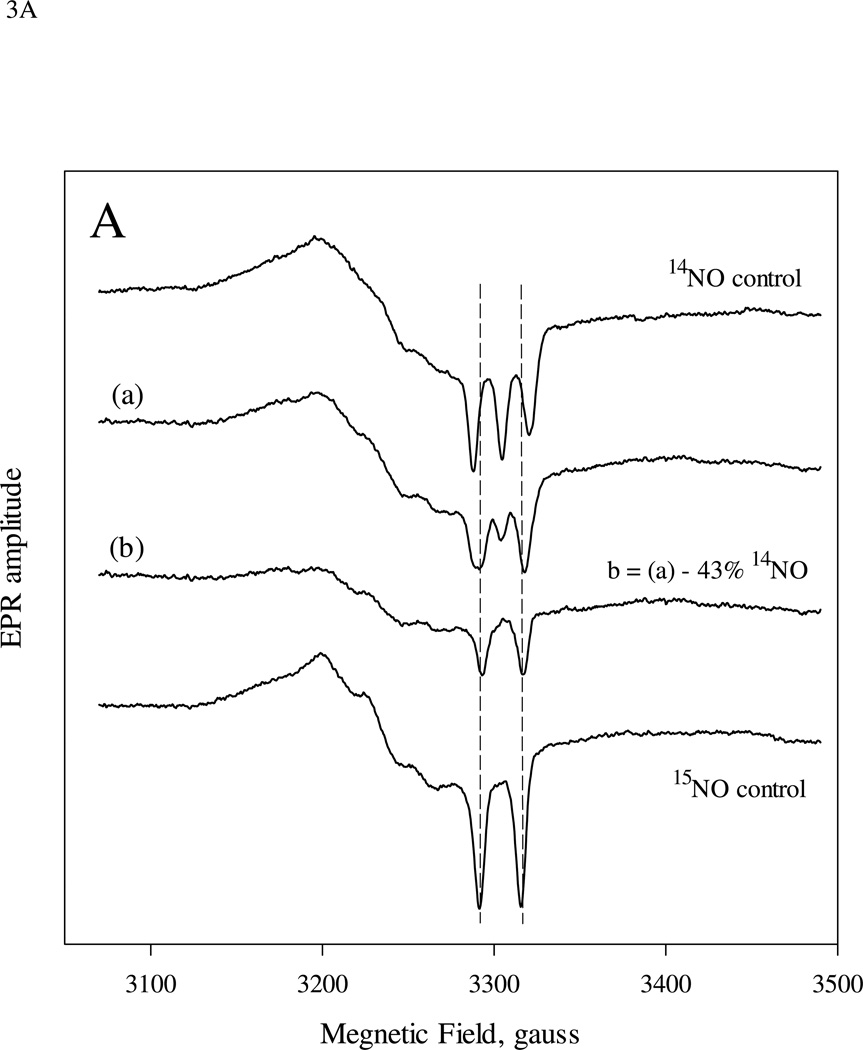
The pure 5c 15NO- and 14NO- sGC control samples created by reacting at 9 µM sGC 24 °C with excess of either 15NO or 14NO display typical axial EPR spectra with, respectively, prominent two-line and three-line hyperfine features for the gz component (Fig. 2A, top and bottom control spectra). The EPR spectrum for the sample obtained by mixing 9 µM sGC first with 10 µM 15NO and then with 5 µM 14NO ((1:1):1 two-stage mixing) followed by freeze-trapping for 5–10 s at −30 °C is shown in Fig. 2A (spectrum (a)). This spectrum corresponds to 5c NO-sGC containing a mixture of the 15NO and 14NO control spectra. Subtraction of 55% of the 15NO control spectrum from the experimentally obtained spectrum (a) yields a difference EPR spectrum with a lineshape essentially identical to that of the 14NO control (Fig. 2A, (b) vs. bottom spectrum).
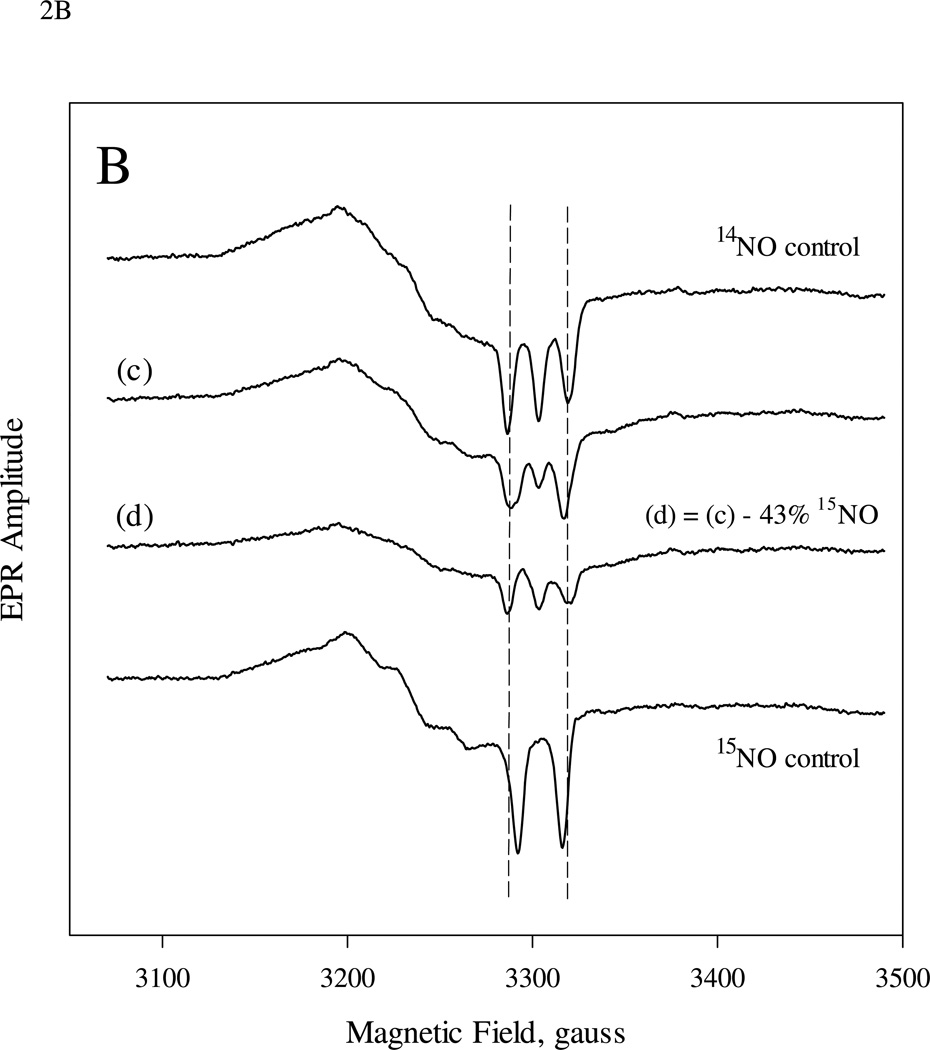
Figure 2.
EPR spectra of sGC which reacted sequentially with stoichiometric amount of 15NO and 14NO (A), or with a reverse sequence of the isotopic NO (B). The sequential stopped-flow and freeze trap procedure was detailed in the Methods. 20-ms aging time for the first mixing was used and sGC concentration was 9.0 µM for both experiments. A: 10.0 and 5.0 µM of isotopic NO ligand was used in the first and second mixing, respectively. The 14NO- and 15NO-control spectra of 5c NO-sGC generated from 9.0 µM sGC with excess of individual isotopic NO and manually frozen after ~ 10 s are shown as the top and bottom spectra. Spectrum (a) is the EPR of the freeze trapped sample 5–10 s after 2nd mixing and (b) is the difference spectrum between (a) and 55% of 15NO control. Spectrum (c) is the equivalent to (a) in (A), but with opposite isotopic NO sequence. Spectrum (d) is the difference between (c) and 43% of 15NO control. All spectra are normalized against their total spin concentration by double integration. The difference spectra: (b) and (d) are the optimally resolved EPR, containing essentially pure spectrum of either 15NO or 14NO- control EPR. This was achieved by serial arithmetic subtraction from the EPR of individual freeze-trapped sample: (b) or (d), by different fraction of the control spectrum and visual comparison with either control spectrum. EPR conditions were described in the Methods section and each spectrum is the average of 8 – 20 repetitive scans.
In the second experiment, we reversed the order of the isotopic NO, i.e. 9 µM sGC first reacted with 10 µM 14NO and then with 5 µM 15NO ((1:1):1 two-stage mixing). The EPR spectrum of the trapped sample was best expressed as a mixture of 5c NO-sGC containing 57% 14NO and 43% 15NO (Fig. 2B). Although the isotopic NO was swapped in this experiment, the isotope distribution is very similar to that in Fig. 2A, indicating that the two isotopic NO ligands have the same binding behavior.
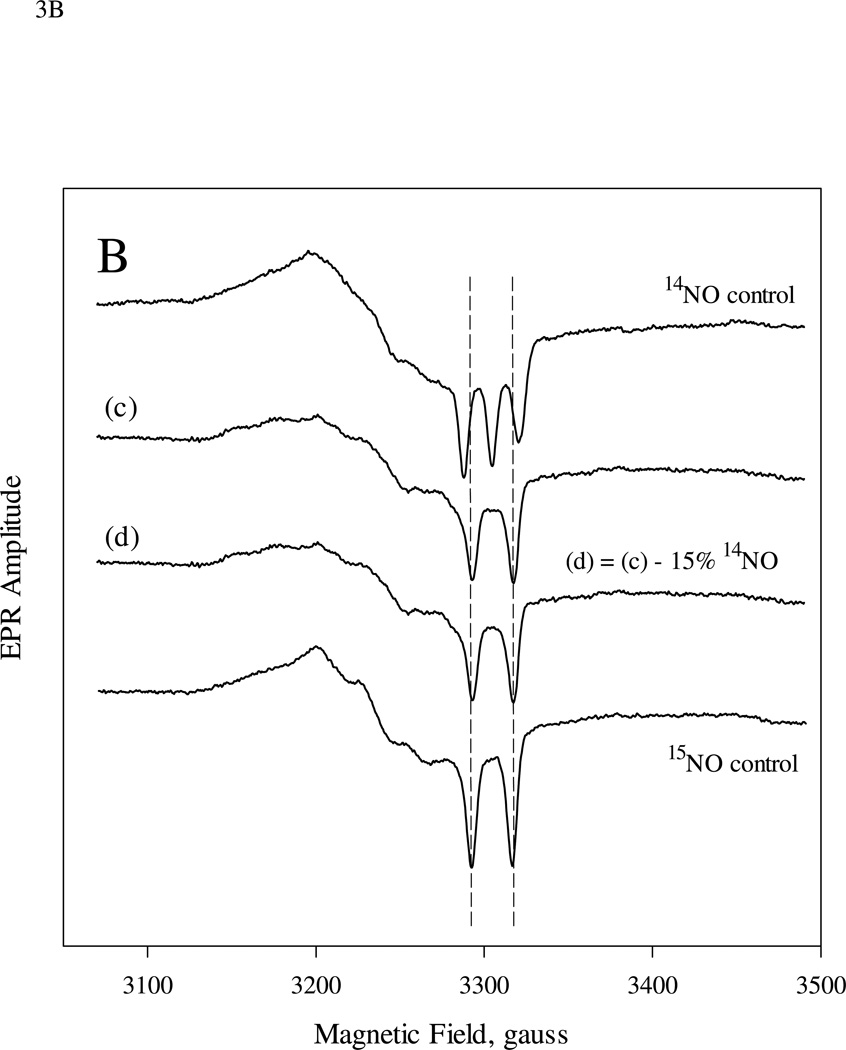
To see the effect of a modest excess of NO in the first mixing, we mixed 9 µM sGC with 15 µM 14NO and aged the sample for 20 ms before further mixing it with 7.5 µM 15NO and freeze-trapping ((1:1.6):1.6 two-stage mixing). This sample gave a composite EPR (Fig. 3A, (c)) that is best simulated as a mixture of 43% 5c 14NO- and 57% 5c 15NO-sGC (Fig. 3A (d) vs. the bottom spectrum). The amount of 15NO retaining in the final sample was increased from the experiment with (1:1):1 mixing scheme (i.e. 43%, Fig. 2B).
Figure 3.
EPR spectra of sGC (9.0 µM) reaction with excess NO in either the first-stage (A) or second-stage (B) reaction of the sequential mixing experiments. A: 15 µM of 14NO and 7.5 µM 15NO was used in the first and 2nd mixing, respectively. Spectrum (a) is the EPR of the freeze trapped sample 5-10 s after 2nd mixing and (b) is the difference spectrum between (a) and 43% that of 14NO control. B: similar to A, but 10 µM 14NO and 50 µM 15NO were used in the 1st and 2nd mixing. Spectrum (c) is the EPR of the freeze trapped sample and (d) is the difference spectrum between (c) and 15% that of 14NO control.
To test whether the ratio between the 15NO- and 14NO- sGC complexes can be substantially modulated by varying the concentration of the NO present at the second mixing, we first mixed 9 µM sGC with 10 µM 14NO and aged it for 20 ms before further mixing with 50 µM (i.e. 10×) 15NO ((1:1):10 two-stage mixing) and freeze- trapped the resulting sample. The EPR of this sample (Fig. 3B, (e)) can be optimally simulated as a mixture of 15% 14NO- and 85% 15NO-sGC (Fig. 3B, (f)), indicating that we were able to enrich a specific isotope-labeled 5c NO-sGC complex by greatly increasing its concentration at the second mixing.
The presence of a substantial amount of the same nitrogen isotope in the final 5c NO-sGC complex as in the NO ligand used for the second mixing convincingly demonstrates that the heme iron is the binding site for the second NO molecule. The occupancy of the final 5c NO-sGC by the isotope used in the second mixing increased from 43% to 85% when the NO stoichiometry was raised from 1× to 10× relative to the level of heme. This increase is substantial and such a large extent of isotope replacement of the bound NO ligand deserves a quantitative mechanistic interpretation (see below).
Insignificant isotope scrambling during 5–10 s period of freeze trap
To maximize the amount of 6c NO-sGC, we need to use rapid-mixing technique for the first stage mixing totrack a fast reversible binding step with 4.5 × 10⁸ M−1 s−1 kon and 27 s−1 koff (k1/k−1 in Table 1 and Scheme 1) in order to select the best delay time before the 2nd stage mixing. Although the 5c NO-sGC complex formed after the second NO mixing appeared to be stable for at least one minute (Fig. 1C), the 5–10s freezing time of the sample after the second mixing may potentially contribute to some isotope scrambling. This event may occur due to a possible NO dissociation from the projected transient bis-NO quaternary complex (C in Scheme 1), followed by the rebinding of NO with the other isotope label before sample was completely frozen. To address whether such scenario is possible, we had to carefully assess the kinetic destiny of the potential transient quaternary complex intermediate (complex C in Scheme 1). In our previous publication (20), we determined the kon and koff of these chemical steps (k6/k−6 and k7 listed in Table 1):
6c Fe(II)NO + NO ↔ Fe(II)(NO)2 → 5pFe(II)NO (B ↔ C → D in Scheme 1).
Our rapid-scan data revealed a direct conversion of the 6c Fe(II)(NO) (with a 420 nm Soret peak) to either 5cFe(II)NO or 5pFe(II) NO (with a Soret peak at 399 nm) with no indication for any accumulation of the Fe(II)(NO)2 (Fig. 1). The only reported bis-NO complex with heme was described for the model heme Fe(II)(TmTP) (TmTP = meso-tetra-m-tolyl-porphinato dianion) in organic solvents (22). The Fe(II)(TmTP)(NO)2 complex exhibits a 416 nm Soret absorption peak, which is very different from that of 5c Fe(II)(TmTP)(NO) complex, 404 nm. This bis-NO was very transient and detected only at low temperature (22). These measurements for bis-NO heme model strongly indicate that the spectrum of the putative bis-NO sGC intermediate should be different from that of either the 5c or 6c NO-sGC. Thus, the observed single-stage optical conversion from 420 nm species to 399 nm species of NO interaction with sGC indicates that, if there is any formation of bis-NO sGC, it has to be very transient and very difficult to detect directly.
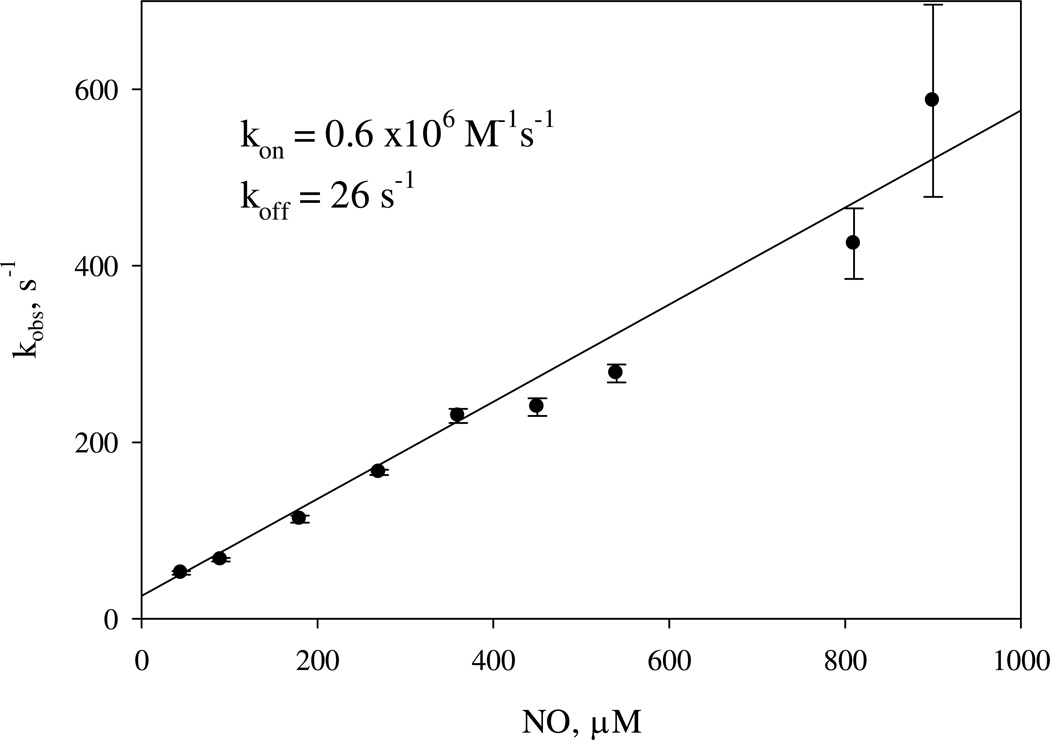
Two competing processes contribute to the depletion of the Fe(II)(NO)2 (k −6 and k7, Table 1). If k7 ≫ k−6, negligible isotope scrambling is expected. However, if this condition is not satisfied, we expect that isotope scrambling will occur due to the faster dissociation of NO from Fe(II)(NO)2 followed by the rebinding of NO with either isotope to 6c Fe(II)NO and the formation of the Fe(II)(NO)2 containing NO ligands with partly scrambled isotope label. Our studies showed that the observed rate of changes of 420 nm absorbance has a linear dependence on NO concentration reaching ca. 600 s−1 at 900 µM NO and yielding a kon (as the slope) of 0.6 × 10⁶ M−1 s−1 and a koff (as Y-intercept) of 26 s−1 (Fig. 4 and Fig. S1, Inset), consistent with our previous determination using concentrations of NO below 100 µM (20). In the present study, we pushed the measurements to the data acquisition limit of our stopped-flow instrument, with more than 50% of reaction lost in the instrument's dead time (Fig. S1). Nonetheless, a linear dependence on NO concentration was still maintained, without any sign of saturation. Thus, we can safely conclude that the conversion from Fe(II)(NO)2 to the 5pFe(II)NO is at least an order of magnitude faster than the back dissociation reaction (i.e., k7 ≫ k−6 in Table 1), with little chance to observe the accumulation of Fe(II)(NO)2 intermediate. Consequently there should be little concern about isotope scrambling during the 5–10 s freeze trapping phase of our kinetic measurements and the level of 5pFe(II)NO is expected to plateau very rapidly, as observed in Fig. 1C and predicted by computer modeling (see below, Fig. 5).
Figure 4.
[NO]-dependence of the observed rate for the second step NO binding to sGC. 2 µM sGC was mixed with 8 different levels of NO ranging from 90 to 1800 µM in the anaerobic stopped-flow and the kinetic data at A420nm were collected and rates determined by fitting to one-exponential, pseudo-first order function. Each datum is the average of 3–5 shots with the standard deviation shown as a vertical bar. A similar experiment conducted with a different sGC preparation is shown in the Supporting Information (Fig. S1). The average and standard deviation of kon and koff values determined from four different batches of sGC preparation are 1.0 ± 0.3 µM−1 s−1 and 27 ± 4 s−1, respectively.
To directly test if any scrambling of the NO ligand takes place in the 5c NO-sGC complex formed after the second mixing, we thawed the EPR samples from those shown in Fig. 2 anaerobically, and after 60 seconds incubation at 24 °C refroze the samples and recorded the EPR spectra again (Fig. S2). We found minimal changes of the EPR spectra of each sample following these thaw/freeze cycle, strongly indicating that the five-coordinate Fe(II)NO samples reached a plateau during the thaw/freeze treatment, just as predicted by computer simulations (Fig. 5B below), and no additional ligand scrambling occurred. These results confirm that k7 ≫ k−6, thus leading to a rapid plateau of the 5c NO-sGC species.
Concerted mechanism for 2nd NO binding to the heme and selective dissociation of distal NO from bis-NO complex
Our recent kinetic study for sGC interaction with stoichiometric NO revealed the following multiphasic transformation (20):
| 5cFe(II) (430 nm) ↔ 6cFe(II)NO (420 nm) | (k1 / k−1, 4.5 × 10⁸ M−1 s−1/ 27 s−1) |
| 6cFe(II)NO → 5cFe(II)NO (399 nm) (D*) | (k2 / k−2, 8.5 s−1/ 0.001 s−1) |
| 5cFe(II)NO → {6cxFe(II)NO} (E*) | (k3 / k−3, 0.06 s−1/ 0 s−1) |
| {6cxFe(II)NO} → 5cxFe(II) (430 nm) | (k4 / k−4, 2 s−1/ 0 s−1) |
| 5cxFe(II) → 5cxFe(II)NO (399 nm) | (k5/k−5, 0.006 s−1/ 0 s−1) |
A simplified mechanism A ↔ B →D* → E* is presented in Scheme 1, left, where 6cxFe(II)NO indicates a desensitized intermediate, which may contain an alternative proximal ligand such as His107. The value of k2, the intrinsic rate constant for dissociation of the proximal histidine ligand (His105), was measured to be ~10 s−1, and subsequent chemical steps are at least ten fold slower (20).
When the interaction of NO and sGC occurs in the presence of excess NO, the binding of the second NO to the heme iron can follow either a sequential mechanism, i.e., His105 first dissociates, then NO binds, or a concerted model, i.e., NO binding and His105 release occur simultaneously. If the sequential model is correct, then the rate of the second NO binding is limited by the intrinsic dissociation of His105, ~ 10 s−1. The experimental data presented in Figs. 4 and S1, however, indicates that the second NO binding rate is linearly dependent on [NO] up to > 600 s−1 with no indication of saturation. Thus, binding of the second NO molecule follows the concerted model and higher [NO] facilitates the release of the His105 ligand. This finding and the lack of direct optical data for a bis-NO sGC complex, led us to introduce a quaternary bis-NO transition complex (C in Scheme 1) to indicate the fast concerted NO binding, His-105 dissociation and the subsequent discharge of the first NO ligand.
Since the rate of NO release from Fe(II)(NO)2 is ≫ 600 s−1 and cannot be rate-limiting in the whole sequence of NO interaction with sGC, the discharge of one NO ligand from the Fe(II)(NO)2 has to be selective for the distal site to avoid another efficient mechanism of isotope scrambling. If the NO release were to happen randomly from both axial positions, the final 5cFe(II)NO complex would contain equal parts of 14NO and 15NO ligands, independent of the concentration of the applied second NO isotope. However, we observed a preferential enrichment of the final 5cFe(II)NO with the increased concentration of the NO isotope used in the 2nd mixing (Figs. 2 vs. 3). Thus, the final stable 5c NO-sGC complex (5pFe(II)NO) has the NO ligated to the proximal position, similar to that observed for cyt c' well supported by crystallographic, mutagenesis, resonance Raman spectroscopy and geminate rebinding kinetic studies (5, 6, 23, 24).
Mathematical modeling for NO binding interaction with sGC
After characterizing the details of the reaction of NO binding to sGC with either stoichiometric or excess NO, we performed mathematical modeling to assess the plausibility of our observed EPR data. The mechanistic model is proposed in Scheme 1 and the chemical steps involved are listed in Table 1. The rate constants applied in simulation are either extracted from the literature or determined previously by us (20, 25). The mechanism for sGC reaction with stoichiometric NO is simplified in Scheme 1 by removing the steps with k4/k−4 and k5/k−5 as rate constants. These two chemical steps described and characterized in our recent study were included in the initial simulation, but their removal did not noticeably alter the predictions of the kinetic behavior of 5c NO-sGC, which includes both 5cFe(II)NO and 5pFe(II)NO species with NO at the distal and proximal side of the heme, respectively. We first calculated the theoretical levels of 5cFe(II), 6cFe(II)NO, 5cFe(II)NO, 5pFe(II)NO at 20 ms after the first mixing sGC with 1:1 NO (Fig. 5A), and used these concentrations as starting values to simulate the reaction of the second-stage mixing (Fig. 5B). The concentrations of other two species: 6cxFe(II)NO (a desensitized state which may contain an alternative proximal histidine) and Fe(II)(NO)2 complex (E* and C, respectively, in Scheme 1) are essentially zero. Computer modeling indicates that at 20 ms reaction time, 3.4 of the 4.5 µM (i.e. 76%) total sGC is present as 6cFe(II)NO (420 nm peak), 0.59 µM is present as 5cFe(II)NO, 0.44 µM is present as 5cFe(II) and a small amount, 0.044 µM, is present as 5pFe(II)NO species (Fig. 5A, vertical dash line). It was not possible to generate a pure 6c NO-sGC due to the fast back dissociation to the resting ferrous species (27 s−1) and further conversion to 5c NO-sGC (10 s−1 for B → D* in Scheme 1). Setting k3 and/or k5 to zero does not noticeably change the predicted level for the 6cFe(II)NO at 20 ms, but setting k2 to zero increases 6cFe(II)NO level to 4.0 µM and lowers the level of five-coordinate Fe(II)NO for several seconds after the first mixing. In this case, the five-coordinate Fe(II)NO, exclusively 5pFe(II)NO, approached 3.8 µM and ~4.5 µM at 2 s with, respectively, 1× and 10× NO in the second mixing (data not shown). This result shows that the kinetics of conversion from B → D* (Scheme 1) plays a key role in determining the amount and identity of five-coordinate Fe(II)NO.
When the simulation was conducted based on reacting sGC with stoichiometric amount of NO at both stages of mixing, the predicted ratio of the levels for the two 5c NO-sGC containing either 15NO and 14NO at 5s and 10s after the second mixing varied from 1.48 to 1.13 (Table 2), which is comparable to the experimentally observed value of 1.2 and 1.3 (Figs. 2A and 2B), independent of the order of isotope addition in the two mixing stages. These predicted values have been corrected for small contributions from the interaction of the isotopic NO in the second mixing with the small percentage of remaining free 5cFe(II) sGC predicted from computer simulation for the first stage reaction at 20 ms. With more than stoichiometric NO present in the first mixing (Fig. 3A), the additional NO did not have much chance to attack the proximal side during 20 ms aging, while the amount of NO with opposite label used in the second mixing drove substantialy more displacement of the His105 ligand as predicted by our mechanistic model. This explains why we observed more conversion of the 3-line EPR (NO at the distal side of the heme) to the 2-line EPR (NO at the proximal side of the heme) when 15 µM 14NO and 7.5 µM 15NO were sequentially reacted with 9 µM sGC (Fig. 3A). The observed ratio, 0.75, between two 5c NO-sGC containing either 14NO or 15NO is close to the range predicted by simulation: 1.02 to 0.76 at 5s to 10s after second mixing (Table 2).
Table 2.
Observed and predicted levels for 5c NO-sGC species containing the isotopic NO used in the first or second stage reaction in the stopped-flowa.
| [NO] (1st mixing), µM | [NO] (2nd mixing), µM | [5cFe(II)NO] : ([5pFe(II)NO]+[5pFe(II)NO*]]+[5cFe(II)NO*])b | |
|---|---|---|---|
| Observed (EPR) | Predicted (5s – 10 s) by simulation | ||
| 10.0 | 5.0 | 1.2 | 1.48 – 1.13 |
| 10.0 | 5.0 | 1.3 | 1.48 – 1.13 |
| 15.0 | 7.5 | 0.75 | 1.02 – 0.76 |
| 10.0 | 50 | 0.18 | 0.24 – 0.16 |
sGC concentration was 4.5 µM for each reaction.
5cFe(II)NO* and 5pcFe(II)NO* are the 5c NO complexes derived from residual 5cFe(II) after 20 ms delay. Ratio values are adjusted for binding of NO* to the 5cFe(II) to form 5cFe(II)NO* and 5pFe(II)NO* in the 2nd stage reaction.
On the other hand, when sGC was first mixed with a stoichiometric amount of 14NO followed by a 10-fold excess of 15NO, we observed a ratio of 0.18 for the two 5c NO-sGC containing 14NO and 15NO (Fig. 3B), respectively, making the 5pFe(II)NO the dominant species of the five-coordinate NO-sGC. Our computer simulation predicted that this ratio varies from 0.24 to 0.16 at 5s to 10s after the second mixing. Thus, the experimentally observed ratio for the two forms of five-coordinate NO-sGC are near the values predicted by simulations for the longer times, implying that the time to freeze trap the sample may be longer than we had anticipated and that it might take ~ 8–10 s to completely freeze the reaction in all four experiments (Table 2). It should be noted that the ratio of these two types of five-coordinate NO-sGC is very sensitive to the rates of the reactions that branch out from 6cFe(II)NO, i.e. k2/k−2 vs. k6/k−6; thus batch to batch variations in the sGC preparation showing some differences in the relative rates of these two steps might also cause a noticeable shift of the observed ratio.
In summary, using a sequential application of isotope-labeled NO at stoichiometric or excess amounts and freeze/quench EPR, we demonstrated for the first time that, provided with sufficient amounts of NO, the rapid interaction of NO with sGC includes the binding of the second NO molecule to the heme iron and not to other targets such as cysteine thiol. Our present data predict that the rate of conversion from Fe(II)(NO)2 to five-coordinate NO-sGC, i.e., 5pFe(II)NO, is > 600 s−1 and overrides the back dissociation of NO, occurring at a respectable rate of 25 s−1. The second NO ligates to the heme iron in concert with the dissociation of His105. Only the mechanism that considers the dissociation of NO from the distal and not the proximal position in the transient bis-NO complex Fe(II)(NO)2 is compatible with all previously published kinetic data on NO interaction with sGC. Our studies provide strong evidence for the heme proximal site as the site of binding of the second NO. Finally, the two chemical steps that branch out from 6cFe(II)NO constitute a sensitive control of the ratio of the two types of 5c NO-sGC. We confirmed that both types of 5c NO-sGC show prominent activity of cGMP formation and are important intermediates for sGC catalytic turnover (20). Excess NO favors the formation of 5pFe(II)NO, a 5c NO-sGC species with NO ligated at the proximal site, which should be the key intermediate that contributes to the cGMP formation during the steady-state catalysis of sGC when NO is in excess.
Supplementary Material
Acknowledgement
We thank Professor Graham Palmer for his careful reviewing of the manuscript and John S. Olson for his fruitful discussions.
This work was supported by grants from NIH HL088128(E. M.), HL095820 (A.-L.T).
Abbreviations
- GTP
guanosine triphosphate
- cGMP
3’,5’ cyclic guanosine monophaosphate
- sGC
soluble guanylyl cyclase
- TEA
triethanolamine
- 5C
five coordinate
- 6C
six coordinate
- NO
nitric oxide
- 15NO
NO containing 15N nitrogen isotope
- 14NO
NO containing 14N nitrogen isotope
- EPR
electron paramagnetic resonance spectrometry
- RFQ
rapid freeze quench
- Fe(II)
ferrous form
- 5cFe(II)
five coordinate ferrous sGC
- 6cFe(II)NO
6c NO-sGC
- 5cFe(II)NO
5c NO-sGC with NO at the heme distal site
- Fe(II)(NO)2
transient quaternary complex containing bis-NO heme
- 5pFe(II)NO
5c NO-sGC with NO at the heme proximal site
- 6cxFe(II)NO
6c NO-sGC in desensitized state, possibly containing His107 as an alternative proximal ligand
- 5cxFe(II)
desensitized 5c ferrous sGC possibly containing His107 as an alternative proximal ligand
Footnotes
Supporting Information Available
There are two figures (Figs. S1 – S2) in the Supporting Information. Fig. S1 is another experiment on NO binding kinetics (main panel) and the linear [NO] dependence (inset). Fig. S2 are the EPR obtained from samples shown in Fig. 2A and 2B ((a) and (c)) after anaerobic thawing at 24 °C for 1 min and refreezing. This material is available free of charge via the Internet at http://pubs.acs.org.
References
- 1.Zhao Y, Schelvis JP, Babcock GT, Marletta MA. Identification of histidine 105 in the beta1 subunit of soluble guanylate cyclase as the heme proximal ligand. Biochemistry. 1998;37:4502–4509. doi: 10.1021/bi972686m. [DOI] [PubMed] [Google Scholar]
- 2.Poulos TL. Soluble guanylate cyclase. Curr Opin Struct Biol. 2006;16:736–743. doi: 10.1016/j.sbi.2006.09.006. [DOI] [PubMed] [Google Scholar]
- 3.Derbyshire ER, Marletta MA. Biochemistry of soluble guanylate cyclase. Handb Exp Pharmacol. 2009:17–31. doi: 10.1007/978-3-540-68964-5_2. [DOI] [PubMed] [Google Scholar]
- 4.Zhao Y, Brandish PE, Ballou DP, Marletta MA. A molecular basis for nitric oxide sensing by soluble guanylate cyclase. Proc Natl Acad Sci U S A. 1999;96:14753–14758. doi: 10.1073/pnas.96.26.14753. [DOI] [PMC free article] [PubMed] [Google Scholar]
- 5.Lawson DM, Stevenson CE, Andrew CR, Eady RR. Unprecedented proximal binding of nitric oxide to heme: implications for guanylate cyclase. Embo J. 2000;19:5661–5671. doi: 10.1093/emboj/19.21.5661. [DOI] [PMC free article] [PubMed] [Google Scholar]
- 6.Hough MA, Antonyuk SV, Barbieri S, Rustage N, McKay AL, Servid AE, Eady RR, Andrew CR, Hasnain SS. Distal-to-proximal NO conversion in hemoproteins: the role of the proximal pocket. J Mol Biol. 2011;405:395–409. doi: 10.1016/j.jmb.2010.10.035. [DOI] [PubMed] [Google Scholar]
- 7.Russwurm M, Koesling D. NO activation of guanylyl cyclase. Embo J. 2004;23:4443–4450. doi: 10.1038/sj.emboj.7600422. [DOI] [PMC free article] [PubMed] [Google Scholar]
- 8.Sayed N, Baskaran P, Ma X, van den Akker F, Beuve A. Desensitization of soluble guanylyl cyclase, the NO receptor, by S-nitrosylation. Proc Natl Acad Sci U S A. 2007;104:12312–12317. doi: 10.1073/pnas.0703944104. [DOI] [PMC free article] [PubMed] [Google Scholar]
- 9.Russwurm M, Koesling D. Guanylyl cyclase: NO hits its target. Biochem Soc Symp. 2004:51–63. doi: 10.1042/bss0710051. [DOI] [PubMed] [Google Scholar]
- 10.Cary SP, Winger JA, Derbyshire ER, Marletta MA. Nitric oxide signaling: no longer simply on or off. Trends Biochem Sci. 2006;31:231–239. doi: 10.1016/j.tibs.2006.02.003. [DOI] [PubMed] [Google Scholar]
- 11.Fernhoff NB, Derbyshire ER, Marletta MA. A nitric oxide/cysteine interaction mediates the activation of soluble guanylate cyclase. Proc Natl Acad Sci U S A. 2009;106:21602–21607. doi: 10.1073/pnas.0911083106. [DOI] [PMC free article] [PubMed] [Google Scholar]
- 12.Kharitonov VG, Sundquist AR, Sharma VS. Kinetics of nitrosation of thiols by nitric oxide in the presence of oxygen. J Biol Chem. 1995;270:28158–28164. doi: 10.1074/jbc.270.47.28158. [DOI] [PubMed] [Google Scholar]
- 13.Martin E, Berka V, Tsai AL, Murad F. Soluble guanylyl cyclase: the nitric oxide receptor. Methods Enzymol. 2005;396:478–492. doi: 10.1016/S0076-6879(05)96040-0. [DOI] [PubMed] [Google Scholar]
- 14.Feelisch M, Noack EA. Correlation between nitric oxide formation during degradation of organic nitrates and activation of guanylate cyclase. Eur J Pharmacol. 1987;139:19–30. doi: 10.1016/0014-2999(87)90493-6. [DOI] [PubMed] [Google Scholar]
- 15.Wu G, Lu JM, van der Donk WA, Kulmacz RJ, Tsai AL. Cyclooxygenase reaction mechanism of prostaglandin H synthase from deuterium kinetic isotope effects. J Inorg Biochem. 2011;105:382–390. doi: 10.1016/j.jinorgbio.2010.11.015. [DOI] [PMC free article] [PubMed] [Google Scholar]
- 16.Tsai A-L, Berka V, Kulmacz RJ, Wu G, Palmer G. An improved sample packing device for rapid freeze-trap electron paramagnetic resonance spectroscopy kinetic measurements. Anal Biochem. 1998;264:165–171. doi: 10.1006/abio.1998.2774. [DOI] [PubMed] [Google Scholar]
- 17.Tsai AL, Berka V, Martin FE, Ma X, van den Akker F, Fabian M, Olson JS. Is Nostoc H-NOX an NO sensor or Redox Switch? Biochemistry. 2010;49:6587–6599. doi: 10.1021/bi1002234. [DOI] [PMC free article] [PubMed] [Google Scholar]
- 18.Wei C, Kulmacz RJ, Tsai A-L. Comparison of branched-chain and tightly coupled reaction mechanisms for prostaglandin H synthase. Biochemistry. 1995;34:8499–8512. doi: 10.1021/bi00026a034. [DOI] [PubMed] [Google Scholar]
- 19.Tsai AL, Berka V, Martin E, Olson JS. A "Sliding-Scale Rule" for Selectivity between NO, CO and O2 by Heme Protein Sensors. Biochemistry. 2012;51:172–186. doi: 10.1021/bi2015629. [DOI] [PMC free article] [PubMed] [Google Scholar]
- 20.Tsai AL, Berka V, Sharina I, Martin E. Dynamic ligand exchange in soluble guanylyl cyclase: implications for sGC regulation and desensitization. J Biol Chem. 2011;286:43182–43192. doi: 10.1074/jbc.M111.290304. [DOI] [PMC free article] [PubMed] [Google Scholar]
- 21.Makino R, Matsuda H, Obayashi E, Shiro Y, Iizuka T, Hori H. EPR characterization of axial bond in metal center of native and cobalt-substituted guanylate cyclase. J Biol Chem. 1999;274:7714–7723. doi: 10.1074/jbc.274.12.7714. [DOI] [PubMed] [Google Scholar]
- 22.Lorkovic IM, Ford PC. Nitric Oxide Addition to the Ferous Nitrosyl Porphyrins Fe(P)(NO) Gives trans-Fe(P)(NO)2 in Low-Temperature Solutions. J. Am. Chem. Soc. 2000;122:6516–6517. [Google Scholar]
- 23.Andrew CR, Green EL, Lawson DM, Eady RR. Resonance Raman studies of cytochrome c' support the binding of NO and CO to opposite sides of the heme: implications for ligand discrimination in heme-based sensors. Biochemistry. 2001;40:4115–4122. doi: 10.1021/bi0023652. [DOI] [PubMed] [Google Scholar]
- 24.Kruglik SG, Lambry JC, Cianetti S, Martin JL, Eady RR, Andrew CR, Negrerie M. Molecular basis for nitric oxide dynamics and affinity with Alcaligenes xylosoxidans cytochrome c. J Biol Chem. 2007;282:5053–5062. doi: 10.1074/jbc.M604327200. [DOI] [PubMed] [Google Scholar]
- 25.Kharitonov VG, Sharma VS, Magde D, Koesling D. Kinetics of nitric oxide dissociation from five- and six-coordinate nitrosyl hemes and heme proteins, including soluble guanylate cyclase. Biochemistry. 1997;36:6814–6818. doi: 10.1021/bi970201o. [DOI] [PubMed] [Google Scholar]
- 26.Martin E, Berka V, Bogatenkova E, Murad F, Tsai AL. Ligand selectivity of soluble guanylyl cyclase: Effect of the hydrogen bonding tyrosine in the distal heme pocket on binding of oxygen, nitric oxide and carbon monoxide. J Biol Chem. 2006 doi: 10.1074/jbc.M601078200. [DOI] [PubMed] [Google Scholar]
- 27.Brandish PE, Buechler W, Marletta MA. Regeneration of the ferrous heme of soluble guanylate cyclase from the nitric oxide complex: acceleration by thiols and oxyhemoglobin. Biochemistry. 1998;37:16898–16907. doi: 10.1021/bi9814989. [DOI] [PubMed] [Google Scholar]
- 28.Kharitonov VG, Russwurm M, Magde D, Sharma VS, Koesling D. Dissociation of nitric oxide from soluble guanylate cyclase. Biochem Biophys Res Commun. 1997;239:284–286. doi: 10.1006/bbrc.1997.7470. [DOI] [PubMed] [Google Scholar]
Associated Data
This section collects any data citations, data availability statements, or supplementary materials included in this article.


