Abstract
This study shows that electrocorticographic (ECoG) signals recorded from the surface of the brain provide detailed information about shifting of visual attention and its directional orientation in humans. ECoG allows for the identification of the cortical areas and time periods that hold the most information about covert attentional shifts. Our results suggest a transient distributed fronto-parietal mechanism for orienting of attention that is represented by different physiological processes. This neural mechanism encodes not only whether or not a subject shifts their attention to a location, but also the locus of attention. This work contributes to our understanding of the electrophysiological representation of attention in humans. It may also eventually lead to brain-computer interfaces (BCIs) that optimize user interaction with their surroundings or that allow people to communicate choices simply by shifting attention to them.
Keywords: visual spatial attention, covert attention, electrocorticography (ECoG)
1. Introduction
Voluntary shifts of attention towards a spatial location enhances the accuracy and speed of our detection of and response to a visual stimulus at that location (Posner et al., 1980). Attending to a spatial location does not depend on gaze — attention can be shifted peripherally while the eyes maintain fixation (LaBerge, 1995), which is a capability called covert attention. Many studies have investigated the cortical mechanisms of covert attention, including a body of work that has used single-unit recordings in non-human primates (Moran and Desimone, 1985; Motter, 1993; Colby et al., 1996; Luck et al., 1997; Gottlieb et al., 1998; Goldberg et al., 2002; Bisley and Goldberg, 2003; Ghose and Maunsell, 2008; Lee and Maunsell, 2010; Awh et al., 2006; Buschman and Miller, 2007; Gregoriou et al., 2009). Unfortunately, single-unit recordings can practically only be made from a relatively small number of distinct brain regions, which precludes the simultaneous observation of distributed cortical areas. On the other hand, studies using functional magnetic resonance imaging (fMRI) have focused on the delineation of widespread attentional networks in humans. The results suggest a dorsal attention network that is distributed across prefrontal, posterior parietal and visual cortices (Corbetta et al., 1998; Kastner et al., 1999; Hopfinger et al., 2000; Corbetta and Shulman, 2002; Yantis et al., 2002; Fox et al., 2006; Strotzer, 2009; Mantini et al., 2010; Szczepanski et al., 2010). However, fMRI cannot readily distinguish between different physiological processes, such as local cortical processing vs. inter-regional interactions (Hermes et al., 2011), and cannot readily track rapid brain signal changes, such as the temporal dynamics of shifting of attention.
Electrocorticographic (ECoG) recordings from the surface of the brain have recently begun to attract substantial attention, in part because they allow for simultaneous detection of different physiological processes (Crone, Miglioretti, Gordon, Sieracki, Wilson, Uematsu and Lesser, 1998; Crone, Miglioretti, Gordon and Lesser, 1998; Miller et al., 2007; Leuthardt et al., 2007), but also because they can track rapid brain signal changes with good spatial resolution and coverage. These characteristics have encouraged an increasing number of studies that used ECoG for studying task-related spectral modulations across various bands within and beyond the range of classical scalp-recorded electroencephalography (EEG) (i.e., >70 Hz), as well as for studying the temporal evolution of cortical processes related to important motor, language, or cognitive functions (Schalk et al., 2007; Miller et al., 2007; Kubanek et al., 2009; Jacobs and Kahana, 2009; Canolty and Knight, 2010; Pei et al., 2010).
In this study, we investigate the ECoG correlates of shifting of attention in a modified Posner cueing task (Posner, 1980) in five subjects with broad ECoG coverage. Our results show for the first time that visual spatial attention is related to a widely distributed network of different physiological processes that transiently and differentially engage during the shifting of attentive states. The ECoG correlates of these processes were highly informative about the attentive states and the locus of attention in single trials. Thus, the results presented in this paper add to the current understanding of the neural substrates of visual spatial attention. They may also provide the basis for the design of a new generation of brain-computer interface systems that can allow people who are completely paralyzed to select items without shifting gaze.
2. Materials and Methods
2.1. Human subjects and data collection
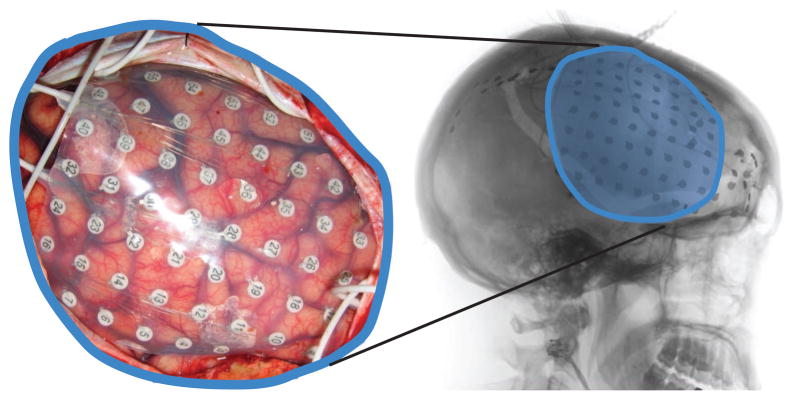
The five subjects who participated in this study were patients with intractable epilepsy at Albany Medical Center (Subjects A,B,D,E) and Washington University in St. Louis (Subject C). Subjects underwent temporary placement of subdural electrode arrays to localize seizure foci prior to surgical resection of epileptic tissue (see Figure 1). All gave informed consent to participate in the study, which was approved by the Institutional Review Boards of both hospitals. The subjects had performance IQs of at least 85 and were mentally, visually and physically capable of performing the task. Table 1 summarizes the subjects’ clinical profiles.
Figure 1.
Example of implanted electrode grid (in subject C). Left: Subdural grid placed over right frontal cortex. Right: Post-operative lateral x-ray revealing the position of the grid.
Table 1.
Clinical profiles of participants
| Subject | Age | Sex | Handedness | Performance IQ | Seizure Focus | Grid locations (number of contacts) |
|---|---|---|---|---|---|---|
| A | 29 | F | R | 136 | Left temporal | Left fronto-parietal (64) |
| Left temporal (23) | ||||||
| Left temporal pole (4) | ||||||
| Left occipital (6) | ||||||
| B | 30 | M | R | 90 | Left temporal | Left frontal (48) |
| Left temporal (35) | ||||||
| Left temporal pole (4) | ||||||
| Left occipital (4) | ||||||
| C | 28 | F | R | 109 | Right frontal | Right frontal (64) |
| D | 26 | F | R | 117 | Left temporal | Left frontal (64) |
| Left temporal (35) | ||||||
| Left temporal pole (4) | ||||||
| Left occipital (6) | ||||||
| E | 56 | M | R | 87 | Left temporal | Left frontal (56) |
| Left temporal (35) | ||||||
| Left occipital (6) |
The implanted electrode grids (Ad-Tech Medical Corp., Racine, WI) consisted of platinum-iridium electrodes (4 mm in diameter, 2.3 mm exposed) that were embedded in silicon and spaced at an inter-electrode distance of 1 cm. Subjects A, B, D, E had grids implanted over their left hemisphere, whereas Subject C’s grid was placed on the right hemisphere. The total number of electrodes we recorded from in each subject was 96, 83, 64, 109, and 97 for Subjects A–E, respectively. Grid placement and duration of ECoG monitoring were based solely on the requirements of the clinical evaluation without any consideration of this study.
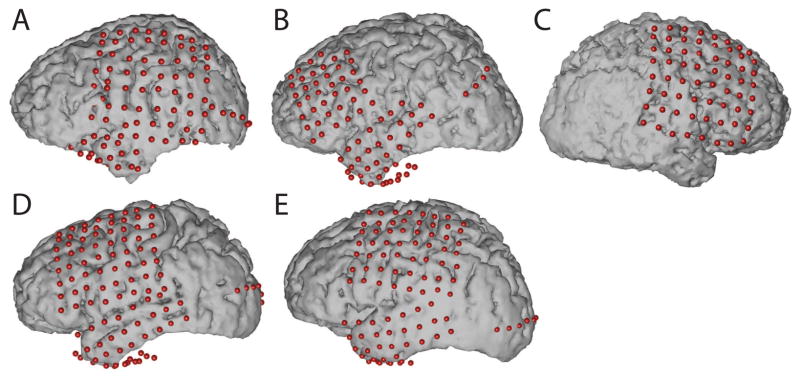
Each subject had postoperative anterior-posterior and lateral radiographs (Figure 1), as well as computer tomography (CT) scans to verify grid locations. Three-dimensional cortical models of individual subjects were generated using pre-operative structural magnetic resonance (MR) imaging. These MR images were co-registered with the post-operative CT images using Curry software (Compumedics, Charlotte, NC) to identify electrode locations (see Figure 2). Electrode locations were assigned to Brodmann areas using the Talairach Daemon (http://www.talairach.org, Lancaster et al. (2000)). Cortical activation maps were generated using custom Matlab software. Activation maps computed across subjects were projected on the three-dimensional cortical template provided by the Montreal Neurological Institute (MNI) (http://www.bic.mni.mcgill.ca). For visualization purposes, the grid implants of Subject C (whose electrodes were implanted on the right hemisphere) were projected to the left hemisphere.
Figure 2.
Locations of implanted grids on individual subject cortical models resulting from co-registration of pre-op MRI and post-op CT images.
ECoG signals were recorded at the bedside using eight 16-channel g.USBamp biosignal acquisition devices (g.tec, Graz, Austria) at a sampling rate of 1200 Hz. Electrode contacts distant from epileptic foci and areas of interest were used for reference and ground. Recordings were visually inspected offline for environmental artifacts and interictal activity. Channels that did not clearly contain ECoG signals were removed from the analysis. To help reduce the possibility that the decoding results could be explained by a visual response, we removed locations over the occipital cortex from the analyses. Overall, these procedures reduced the total number of channels that were submitted for further analyses to 86, 78, 64, 103, and 88 for Subjects A–E, respectively.
In addition to recording brain activity, the subjects’ eye gaze was recorded using a monitor with a built-in eye tracking system (Tobii Tech., Stockholm, Sweden), along with the activity from a push button. The eye tracker was calibrated to each subject at the beginning of the experimental session using custom software. Data collection from the biosignal acquisition devices, stimulus presentation, and behavioral variables (i.e., eye tracker, push button), as well as control of the experimental paradigm were accomplished simultaneously using BCI2000 software (Schalk et al., 2004; Mellinger and Schalk, 2007; Schalk, 2010).
2.2. Experimental paradigm
The experimental design in this study was based on the seminal Posner cueing task which has time and time again demonstrated improved behavioral performance with attentional engagement (Posner, 1980; Posner and Petersen, 1990). This task selectively requires endogenous orienting of attention. The presentation of a spatial cue indicated the visual field towards which subjects should shift attention. Randomly oriented cosine gratings were used as target and distractor stimuli because they provide a carefully controlled framework for manipulating stimulus properties by altering the contrast. Distractor stimuli were incorporated in the experiment as they have been shown to increase the neuronal response towards the target stimulus (Luck et al., 1997; Ghose and Maunsell, 2008; Lee and Maunsell, 2010). Compared to the original design of the Posner task, the total number of stimuli were increased from two to three (i.e., one target and two distractors) to induce attentional shifts across two dimensions (i.e., vertical and horizontal).
The specific experimental stages are summarized in Figure 3. There were three types of trials; valid trials and two different control trials as described below. Throughout the session, subjects maintained visual fixation on a cross that was presented at the center of the screen. Fixation was verified online through the eye tracker and further through offline inspection of the eye tracker recordings. During online experimentation, a trial aborted if the subjects directed gaze away from the fixation cross beyond a predefined radius (20% of the screen height, ~ 5° visual angle) for more than 500 ms. A trial started with the presentation of a cue arrow that pointed away from the center to one of three possible directions (up, down left, or down right). The subjects’ task was to covertly shift their attention to the cued portion of the screen. Two seconds later, three cosine gratings (i.e., the visual stimuli) appeared at an equal vertical distance from the fixation cross. On “valid” cue trials, the grating in the cued portion of the screen changed contrast after a random short interval (uniformly distributed between 1.5–2.5 sec). Once the subject detected this contrast change, he/she responded by pressing the push button with the hand contralateral to the implant (regardless of their handedness and irrespective of the attentional locus), which ended the trial. To control for differences in subject performance, the level of contrast change for each subject was adaptively estimated using a parameter estimation through sequential testing (PEST) procedure (Taylor and Creelman, 1967; Hammett and Snowden, 1995) that was run at the beginning of the session. The PEST procedure selected the amount of contrast change (identical across all stimuli) such that the performance in detecting the contrast change was approximately 75%.
Figure 3.
Five stages of the attention task. Rest period: Subjects fixate on the cross; Cue period: Directional cue arrow appears instructing subjects where to orient their attention; Stimulus period: All three stimuli appear; Contrast change: Cued stimulus changes contrast; Button press: Subjects acknowledge the contrast change by pressing the button.
As the focus of this study was covert attention, it was important to control for and verify the subjects’ engagement. To ensure that subjects were attending to the stimulus change before responding, control trials in which the cued stimulus did not change (i.e., a “no change” trial) were interleaved within the experiments. The subjects were instructed not to respond in such trials. False detection (i.e., responding during a no change trial) decreased performance accuracy. “Neutral” cue trials were also incorporated into the experiment. In these trials, three arrows appeared on the screen, each of which pointed towards one of the grating stimuli. This discouraged subjects from attending to any particular location on the screen. In neutral cue trials, the subjects still had to respond by pressing the button if one of the stimuli changed contrast. Consistent with the literature (Posner et al., 1980; LaBerge, 1995), the subjects responded faster during valid cue trials than during neutral cue trials (905 ms versus 1005 ms; p < 0.05, F-test).
Each session consisted of one PEST run with 25 trials to estimate the subject-specific level of contrast change. This PEST run was followed by 10 runs of 30 trials each. 20% of the trials were no change trials and 20% were neutral cue trials. The remainder of trials were valid cue trials. Subjects A, C, D, and E participated in one experimental session. Subject B participated in two sessions on two different days (i.e., 20 runs of 30 trials). The percentage of trials aborted due to eye movements was less than 30% across subjects (Subject A: 6.2%, Subject B: 28.9%, Subject C: 11.8%, Subject D: 27.6%, Subject E: 23.1%).
2.3. Feature extraction
Our data analyses began with high-pass filtering of all raw ECoG signals above 0.01 Hz and re-referencing signals from each electrode to a common average reference (CAR) (Schalk et al., 2007). For each channel and each 300 ms time period (stepping by 100 ms), the power spectral density was computed using a maximum entropy autoregressive model (Burg, 1972) of order 25 between 1–200 Hz in 1 Hz bins.
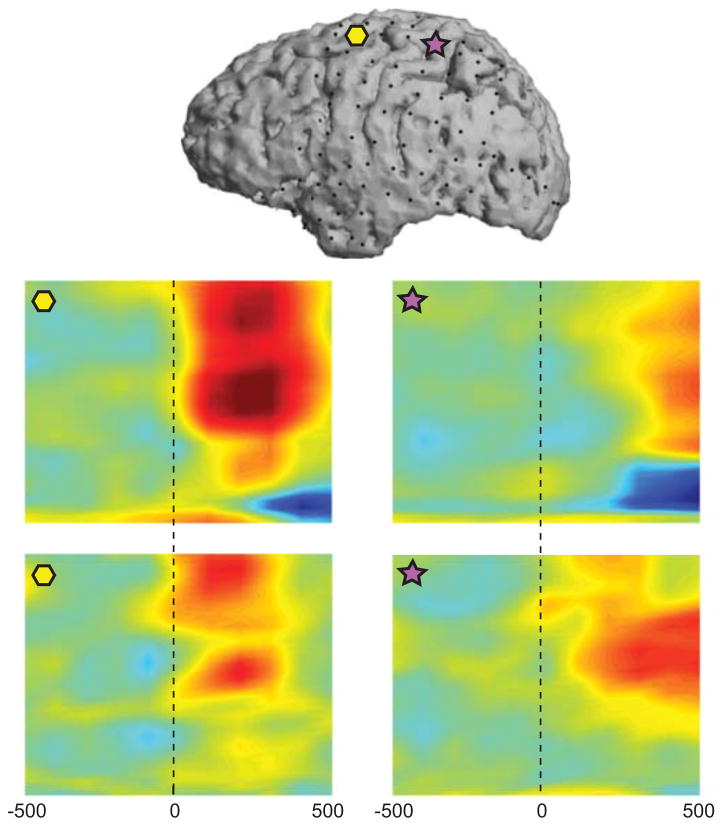
To study the ECoG correlates of shifts in attentive states, the inter-trial intervals were labeled as “baseline,” and the periods from the cue onset to the contrast change were labeled as “attention.” The relationship between the brain signals and the attentional labels is shown in Figure 4 for Subject A in two exemplary channels over the premotor (yellow hexagon) and parietal (purple star) cortices. Figures 4B–C depict the correlation between power in the 1 Hz spectral bins and the respective attentional states (“baseline” or “attention”) as a function of time, suggesting positive correlations with attentional engagement in the high gamma band and negative correlations in the low frequency bands.
Figure 4.
Each attention period was also labeled with respect to the attended location (i.e., left: [−1,0], right: [1,0], or up: [0,1]). Figures 4D–E show the temporal correlations between the attentional loci and the spectral features, once again demonstrating the presence of information within these ECoG features that can facilitate decoding of attentional locus.
2.4. Decoding of attentive states and attended locus
Next, we were interested in decoding shifts in attentive states and the attended locus from ECoG features. To this end, the spectral amplitudes in alpha, beta, and high gamma ranges (i.e., 8–12 Hz, 18–26 Hz, and 70–170 Hz, respectively) were computed for the baseline and attention periods. The first 1 sec of these spectral features (i.e., 1 sec from the “cue onset” for the attention period) in each channel were used to build a stepwise linear regression model (Jennrich, 1977), followed by a Bayesian classifier (Duda et al., 2001).
Stepwise regression and Bayesian classification models were also built to further infer the attended location from the first 1 sec of ECoG features after cue onset. The stepwise regression in this case predicted the horizontal and vertical loci of attention (i.e., −1, 0, or 1; and 0 or 1, respectively) and the classifier mapped these results to one of the three stimuli (i.e., left, right, or up). As described in the Methods, data from the occipital strips were removed to minimize a potential direct impact of visual stimulation.
2.5. Decoding of motor response
Finally, we inquired whether the attentional locus could be decoded during the motor response. As the experiment was designed such that the button press was indifferent to the attentional locus (i.e., the subjects pressed the same push-button for all trials), brain signals at this stage of the task should not contain directional information. Spectral ECoG features 500 msec before and after the “button press” were therefore used as a control for the directional classifier. Similar models were reproduced to predict the locus of attention during this period. Finally, we also decoded whether the subject was pushing the button or was at rest.
3. Results
3.1. Decoding of attentive states and attended locus
The main quantitative results of this study are presented in Table 2. This table gives the classification accuracies for each subject, averaged across 10 cross-validation folds. The mean classification accuracies across subjects were 84.5 ± 6.5% for detecting attentional engagement (50% chance) 1 sec after the cue onset, 92.5 ± 5.3% for detecting hand movement (50% chance) 1 sec around the button press.
Table 2.
Classification accuracies for individual subjects
| Subject | Attentional Engagement (%) | Motor Engagement (%) | Attentional Locus (%) | Attentional Locus during motor engagement (%) |
|---|---|---|---|---|
| A | 88.4 ± 5.2 | 98.8 ± 1.5 | 58.5 ± 13.8 | 35.4 ± 12.1 |
| B | 83.3 ± 11.2 | 86.2 ± 6.0 | 49.2 ± 7.0 | 37.0 ± 11.6 |
| C | 83.6 ± 9.0 | 96.5 ± 2.7 | 46.9 ± 16.5 | 31.5 ± 7.3 |
| D | 84.7 ± 4.9 | 88.7 ± 4.9 | 51.5 ± 8.5 | 38.9 ± 13.7 |
| E | 82.6 ± 6.6 | 92.5 ± 3.1 | 46.1 ± 13.9 | 33.3 ± 20.3 |
|
| ||||
| Average | 84.5 ± 6.5 | 92.5 ± 5.3 | 48.0 ± 11.3 | 35.2 ± 12.3 |
|
| ||||
| Chance | 50.0 | 50.0 | 33.3 | 33.3 |
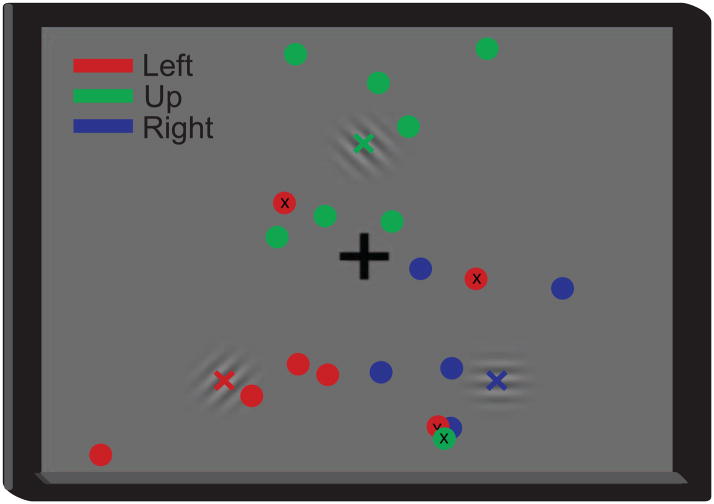
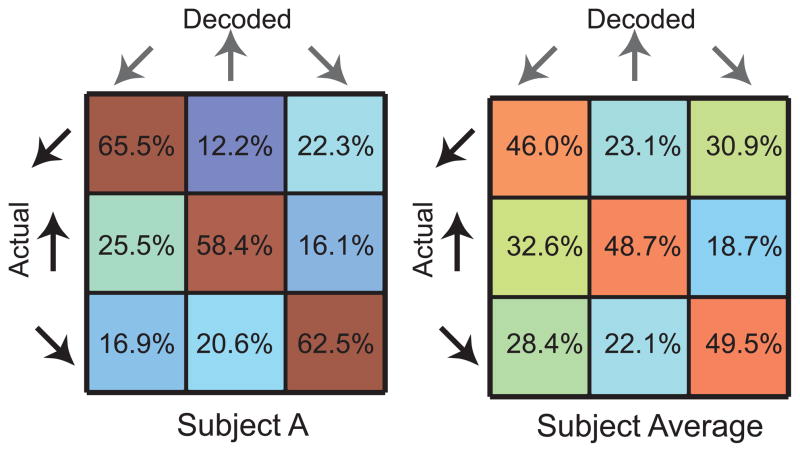
The attentional locus was decoded 1 sec after the cue onset and around the button press to determine the differences in performance accuracies during these two time periods. These analyses yielded mean classification accuracies of 48.0 ± 11.3% and 35.2 ± 12.3% across all subjects, respectively (33% chance). In other words, the attentional locus could be inferred after the cue onset (t-test, p < 0.05), but not during the button press, because the same button was pressed regardless of the cue, and presumably because the subjects did not pay attention to the target locus during the button press. Figure 5 shows the scatter plots of the decoded attentional loci on the subject screen for Subject A, and Figure 6 gives the confusion matrices for Subject A and the subject average.
Figure 5.
Exemplary linear regression and classifier outputs for decoding of attentional locus. The position of the circles denote the regression output and their color indicate the direction of the cue (i.e., left, right, up; see legend). The classifier was trained on 270 trials and tested on 30 trials (shown) collected from Subject A. The mislabeled loci are marked with an “x”.
Figure 6.
Confusion matrices for classification of attentional locus in Subject A (left) and averaged across subjects (right), where warm and cold colors represent high and low percentages, respectively.
To determine the information that was captured in the different frequency bands about the attentional engagement, the same analyses were performed separately for the alpha, beta and high gamma bands. The results of these analyses are given in Table 3. Classification accuracies for gamma features are higher than those for alpha and beta features (t-test, p < 0.05), but not higher than those for the combination of all features (t-test, p < 0.05). In summary, these results demonstrate that it is possible to infer attentional engagement and its orientation in single trials using ECoG signals in humans.
Table 3.
Classification accuracies for individual spectral bands averaged across subjects
| Spectral band | Attentional Engagement (%) | Motor Engagement (%) | Attentional Locus (%) |
|---|---|---|---|
| Alpha | 77.7 ± 7.3 | 84.7 ± 5.1 | 36.5 ± 13.0 |
| Beta | 77.0 ± 6.7 | 75.0 ± 9.0 | 36.8 ± 13.0 |
| High gamma | 80.3 ± 5.8 | 91.0 ± 3.2 | 39.8 ± 12.5 |
|
| |||
| All bands | 84.5 ± 6.5 | 92.5 ± 5.3 | 48.0 ± 11.3 |
|
| |||
| Chance | 50.0 | 50.0 | 33.3 |
3.2. Cortical locations involved in visual spatial attention
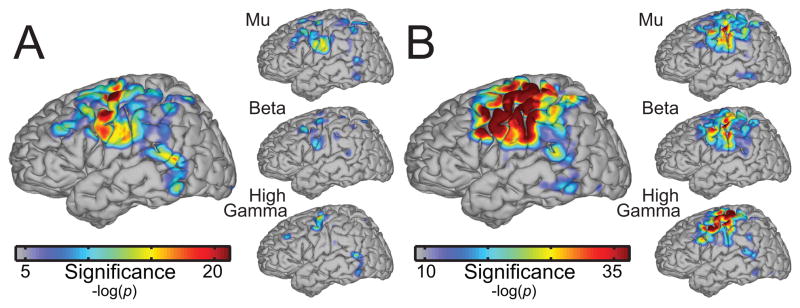
Subsequently, we were interested in determining the cortical locations that were involved in visual spatial attention and the motor response. To this end, the correlations and corresponding p-values between the tasks and model outputs were computed separately for each location. For each location, a significance index was defined as the −log(p) value, where log denotes the natural logarithm. These significance indices were then accumulated for all subjects and projected onto the template MNI brain (see Figures 7A–B leftmost topographies). Figure 7A shows the color-coded results for one second of attentional engagement after cue onset, whereas Figure 7B shows the results for one second around the button press. These activations reflect the significance of the underlying area from which the features were extracted. Figure 7A suggests a widely spread network for attentional processing. Figure 7B shows local activations mainly in the premotor, primary motor/sensory, and parietal areas.
Figure 7.
(A) Left: Significance of cortical areas for decoding attentional engagement (after cue onset) averaged across subjects. Right: Significance of cortical areas broken down in spectral bands. (B) Significance of cortical areas for decoding button press.
These maps were also generated separately for the alpha, beta, and gamma bands (inset Figures 7A–B). Figure 7A reveals mostly non-overlapping and distributed areas across alpha, beta, and high gamma ranges for attentional processing, suggesting different functional roles for these bands. On the other hand, Figure 7B reveals overlapping activations over hand motor cortex with higher and more localized contributions from the high gamma band, which confirms the observations of a number of previous ECoG-based motor mapping studies (e.g., Miller et al. (2007); Leuthardt et al. (2007)).
3.3. Temporal evolution of significance
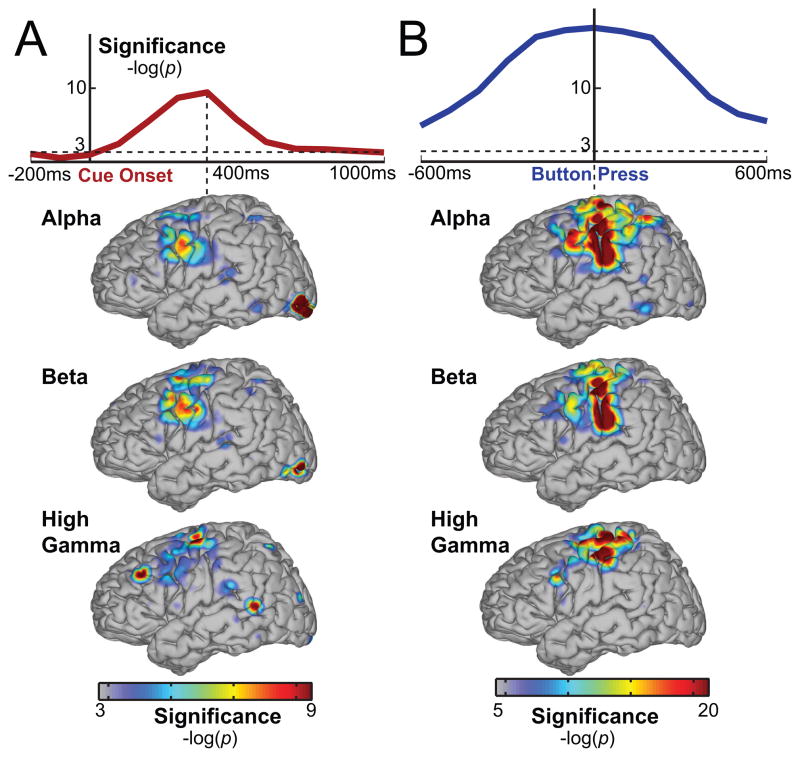
We also studied the temporal evolution of these significance indices after cue onset and around button press. To plot the temporal evolution of attentional engagement, first significance indices were calculated using all features (i.e., all frequency bands and locations), but separately for each time point between 200 msec before and 1000 msec after the cue onset. The first row of Figure 8A shows the −log(p) values of each 100 ms window averaged across all subjects. The significance index for attention peaks around 400 ms after cue onset. Significance indices were also computed 600 msec before and after the button press. In this case, the significance index peaks at the button press. Similar to the results shown in Figure 7, Figure 8B demonstrates that overt motor execution achieved greater significance than covert attention.
Figure 8.
(A) Top row: Temporal evolution of significance for decoding attentional engagement time aligned to cue onset and averaged across subjects. Bottom rows: Significance of cortical areas and spectral bands at the most significant time point (400 ms). (B) Temporal evolution of significance for decoding button press and cortical activations during button press.
For the time points that yielded maximum significance (i.e., 400 ms after cue onset and time of button press), cortical locations of significance are mapped in Figure 8 (bottom). The results again suggest differential attentional networks for the different frequency bands. The results shown for the button press in Figure 8B, which were computed over 100 ms around button press, suggest more localized activations over hand motor and sensory cortices as compared to Figure 7B, which was calculated for the whole one second around button press and also implicated the premotor and posterior parietal cortices.
3.4. Effect of eye movements
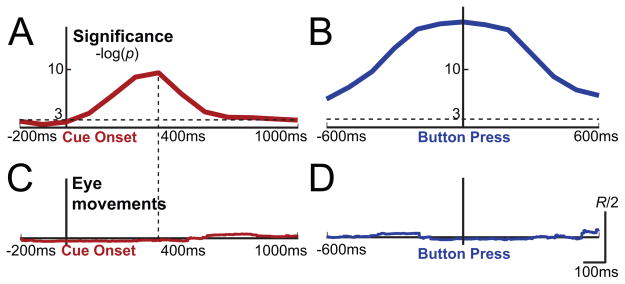
While eye movements were controlled for during online experiments, additional analyses were performed offline to visualize the extent to which brief eye movements might be related to the cued direction. To do this, a vector was constructed from the center of the screen to the point on the screen at which the subjects were looking, at each 100 ms time step. The inner product of this “gaze vector” and a unit vector in the direction of the cue arrow was computed for that given trial. An inner product of one means that the subjects were gazing towards the cue direction and an inner product of zero means they were not. However, the inner product only reveals the direction of their eye gaze and not their deviation from the center. To reflect this deviation, the inner product was scaled by the length of the eye gaze vector. Figures 9C–D show the time course of the average of these inner products, in addition to the temporal significance plots (Figures 9A–B). A vertical scale is also given to show that the magnitude of this product was much smaller than half the allowed radius, R. Hence, these plots demonstrate that the subjects’ eye movements did not affect the significance results of Figures 9A–B, as the products given in Figures 9C–D do not show a similar temporal trend.
Figure 9.
(A) Temporal evolution of significance for decoding attentional engagement time aligned to cue onset and averaged across subjects. (B) Temporal evolution of significance for decoding button press. (C–D) Inner product of eye gaze vector and direction of cue arrow (i.e., attentional locus) normalized to the allowed radius for these time periods.
4. Discussion
In this study, we comprehensively characterized the spatiotemporal dynamics of shifting of attention in ECoG activity during a modified Posner cueing task. The intrinsic spectral and temporal specificity of ECoG recordings allowed us to expand on the dorsal attention networks elucidated by previous neuroimaging studies. Specifically, the spectral specificity of ECoG allowed us to isolate differential spatial modulations for mu, beta, and high gamma activity, which can be readily accessed and decomposed with ECoG but not fMRI (Logothetis et al., 2001; Hermes et al., 2011). Spatially different activations across these different frequency bands suggest that selective control of sensory processing is realized using different physiological processes at in part different cortical networks. This is in contrast to low-level motor tasks (e.g., repeated hand opening and closing), for which studies have consistently identified spectral decreases in mu and beta amplitudes that spatially coincide with (although are somewhat less spatially specific than) increases in high gamma activity (Crone, Miglioretti, Gordon and Lesser (1998); Miller et al. (2007); see also Figures 7B and 8B). Moreover, high gamma activity has been shown to correlate well with spiking activity (Manning et al., 2009) and hemodynamic responses (Logothetis et al., 2001; Brovelli et al., 2005; Mukamel et al., 2005; Niessing et al., 2005; Lachaux et al., 2007; Hermes et al., 2011). This suggests that high gamma activity is likely an electro-physiological measure of local cortical activation produced by action potential firing (Miller, 2010). On the other hand, mu and beta modulations are thought to reflect thalamo-cortical interactions that gate local high gamma activity in the motor cortex (Miller et al., 2009; Canolty and Knight, 2010; Cohen et al., 2011). The results presented in Figures 7A and 8A are inconsistent with this gating hypothesis. Specifically, they suggest that mu and beta activations do not merely gate the local high gamma activity in the distributed cortical areas for attention, but contribute to physiological processes that engage higher-order thalamo-cortical and cortico-cortical interactions. In this context, Table 3 shows that classification accuracies are higher when features from all frequency bands are combined, which strengthens the hypothesis that ECoG in these different frequency bands represent complementary constituent attentional processes. At the same time, the detailed differential functional significance of the modulations of these different ECoG features during orienting of attention yet needs to be established.
The dynamics of the ECoG activations presented in this study also seem to reflect an attentional control signal that shifts between different attentive states rather than a signal that indicates the maintenance of attention (see temporal significance plot of Figure 8A). This is interesting, because attention (evidenced by improved reaction times) is behaviorally sustained beyond the transient period shown in Figure 8A. Such transient activity is also observed in different cortical areas of the dorsal attention network in fMRI studies (Yantis et al., 2002; Luks et al., 2008), although it is usually accompanied by sustained activity (Corbetta and Shulman, 2002; Luks et al., 2008). One explanation for this difference may be the increased spatial resolution of fMRI compared to ECoG. It is also possible that the ECoG component that continuously maintains the current attentive state and that reflects the current locus of attention could not be detected by our signal acquisition or analysis setup. This is particularly true for analyses of the phase of ECoG oscillations, which were not considered in this study.
Our results also demonstrate that the modulation of ECoG signals is greater during movement execution than during shifting of attention (Figure 8). This result is in line with a recent study (Miller et al., 2010) that compared ECoG changes for actual and imagined motor actions. This study reported that the magnitude of imagery-induced ECoG changes was ~25% of that associated with actual movements. Thus, it is possible that ECoG changes during covert tasks may generally be smaller than those during overt tasks.
This study provides the first evidence of the possibility to decode whether a person is paying attention and where he/she is attending directly from ECoG signals in single trials. The results in Figure 9 clearly show that the subjects’ eye movements had no systematic relation with the direction of the cued target. Thus, our results may eventually lead to real-time systems that are controlled through covert shifts of attention. For example, the ability to decode the locus of visual spatial attention could support the optimization of the locus of information in alerting applications. In an assistive technology context, people could select items or characters simply by paying attention to them, i.e., without having to direct gaze on the desired item. This capacity would be of most immediate benefit to people who are completely paralyzed and cannot fixate gaze, in particular because many existing brain-based visual selection systems (Farwell and Donchin, 1988) have important dependencies on gaze (Brunner et al., 2010; Treder and Blankertz, 2010).
The current practice for acquisition and study of ECoG has several limitations for basic neuroscientific research, as well as for translational applications. First, the extent of grid coverage and its placement is determined by the clinical needs of the patients. Hence, grid coverage is variable across subjects and cannot encompass all cortical areas of interest. The physical and cognitive condition and level of cooperation of each subject are also variable. Although we incorporated two control conditions (no change and neutral cue trials) to verify subject engagement, human ECoG experiments are for practical reasons typically less controlled than comparable studies in healthy human subjects or in animals. Furthermore, the subjects in the study suffered from epilepsy, and thus may have some degree of functional or structural reorganization compared to healthy individuals. Despite these issues, the results presented in this and other ECoG studies are usually consistent with expectations based on the neuroanatomy or on results from other imaging modalities.
Acknowledgments
This work was supported in part by grants from the US Army Research Office (W911NF-08-1-0216 (GS) and W911NF-07-1-0415 (GS)) and the NIH (EB006356 (GS) and EB000856 (GS)). The authors would like to thank the subjects for volunteering in our research, the staff of AMC Epilepsy Monitoring Unit for their assistance, and Griffin Milsap for technical support.
Footnotes
Publisher's Disclaimer: This is a PDF file of an unedited manuscript that has been accepted for publication. As a service to our customers we are providing this early version of the manuscript. The manuscript will undergo copyediting, typesetting, and review of the resulting proof before it is published in its final citable form. Please note that during the production process errors may be discovered which could affect the content, and all legal disclaimers that apply to the journal pertain.
References
- Awh E, Armstrong KM, Moore T. Visual and oculomotor selection: links, causes and implications for spatial attention. Trends Cogn Sci (Regul Ed) 2006;10(3):124–30. doi: 10.1016/j.tics.2006.01.001. [DOI] [PubMed] [Google Scholar]
- Bisley JW, Goldberg ME. Neuronal activity in the lateral intra-parietal area and spatial attention. Science. 2003;299(5603):81–6. doi: 10.1126/science.1077395. [DOI] [PubMed] [Google Scholar]
- Brovelli A, Lachaux JP, Kahane P, Boussaoud D. High gamma frequency oscillatory activity dissociates attention from intention in the human premotor cortex. Neuroimage. 2005;28(1):154–64. doi: 10.1016/j.neuroimage.2005.05.045. [DOI] [PubMed] [Google Scholar]
- Brunner P, Joshi S, Briskin S, Wolpaw JR, Bischof H, Schalk G. Does the P300 speller depend on eye gaze? Journal of Neural Engineering. 2010;7(5):056013. doi: 10.1088/1741-2560/7/5/056013. [DOI] [PMC free article] [PubMed] [Google Scholar]
- Burg JP. The relationship between maximum entropy spectra and maximum likelihood spectra. Geophysics. 1972;37:375–376. [Google Scholar]
- Buschman TJ, Miller EK. Top-down versus bottom-up control of attention in the prefrontal and posterior parietal cortices. Science. 2007;315(5820):1860–2. doi: 10.1126/science.1138071. [DOI] [PubMed] [Google Scholar]
- Canolty RT, Knight RT. The functional role of cross-frequency coupling. Trends Cogn Sci (Regul Ed) 2010;14(11):506–15. doi: 10.1016/j.tics.2010.09.001. [DOI] [PMC free article] [PubMed] [Google Scholar]
- Cohen MX, Wilmes K, van de Vijver I. Cortical electrophysiological network dynamics of feedback learning. Trends Cogn Sci (Regul Ed) 2011;15(12):558–66. doi: 10.1016/j.tics.2011.10.004. [DOI] [PubMed] [Google Scholar]
- Colby CL, Duhamel JR, Goldberg ME. Visual, presaccadic, and cognitive activation of single neurons in monkey lateral intraparietal area. Journal of Neurophysiology. 1996;76(5):2841–52. doi: 10.1152/jn.1996.76.5.2841. [DOI] [PubMed] [Google Scholar]
- Corbetta M, Akbudak E, Conturo TE, Snyder AZ, Ollinger JM, Drury HA, Linenweber MR, Petersen SE, Raichle ME, Essen DCV, Shulman GL. A common network of functional areas for attention and eye movements. Neuron. 1998;21(4):761–73. doi: 10.1016/s0896-6273(00)80593-0. [DOI] [PubMed] [Google Scholar]
- Corbetta M, Shulman GL. Control of goal-directed and stimulus-driven attention in the brain. Nat Rev Neurosci. 2002;3(3):201–15. doi: 10.1038/nrn755. [DOI] [PubMed] [Google Scholar]
- Crone NE, Miglioretti DL, Gordon B, Lesser RP. Functional mapping of human sensorimotor cortex with electrocorticographic spectral analysis. ii. event-related synchronization in the gamma band. Brain. 1998;121(Pt 12):2301–2315. doi: 10.1093/brain/121.12.2301. [DOI] [PubMed] [Google Scholar]
- Crone NE, Miglioretti DL, Gordon B, Sieracki JM, Wilson MT, Uematsu S, Lesser RP. Functional mapping of human sensorimotor cortex with electrocorticographic spectral analysis. i. alpha and beta event-related desynchronization. Brain. 1998;121(Pt 12):2271–2299. doi: 10.1093/brain/121.12.2271. [DOI] [PubMed] [Google Scholar]
- Duda RO, Hart PE, Stork DG. Pattern Classification. Wiley New; York, NY: 2001. [Google Scholar]
- Farwell L, Donchin E. Talking off the top of your head: toward a mental prosthesis utilizing event-related brain potentials. Electroencephalography and Clinical Neurophysiology. 1988;70:510–523. doi: 10.1016/0013-4694(88)90149-6. [DOI] [PubMed] [Google Scholar]
- Fox MD, Corbetta M, Snyder AZ, Vincent JL, Raichle ME. Spontaneous neuronal activity distinguishes human dorsal and ventral attention systems. Proc Natl Acad Sci USA. 2006;103(26):10046–51. doi: 10.1073/pnas.0604187103. [DOI] [PMC free article] [PubMed] [Google Scholar]
- Ghose GM, Maunsell JHR. Spatial summation can explain the attentional modulation of neuronal responses to multiple stimuli in area V4. J Neurosci. 2008;28(19):5115–26. doi: 10.1523/JNEUROSCI.0138-08.2008. [DOI] [PMC free article] [PubMed] [Google Scholar]
- Goldberg ME, Bisley J, Powell KD, Gottlieb J, Kusunoki M. The role of the lateral intraparietal area of the monkey in the generation of saccades and visuospatial attention. Ann N Y Acad Sci. 2002;956:205–15. doi: 10.1111/j.1749-6632.2002.tb02820.x. [DOI] [PubMed] [Google Scholar]
- Gottlieb JP, Kusunoki M, Goldberg ME. The representation of visual salience in monkey parietal cortex. Nature. 1998;391(6666):481–4. doi: 10.1038/35135. [DOI] [PubMed] [Google Scholar]
- Gregoriou GG, Gotts SJ, Zhou H, Desimone R. High-frequency, long-range coupling between prefrontal and visual cortex during attention. Science. 2009;324(5931):1207–10. doi: 10.1126/science.1171402. [DOI] [PMC free article] [PubMed] [Google Scholar]
- Hammett S, Snowden R. The effect of contrast adaptation on briefly presented stimuli. Vision Res. 1995;35(12):1721–1725. doi: 10.1016/0042-6989(94)00283-r. [DOI] [PubMed] [Google Scholar]
- Hermes D, Miller K, Vansteensel M, Aarnoutse E, Leijten F, Ramsey N. Neurophysiologic correlates of fmri in human motor cortex. Human Brain Mapping. 2011 doi: 10.1002/hbm.21314. [DOI] [PMC free article] [PubMed] [Google Scholar]
- Hopfinger JB, Buonocore MH, Mangun GR. The neural mechanisms of top-down attentional control. Nat Neurosci. 2000;3(3):284–91. doi: 10.1038/72999. [DOI] [PubMed] [Google Scholar]
- Jacobs J, Kahana MJ. Neural representations of individual stimuli in humans revealed by gamma-band electrocorticographic activity. J Neurosci. 2009;29(33):10203–14. doi: 10.1523/JNEUROSCI.2187-09.2009. [DOI] [PMC free article] [PubMed] [Google Scholar]
- Jennrich RI. Statistical methods for digital computers. Wiley; New York, NY: 1977. Stepwise discriminant analysis. [Google Scholar]
- Kastner S, Pinsk MA, Weerd PD, Desimone R, Ungerleider LG. Increased activity in human visual cortex during directed attention in the absence of visual stimulation. Neuron. 1999;22(4):751–61. doi: 10.1016/s0896-6273(00)80734-5. [DOI] [PubMed] [Google Scholar]
- Kubanek J, Miller K, Ojemann J, Wolpaw J, Schalk G. Decoding flexion of individual fingers using electrocorticographic signals in humans. Journal of neural engineering. 2009;6:066001. doi: 10.1088/1741-2560/6/6/066001. [DOI] [PMC free article] [PubMed] [Google Scholar]
- LaBerge D. Attentional Processing: The Brain’s Art of Mindfulness. Harvard University Press; Cambridge, MA: 1995. [Google Scholar]
- Lachaux J, Fonlupt P, Kahane P, Minotti L, Hoffmann D, Bertrand O, Baciu M. Relationship between taskrelated gamma oscillations and bold signal: New insights from combined fmri and intracranial eeg. Human brain mapping. 2007;28(12):1368–1375. doi: 10.1002/hbm.20352. [DOI] [PMC free article] [PubMed] [Google Scholar]
- Lancaster JL, Woldorff MG, Parsons LM, Liotti M, Freitas CS, Rainey L, Kochunov PV, Nickerson D, Mikiten SA, Fox PT. Automated Talairach atlas labels for functional brain mapping. Hum Brain Mapp. 2000;10(3):120–31. doi: 10.1002/1097-0193(200007)10:3<120::AID-HBM30>3.0.CO;2-8. [DOI] [PMC free article] [PubMed] [Google Scholar]
- Lee J, Maunsell JHR. Attentional modulation of MT neurons with single or multiple stimuli in their receptive fields. J Neurosci. 2010;30(8):3058–66. doi: 10.1523/JNEUROSCI.3766-09.2010. [DOI] [PMC free article] [PubMed] [Google Scholar]
- Leuthardt E, Miller K, Anderson N, Schalk G, Dowling J, Miller J, Moran D, Ojemann J. Electrocorticographic frequency alteration mapping: a clinical technique for mapping the motor cortex. Neurosurgery. 2007;60(4):260–70. doi: 10.1227/01.NEU.0000255413.70807.6E. [DOI] [PubMed] [Google Scholar]
- Logothetis NK, Pauls J, Augath M, Trinath T, Oeltermann A. Neurophysiological investigation of the basis of the fMRI signal. Nature. 2001;412(6843):150–7. doi: 10.1038/35084005. [DOI] [PubMed] [Google Scholar]
- Luck SJ, Chelazzi L, Hillyard SA, Desimone R. Neural mechanisms of spatial selective attention in areas V1, V2, and V4 of macaque visual cortex. J Neurophysiol. 1997;77(1):24–42. doi: 10.1152/jn.1997.77.1.24. [DOI] [PubMed] [Google Scholar]
- Luks TL, Sun FT, Dale CL, Miller WL, Simpson GV. Transient and sustained brain activity during anticipatory visuospatial attention. Neuroreport. 2008;19(2):155–9. doi: 10.1097/WNR.0b013e3282f4a14f. [DOI] [PubMed] [Google Scholar]
- Manning JR, Jacobs J, Fried I, Kahana MJ. Broadband shifts in local field potential power spectra are correlated with single-neuron spiking in humans. J Neurosci. 2009;29(43):13613–20. doi: 10.1523/JNEUROSCI.2041-09.2009. [DOI] [PMC free article] [PubMed] [Google Scholar]
- Mantini D, Marzetti L, Corbetta M, Romani GL, Del Gratta C. Multimodal integration of fmri and eeg data for high spatial and temporal resolution analysis of brain networks. Brain Topogr. 2010;23(2):150–158. doi: 10.1007/s10548-009-0132-3. [DOI] [PMC free article] [PubMed] [Google Scholar]
- Mellinger J, Schalk G. Toward Brain-Computer Interfacing. MIT Press; 2007. BCI2000: A General-Purpose Software Platform for BCI Research. [Google Scholar]
- Miller KJ. Broadband spectral change: evidence for a macroscale correlate of population firing rate? J Neurosci. 2010;30(19):6477–6479. doi: 10.1523/JNEUROSCI.6401-09.2010. [DOI] [PMC free article] [PubMed] [Google Scholar]
- Miller KJ, Leuthardt EC, Schalk G, Rao RPN, Anderson NR, Moran DW, Miller JW, Ojemann JG. Spectral changes in cortical surface potentials during motor movement. J Neurosci. 2007;27(9):2424–32. doi: 10.1523/JNEUROSCI.3886-06.2007. [DOI] [PMC free article] [PubMed] [Google Scholar]
- Miller KJ, Schalk G, Fetz EE, den Nijs M, Ojemann JG, Rao RPN. Cortical activity during motor execution, motor imagery, and imagery-based online feedback. Proceedings of the National Academy of Sciences. 2010;107(9):4430–4435. doi: 10.1073/pnas.0913697107. [DOI] [PMC free article] [PubMed] [Google Scholar]
- Miller KJ, Sorensen LB, Ojemann JG, den Nijs M. Power-law scaling in the brain surface electric potential. PLoS Comput Biol. 2009;5(12):e1000609. doi: 10.1371/journal.pcbi.1000609. [DOI] [PMC free article] [PubMed] [Google Scholar]
- Moran J, Desimone R. Selective attention gates visual processing in the extrastriate cortex. Science. 1985;229(4715):782–4. doi: 10.1126/science.4023713. [DOI] [PubMed] [Google Scholar]
- Motter BC. Focal attention produces spatially selective processing in visual cortical areas V1, V2, and V4 in the presence of competing stimuli. J Neurophysiol. 1993;70(3):909–19. doi: 10.1152/jn.1993.70.3.909. [DOI] [PubMed] [Google Scholar]
- Mukamel R, Gelbard H, Arieli A, Hasson U, Fried I, Malach R. Coupling between neuronal firing, field potentials, and fmri in human auditory cortex. Science. 2005;309(5736):951–4. doi: 10.1126/science.1110913. [DOI] [PubMed] [Google Scholar]
- Niessing J, Ebisch B, Schmidt KE, Niessing M, Singer W, Galuske RAW. Hemodynamic signals correlate tightly with synchronized gamma oscillations. Science. 2005;309(5736):948–51. doi: 10.1126/science.1110948. [DOI] [PubMed] [Google Scholar]
- Pei X, Leuthardt EC, Gaona CM, Brunner P, Wolpaw JR, Schalk G. Spatiotemporal dynamics of electrocorticographic high gamma activity during overt and covert word repetition. Neuroimage. 2010 doi: 10.1016/j.neuroimage.2010.10.029. [DOI] [PMC free article] [PubMed] [Google Scholar]
- Posner MI. Orienting of attention. Q J Exp Psychol. 1980;32(1):3–25. doi: 10.1080/00335558008248231. [DOI] [PubMed] [Google Scholar]
- Posner MI, Snyder CR, Davidson BJ. Attention and the detection of signals. J Exp Psychol. 1980;109(2):160–74. [PubMed] [Google Scholar]
- Posner M, Petersen S. The attention system of the human brain. Annual Review of Neuroscience. 1990;13:25–42. doi: 10.1146/annurev.ne.13.030190.000325. [DOI] [PubMed] [Google Scholar]
- Schalk G. Can electrocorticography (ECoG) support robust and powerful brain-computer interfaces? Front Neuroengineering. 2010;3:9–9. doi: 10.3389/fneng.2010.00009. [DOI] [PMC free article] [PubMed] [Google Scholar]
- Schalk G, Kubanek J, Miller K, Anderson N, Leuthardt E, Ojemann J, Limbrick D, Moran D, Gerhardt L, Wolpaw J. Decoding two-dimensional movement trajectories using electrocorticographic signals in humans. Journal of neural engineering. 2007;4:264. doi: 10.1088/1741-2560/4/3/012. [DOI] [PubMed] [Google Scholar]
- Schalk G, McFarland D, Hinterberger T, Birbaumer N, Wolpaw J. BCI2000: A general-purpose, brain-computer interface (BCI) system. IEEE Trans Biomed Eng. 2004;51(6):1034–1043. doi: 10.1109/TBME.2004.827072. [DOI] [PubMed] [Google Scholar]
- Strotzer M. One century of brain mapping using brodmann areas*. Clin Neuroradiol. 2009;19(3):179–186. doi: 10.1007/s00062-009-9002-3. [DOI] [PubMed] [Google Scholar]
- Szczepanski SM, Konen CS, Kastner S. Mechanisms of spatial attention control in frontal and parietal cortex. J Neurosci. 2010;30(1):148–60. doi: 10.1523/JNEUROSCI.3862-09.2010. [DOI] [PMC free article] [PubMed] [Google Scholar]
- Taylor M, Creelman C. PEST: Efficient estimates on probability functions. The Journal of the Acoustical Society of America. 1967;41:782. [Google Scholar]
- Treder MS, Blankertz B. (C)overt attention and visual speller design in an ERP-based brain-computer interface. Behav Brain Funct. 2010;6:28. doi: 10.1186/1744-9081-6-28. [DOI] [PMC free article] [PubMed] [Google Scholar]
- Yantis S, Schwarzbach J, Serences JT, Carlson RL, Steinmetz MA, Pekar JJ, Courtney SM. Transient neural activity in human parietal cortex during spatial attention shifts. Nat Neurosci. 2002;5(10):995–1002. doi: 10.1038/nn921. [DOI] [PubMed] [Google Scholar]


