Abstract
We present a detailed description of an adaptive harmonic generation (HG) microscope and culture techniques that permit long-term, three-dimensional imaging of mouse embryos. HG signal from both pre- and postimplantation stage (0.5–5.5 day-old) mouse embryos are fully characterized. The second HG images reveal central spindles during cytokinesis whereas third HG images show several features, such as lipid droplets, nucleoli, and plasma membranes. The embryos are found to develop normally during one-day-long discontinuous HG imaging, permitting the observation of several dynamic events, such as morula compaction and blastocyst formation.
Keywords: nonlinear microscopy, adaptive optics, three-dimensional microscopy, medical and biological imaging
1 Introduction
An understanding of the dynamic processes during mammalian embryogenesis is important not only for integrating our increasingly detailed knowledge of development, but also has important applications for therapy in humans. Recent advances in imaging techniques have opened up the possibility of studying these dynamic processes as they happen in living embryos. However, current approaches to imaging suffer from several limitations, the major one being that they rely on fluorescence of dyes or proteins to visualize cells, resulting in a significant cumulative photodamage to the embryo. This imposes a limit on the spatial and temporal resolution of the image data acquired. Furthermore, there is increasing evidence that the labeling of cells perturbs their developmental behavior.1
In order to arrive at an accurate picture of the changing structure of the developing embryos, a noninvasive, label-free imaging method that can provide high-resolution four-dimensional information is required. Methods such as magnetic resonance imaging (MRI),2 ultrasound,3 and optical projection tomography4 have been explored for this purpose but have drawbacks in their resolution and image acquisition time. Confocal fluorescence microscopy5 can provide desired three-dimensional resolution and speed but is limited by the photodamage induced, the depths to which the visible excitation light can penetrate into the specimen, and by the need for exogenous markers. Light sheet fluorescence microscopes are shown to be a useful tool for capturing dynamic events in transparent specimen.6 Two-photon microscopes can provide similar resolution to a confocal microscope, and because they use infrared lasers, the excitation light can penetrate further into the specimen so that imaging is effective at greater depths.7 However, they still require exogenous fluorophores and the in-focus absorption can be high enough to induce photodamage particularly at early developmental stages, when the embryo is fairly delicate.
Harmonic generation (HG) microscopes, on the other hand, are capable of providing three-dimensional, label-free images of biological specimens.8 HG microscopes take advantage of the nonlinear optical processes of second harmonic generation (SHG) and third harmonic generation (THG), which occur when intense light fields interact with materials. SHG involves the generation of light at half the wavelength of the incident light waves while THG produces light waves with one-third of the wavelength of the incident waves. As with two-photon fluorescence microscopy (TPF), HG microscopy shows inherent three-dimensional resolution and deeper penetration in scattering samples. SHG can only be observed in materials that do not possess inversion symmetry, and structures such as muscle, microtubules, and collagen fibers are known to generate a measurable SHG signal.9 THG on the other hand, is allowed in all materials. THG images demarcate spatial variation in the linear and/or nonlinear optical properties of the specimen.10,11 Because of the high third-order nonlinear susceptibility, lipid droplets are among the objects that yield a high THG signal.12
A major benefit of using HG microscopes for developmental biology is the significant reduction in phototoxic effects compared to other imaging methods. Energy is conserved during the HG process—the emitted photon energy is the same as the total absorbed photon energy—thus, the process deposits no energy in the specimen. Furthermore, because the HG process occurs without the addition of exogenous markers, as would usually be required for fluorescence imaging, HG microscopy is considered to be relatively noninvasive. Debarre et al. have reported viability of 96% in isolated hepatocyte cells after 3-D THG imaging (90 mW, 1180 nm laser wavelength, 0.8 NA, 20 μm/ms scanning speed, 0.6 s per image plane, 100 images recorded 0.2 μm apart).12
Recently, several groups have successfully demonstrated the potential of the HG microscope for observation of developmental dynamics in live drosophila embryos,13 zebrafish embryos,14 and early mouse embryos.15 Chu et al. have continuously monitored the development of the zebrafish embryos throughout a 12-hour period (100 mW, 1230 nm laser wavelength, NA 0.9, with a total exposure of over 1000 J optical energy to one embryo) and found 100% survival rate, one day after imaging.14 Hsieh et al. have reported that after 10 min of continuous HG imaging of mouse embryos (140 mW, 1230 nm wavelength, 29 J per embryo over a total imaging time of 10 min), 67% of embryos have fully developed.15 Our previous experiments suggest that including adaptive optics in HG microscopes to compensate for the optical aberrations would allow significant signal improvement and resolution at lower illumination power levels.16 This would be particularly useful in live, long-term imaging of highly photosensitive specimens, such as mammalian embryos. Apart from the photosensitivity, the viability of early-stage mammalian embryos is strongly affected by the culture conditions. Therefore, long-term imaging of normal embryo development in the HG microscope can only be implemented alongside refinement of existing culture techniques. Furthermore, the HG microscope must be adapted to maintain embryos at a stable temperature and appropriate pH.
In this paper, we give a detailed description of the methods that permit long-term HG imaging. This required concurrent refinement of both the optical design and embryo culture methods, because the consequences of design choices in both areas were linked. For example, demands for high resolution and signal level lead to certain specifications for the combination objective and condensor lenses. However, these components must also be compatible with the environmental conditions required for embryo development. We outline factors that were considered in the design of the microscope. We have characterized HG signals from both pre- and postimplantation mouse embryos (from 0.5 days to 5.5 days old). SHG images show central spindles during cytokinesis, and THG images are characterized by high-contrast, micrometer-sized lipid droplets.17 In addition to the strong signal from lipid droplets, the THG images clearly reveal features such as nucleoli and the plasma membrane. We also show that adaptive HG microscopy can be used for 3-D time-lapse imaging, allowing the observation of several developmental dynamics as they happen inside the live embryos.
2 Materials and Methods
2.1 Adaptive Harmonic Generation Microscope
Several factors must be considered in achieving the best HG images of photosensitive specimens. One of the important aspects is the selection of excitation wavelength. We employed a Cr: Forsterite laser system (CrF-65P, Avesta Project, Moscow), which emits 65-fs pulses at a repetition rate of 76 MHz. The wavelength was centered at 1230 nm, and the output average power was ~200 mW. The choice of the illumination laser wavelength (1230 nm) was influenced by the relatively low absorption of this wavelength by biological tissues and the convenient placement of the SHG and THG around 600 and 400 nm, respectively, permitting the use of standard optics and detectors. The following factors all lead to aberrations and, thereby, reduction in the focal spot intensity: The use of microscope objectives designed for visible wavelengths, refractive index variations between the coverglass and the immersion medium, and keeping the objective lens at a higher temperature for the embryo culture.18 Therefore, we incorporated a deformable mirror (DM) in the microscope, to compensate for such system-induced optical aberrations.
Figure 1(a) depicts an outline of the experimental setup. The diameter of the beam at the laser output was 1.2 mm and was expanded 4× using a telescope arrangement. The expanded laser beam was scanned by a pair of galvanometric mirrors (VM1000, GSI Lumonics, Bedford, Massachusetts), which were imaged onto the DM (MIRAO 52-e, Imagine Eyes, Orsay, France) by a 2.5× telescope. The entire active area of the DM was then again imaged onto the pupil plane of the microscope objective using a pair of telescope arrangements with total magnification 0.75. This imaging was critical for the calibration of the DM and for the accurate generation of wavefront aberration modes at the pupil plane. The shape of the DM can be controlled by actuators located beneath its silver-coated membrane. All the lenses selected for the telescopes were near-infrared (NIR)– coated doublets to maximize the transitivity of the laser beam and to minimize the aberrations. The expansion of the beam was designed in such a way as to achieve a truncated Gaussian illumination profile at the back aperture of the objective lens (the intensity variation across the pupil plane was no more than 30%). This was chosen to provide a compromise between optimum resolution, which would be provided by an overexpanded beam, and higher focal intensity, corresponding to an underfilled aperture. We selected an Olympus UApo/340 water immersion objective [40×, numerical aperture (NA) = 1.15] for focusing the illumination light on the specimen. Although this objective was optimized for UV wavelengths, its transmission at the 1230-nm laser wavelength (nearly 40%) was higher than a range of other standard microscope objectives that were tested. The average laser power available at the sample plane was 20% of the laser output power.
Fig. 1.
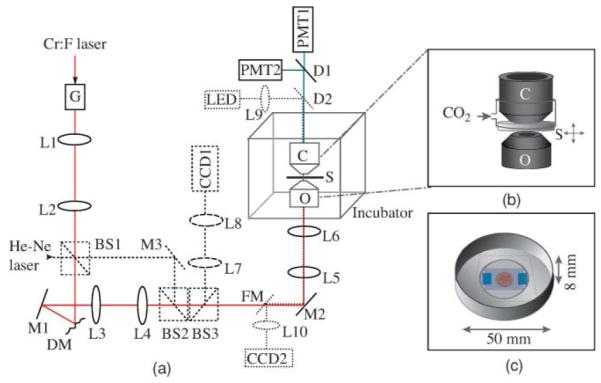
(a) Schematic of the adaptive harmonic generation microscope. Lx, lens; Mx, mirror; BSx, beam splitter; G, Galvo mirrors; DM, deformable mirror; O, objective; S, specimen; C, condenser; Dx, dichroic; PMTx, photomultiplier tubes; FM, flip-mirror. He–Ne laser (dashed outline) is used for DM characterization, and this path is disabled during imaging. Dotted lines show the LED illumination path for wide-field transmitted light imaging. The incubator maintains a stable temperature at 37 °C around the sample stage. (b) A magnified view of the region around the sample. A small plastic chamber around the culture dish, into which a humidified mixture of 5% CO2 in air is supplied to maintain the pH of the culture medium. (c) Illustration of the culture dish showing the placement of the embryos.
The HG signal emission pattern is sensitive to the relative orientation of the features with in the specimen with respect to the focal spot.11 Therefore, the harmonic light was collected in a transconfiguration by a high NA, oil immersion condenser (NA = 1.4, Olympus, Tokyo, Japan). A dichroic beam splitter (FF495-Di02-25×36, Semrock, USA) was used to transmit the SHG wavelength while reflecting the THG signals. The HG signals were then recorded on two separate photoncounting photomultiplier tubes (PMTs). A bandpass filter FF01-625/26 (Semrock) was inserted before the SHG PMT (H7422P-40 Hamamatsu, Japan) and another bandpass filter FF01-417/60 was placed before the THG PMT(P30PC-01, SensTech, Berkshire, UK) to further improve the signal to noise ratio.
Scanning in the axial (z) direction was enabled by a piezoactuator attached to the sample stage. A software-controlled shutter was inserted in front of the laser to block the laser beam while not scanning. DM control, 3-D, and time-lapse data acquisition and shutter control were performed with LabView software. The DM calibration was performed as described in Ref. 19. A helium-neon laser beam (633 nm) was used for this purpose. This path was disabled during HG imaging by removing the beam-splitter cubes. A green LED source and a CCD camera were employed for wide-field transmitted light imaging of the specimen for sample viewing and alignment.
2.2 Mouse Embryo Preparation and Culture
Early mouse embryos are extremely sensitive to the their culture environment. Not only do they have strict nutritional requirements, they also require constant humidity to help minimize evaporation of the culture medium. Because they normally develop in a controlled uterine environment, they do not tolerate changes in temperature and pH well. Embryos are normally cultured in tissue-culture incubators, which have a relatively large volume maintained at 37 °C, 100% humidity and an atmosphere of 5% CO2 in air. This large volume buffers any fluctuations in environmental conditions.
In order to support embryo growth under our microscope, we constructed a Plexiglas enclosure around the microscope to maintain the temperature. A fan heater (FLH 400 W, Pfannenberg, Hamburg, Germany) was mounted inside the enclosure and connected to a custom-built temperature-controller unit to maintain a stable temperature of 37 °C around the sample stage. Vibration-dampening air cushions were inserted on the heater mount as well as on the base of the enclosure to remove the vibrations due to the fan. In order to create a microenvironment with the correct atmospheric gas mix, the condenser and sample were enclosed by a small plastic chamber into which a humidified mixture of 5% CO2 in air was supplied to maintain the pH of the culture medium [Fig. 1(b)].
Embryos in a tissue-culture incubator are normally cultured in a drop of medium covered with mineral oil to prevent evaporation. The mineral oil allows gas exchange; thus, the medium remains at the correct pH in the course of culture. To culture embryos in our microscope, we had to design an approach that accommodated both culturing and imaging needs. The medium for embryo imaging was KSOM (MR-050P-5F, Millipore, Billerica, Massachusetts) supplemented with essential amino acids (11130-036, Invitrogen, Paisley, UK), nonessential amino acids (Invitrogen 11140-350), and sodium pyruvate. Embryos were placed in a drop of this medium in a glass-bottom dish (Mattek, Ashland, Massachusetts). Because harmonic generation is primarily forward propagated, the drop of medium was covered with a coverglass. To provide space for the embryo, the coverglass was supported by mylar spacers of 200-μm thickness that were affixed using nontoxic silicone grease. The dish was then filled with embryo-grade mineral oil (M5310, Sigma St. Louis, Missouri) to prevent evaporation of the medium [Fig. 1(c)]. The coverglass over the drop of medium had to be made small enough (approximately 25×25 mm2) to permit efficient gas exchange between the medium and the 5% CO2 environment. Despite not having the optimum refractive index, the mineral oil used to cover the culture medium was also used as the immersion medium for the condenser lens, because standard immersion oils were found to be toxic to the embryos.
2.3 Aberration Correction
We used the THG signal generated from coverglass–culture medium interface to compensate for the system-induced aberrations in the HG microscope. The aberration correction was performed in a sequential manner, based on modal wave-front sensing as described in Ref. 16. This correction procedure in total, took nearly 1 min. This consists predominantly of spherical aberration, partially due to incomplete coverglass thickness compensation in the objective lens and partially due to the use of this objective at an out-of-specification wavelength. Compensation of system aberrations was performed once before the imaging of each specimen, and the same correction was used throughout the imaging process. Further correction of specimen-induced aberrations was not performed during this study. Compensating system aberrations not only improve the image resolution but also resulted in overall signal improvement of nearly 40%. This allowed us to reduce the laser average power at the sample down to nearly 35 mW without compromising image brightness. This is considerably lower than the power levels used in the previously reported THG experiments.14,15
2.4 Imaging Properties of the Microscope
The design of the microscope required various pragmatic compromises between optical and biological requirements. The optical components were not necessarily optimized for the required imaging conditions, and the ability to simultaneously image several embryos demanded a wide field of view. We characterized the imaging properties in terms of field of view, uniformity of illumination, field curvature, and resolution.
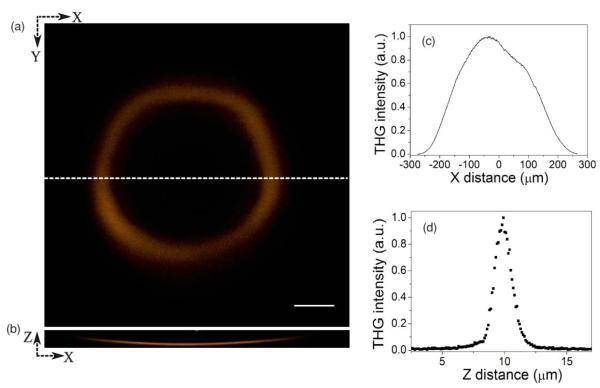
THG signal was obtained over a field of view of diameter 550 μm. This allows simultaneous observation of several early-stage embryos. We observed that the microscope had a curvature of field as demonstrated in Figs. 2(a) and 2(b), which show THG signal obtained from a coverslip–air interface when placed perpendicular to the beam-propagation direction. Figure 2(a) is an optical section from a stack of images, and Fig. 2(b) is an XZ view along Y = 0. The maximum distortion of the field was 15.5 μm over the 550-μm width. We attribute this effect to the use of the objective lens outside of its design specifications. Although the curvature is large across the whole field, it is far less significant over the ~100 μm width of each embryo specimen. As such, we did not consider this to have a detrimental effect on our results. If necessary, the measured focal plane distortion could be incorporated into future morphological analysis. THG signal intensity drops from the center to the periphery of the field, as shown in Fig. 2(c). We attribute this effect to the field-dependent aberrations as well as to the vignetting at extreme field positions. The aberration correction was performed only over a region of nearly 50×50 μm2 around the center of the field of view. The resulting correction phase amplitude had a root-mean-square (rms) value of 0.74 rad. After aberration correction, the axial THG intensity profile measured along the center of the field of view had a FWHM of 1.34 μm [Fig. 2(d)]. This is comparable to the corresponding theoretical value 1.15 μm for an unaberrated system, with uniform pupil illumination. The small discrepancy could be due the use of truncated Gaussian illumination in the experiment.
Fig. 2.
(a) THG signal from a cover slip–air interface placed perpendicular to the laser beam direction and (b) the corresponding XZ view demonstrating the curvature of field of the microscope. (c) THG signal variation across the entire field of view. (d) The axial THG intensity profile along the cover glass–air interface of a region near the center of the field of view has FWHM of 1.34 μm. Scale bar in (a) is 100 μm.
3 Results and Discussion
3.1 HG Characterization of Early Embryonic Development
Bacause embryos undergo dramatic changes in the course of early development, we characterized HG signals generated by live embryos at various stages; 0.5-day-old zygote, 1.5-day-old two-cell embryo, 2.5-day-old uncompacted morula, 3.5-day-old blastocyst, 4.5-day-old peri-implantation stage embryo, and 5.5-day-old postimplantation embryo. Embryos at these stages were found to be transparent to the 1230-nm wavelength light, and therefore, it was possible to observe the entire embryo. Optical sections were taken typically at a resolution 0.2–0.3 μm/pixel and were acquired at a rate of approximately 3–4 s/frame with z step of typically 0.5–1 μm. Three-dimensional rendering of images was done using Volocity software (Improvision, Coventry, UK) and ImageJ.21
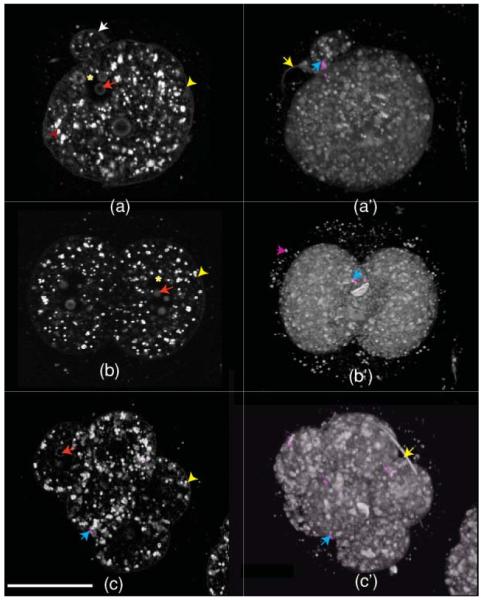
Figure 3 shows combined SHG (magenta) and THG (gray) images. Figures 3(a)–3(c) are single optical sections from 0.5-(single cell), 1.5-(2 cells), and 2.5-(8 cells) day-old embryos, respectively, and Figures 3(a′)–3(c′) are the corresponding 3-D opacity renderings. (In the 3-D images, the intensity is scaled logarithmically). It is evident that SHG and THG signals provide complementary information. On the basis of their shape, location, and similarity to published reports,20 we believe the SHG signal observed in the early-stage mouse embryos is most likely to be fibers of the central spindle (blue arrows) during the formation of the second polar body (white arrow) and cleavage division of blastomeres.
Fig. 3.
HG images of 0.5-(single cell), 1.5-(two cells), and 2.5-(morula) day-old mouse embryos. (a–c) are optical sections and (a c) are the corresponding 3-D opacity rendering (intensity in log scale). The SHG signal [blue arrows: pointing top right in (a′), middle part in (b′) and in the lower left part of (c) and (c′)] is from central spindles, whereas THG is predominantly from lipid droplets [red arrow head in the left side of (a)]. Features like the plasma membrane (yellow arrow head in the right side of (a-c)), nucleus [asterisk in (a)], nucleoli [red arrow pointing left in (a–c), sperm tail (yellow arrow on the top left part of (a′) and upper right part of (c′)], and second polar body [white arrow on the upper middle part of (a)] are also demarcated by THG microscopy. The scale bar is 30 μm. (Color online only.)
THG signals were observed from several features in the specimen. Our colocalization experiments have suggested that the majority of THG contrast generated by the preimplantation embryo is from lipid droplets.17 As can be seen from Fig. 3, the one-cell zygote, two-cell embryo, and eight-cell morula are all roughly similar, densely packed with numerous small lipid droplets. At these stages, the plasma membrane is faintly visible (yellow arrowhead), though it is overshadowed by the much stronger cytoplasmic lipid droplet (red arrowhead) signal. The nuclear membrane, despite being a double membrane, does not generate detectable THG signal, but nuclei are visible as areas of absence of THG signal (yellow asterisk). It is interesting to note that the nuclear membrane in zebrafish embryos do generate THG signal.14 One possible reason why we do not detect a nuclear membrane signal in early-stage mouse embryos is because of a difference in the optical properties of the nuclear membranes and/or the surrounding regions. Another more likely reason is that the THG signal from the nuclear membrane in early mouse embryos is obscured by the very strong cytoplasmic THG signals. There seems to be a great deal less cytoplasmic THG signal in zebrafish, which might be why nuclear membrane signal is more readily visible in the zebrafish. In further support of this idea, we did detect nuclear membranes in later-stage mouse embryos, which have reduced cytoplasmic signal. The nucleoli with in the nucleus generate THG signal (red arrows) but become progressively more difficult to detect as the embryo develops. Extracellular features, such as the sperm tail (yellow arrow), give a relatively stronger THG signal, and a fainter THG signal is observed from zona-pellucida (magenta arrow).
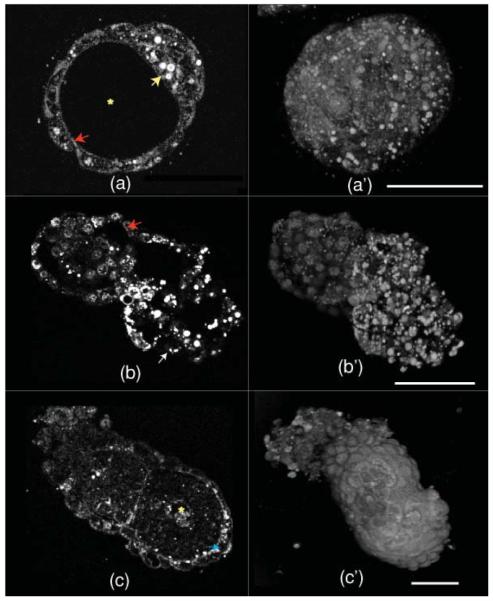
In Fig. 4, HG images from 3.5-, 4.5-, and 5.5-day-old embryos are shown. Figures 4(a)–4(c) are single optical sections, and Figs. 4(a′)–4(c′) are the corresponding 3-D opacity renderings (in log scale). By day 3.5, the embryos become blastocysts [Fig. 4(a)], characterized by a cavity called blastocoel (yellow asterisk), inner cell mass (yellow arrow), and an outer layer called trophectoderm (red arrow). In blastocysts, lipid droplets are fewer in number, larger, and rounded compared to those in earlier stages and are present both in trophectoderm and inner cell mass. The plasma membrane is also visible with high contrast in blastocysts [see Video 1 showing a 3-D volume rendering (maximum intensity projection) of a blastocyst].
Fig. 4.
HG images of 3.5-(blastocyst), 4.5-(peri-implantation), and 5.5-(postimplantation) day-old mouse embryos. (a–c) are optical sections and (a–c) are the corresponding 3D opacity rendering. In (a), the yellow arrow to the right marks the inner cell mass, the red arrow to the left the trophectoderm, and the asterisk the blastocoel cavity (see Video 1 for full 360-degree rotation of a blastocyst). In (b), the red arrow (top middle part) marks a cell nucleus and the white arrow (at the bottom) marks a lipid droplet. In (c), the blue arrow at the right marks HG signal from the basolateral aspect of the visceral endoderm and the asterisk marks the proamniotic cavity (see Video 2 for full 360-degree rotation of a 5.5-day-old embryo). The scale bar is 50 μm. (Color online only.)
Video 1.
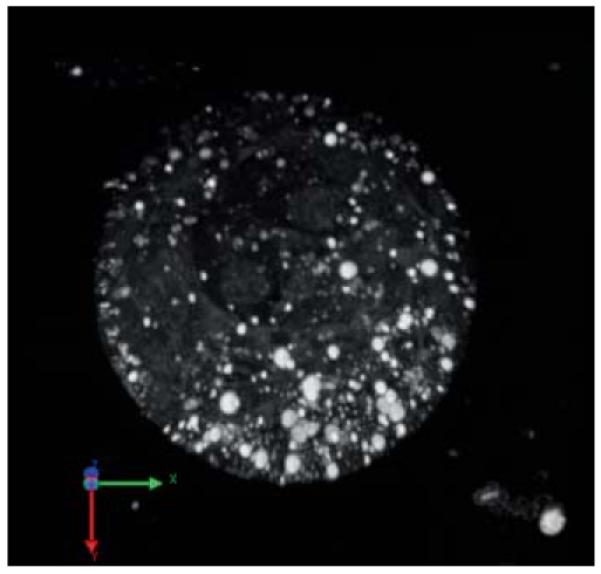
3-D volume rendering (maximum intensity projection) of a 3.5-day-old (blastocyst) mouse embryo (QuickTime, 2.7 MB) [URL: http://dx.doi.org/10.1117/1.3569614.1]
We found that the THG signal levels from the features such as plasma membrane, nuclear membrane, and lipid droplets vary in a stage-and-tissue-specific manner as the embryo develops. This can be due to the dynamic changes of their optical property differences with the surrounding media. In 4.5-day-old embryos, we start to see HG signal from the nucleus [red arrow in Fig. 4(b)] and relatively less signal from lipid droplets, which is localized predominantly to the mural trophectoderm [white arrow in Fig. 4(b)], which mediates invasion of the uterine wall during implantation. We do not know the significance of lipid localization specifically to the mural trophectoderm, but it may possibly have a role in implantation. The developing embryo is marked with a yellow asterisk and shows reduced amount of THG signals.
In 5.5-day-old embryos, the density of lipid droplets is further reduced. All three major tissues of the embryo are visible at this stage: the distal epiblast, the extraembryonic ectoderm, and covering them both, the visceral endoderm. The proaminotic cavity is also visible (yellow asterisk). The plasma membrane signal is much stronger but not uniformly so, being particularly distinct in the basolateral aspect of cells of the visceral endoderm [blue arrow in Fig. 4(c)]. The interface between the epiblast end extraembryonic ectoderm is also distinctly visible in THG images. The epiblast has a marked reduction of THG signal (the tissue between the blue arrow and the yellow asterisk). THG signals degrade significantly as we focus deeper in 4.5- and 5.5-day-old embryos (Video 2 shows 3-D opacity rendering of 5.5-day-old embryo). This is largely due to the specimen-induced aberrations,16 which are not compensated in the images shown here.
Video 2.
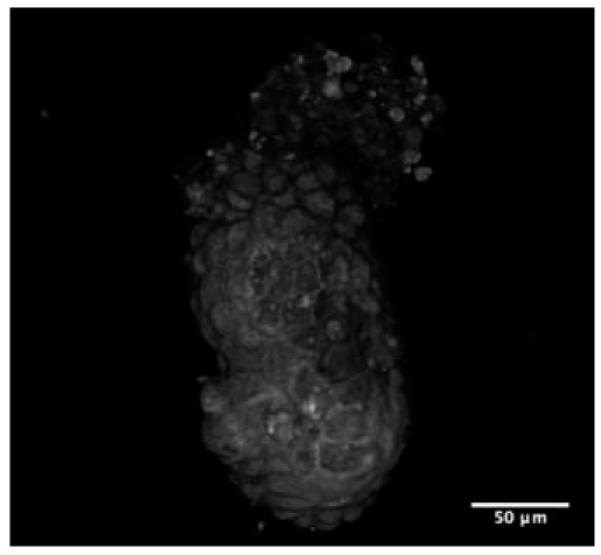
3-D opacity rendered view of a postimplantation stage (5.5-day-old) mouse embryo. (QuickTime, 954 KB) [URL: http://dx.doi.org/10.1117/1.3569614.2]
3.2 Long-Term HG Imaging
The combination of adaptive HG microscopy with new culture techniques allowed observation of dynamic changes in the embryo during its development. Video 3 shows 2-h long time-lapse imaging of a single optical section ~30-μm deep in the blastocyst with 0.2-μm/pixel resolution and at a frame rate of 20 frames/min. One can see lipid droplets of various sizes at high contrast in THG. The trophectoderm and inner cell mass can be clearly seen, and outlines of individual cells within them are faintly visible. One can also very clearly see the blastocoel cavity. The time-lapse sequence shows the blastocoel cavity growing in size, in part, by the incorporation of a smaller cavity near the beginning of the sequence. One can also see lipid droplets moving both within as well as in and out of the image plane.
Video 3.
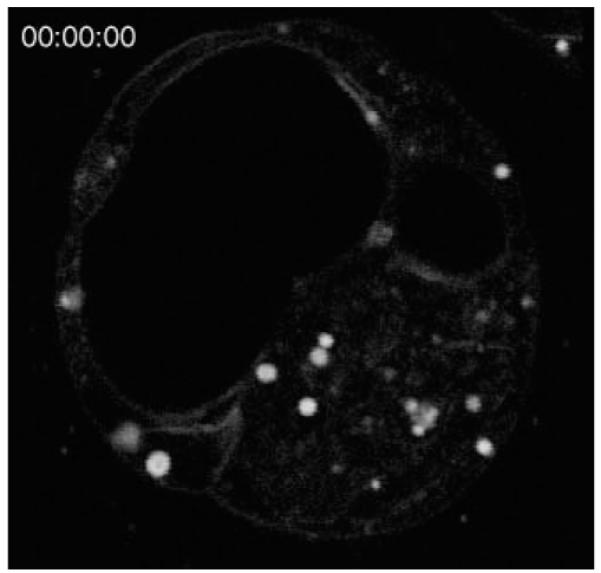
Two-hour time-lapse of a single optical section ~30 μm deep in the blastocyst. The frame rate of this movie is set to 1 frame/min. (QuickTime, 4.3 MB) [URL: http://dx.doi.org/10.1117/1.3569614.3]
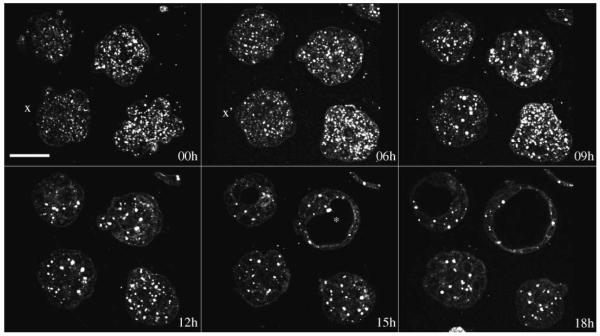
We also performed 3-D time-lapse HG imaging of the 2.5-day-old embryos (precompacted morulae) overnight. Figure 5 shows optical sections from a 19-h-long imaging procedure (with lateral resolution 0.5 μm/pixel, 11 optical sections 3 μm apart with a 1-h interval between each 3-D image stack). Several embryos were imaged simultaneously from morula to blastocyst stage. The wide field of view of the microscope was essential in this case so that we were able to image 9–12 embryos at a time. The embryos develop normally during the course of imaging, which ranged 18–40 h (i.e., able to compact, form cyst, and hatch from zona pellucida). Video 4 shows a 3-D movie, and and Video 5 is an optical section over 19 h, with a clearly formed cyst marked with a yellow asterisk. The cell membrane was obscured by small and numerous lipid droplets while they are more pronounced in older blastocysts, whose number of small lipid droplet had reduced (Fig. 5, 0 h and 18 h, respectively).
Fig. 5.
Optical sections from time-lapse imaging of mouse embryos showing morula compaction (x and x′) and blastocyst (asterisk) formation. Scale bar is 50 μm. See Video 4 for animated 3-D time-lapse movie and showing a time-lapse sequence of a single optical section. (Color online only.)
Video 4.
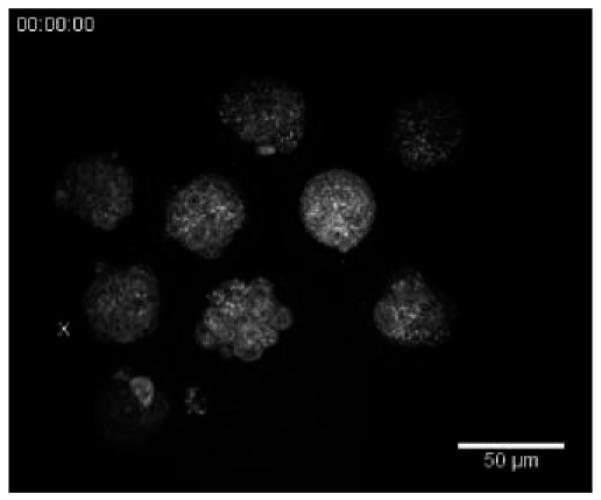
3-D time-lapse of the 2.5-day-old embryos over 19 h (lateral resolution 0.5 μm/pixel, 11 optical sections 3 μm apart with 1-h interval between each 3-D image stack). X, X′, X′′ marks an embryo at different stages of development; precompacted morula, morula, and blastocyst, respectively. (QuickTime, 202 KB) [URL: http://dx.doi.org/10.1117/1.3569614.4]
Video 5.
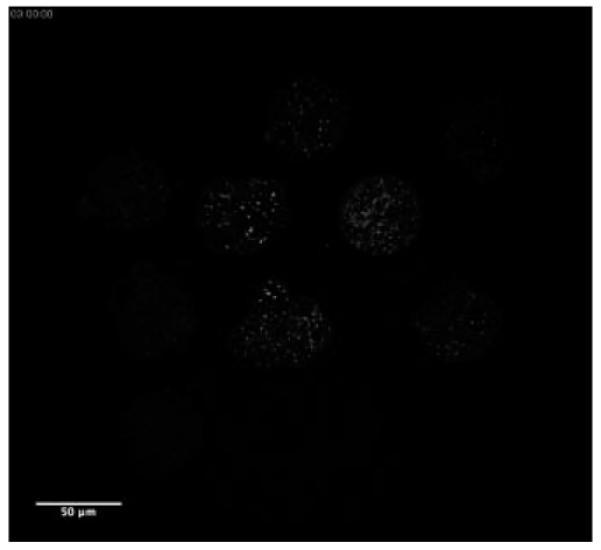
Time lapse of embryo development (a single optical section) from precompacted morula to blastcyst during 19-h long THG imaging (QuickTime, 767 KB) [URL: http://dx.doi.org/10.1117/1.3569614.5]
4 Conclusions
In conclusion, we have presented a detailed description of an HG microscope that allows long-term imaging of photosensitive specimens, such as early-stage mouse embryos. The required refinement of the optical setup as well as the culture conditions essential for the embryo viability are described. The imaging properties of the microscope have also been presented in terms of field of view, uniformity of illumination, curvature of the field, and resolution. High-resolution 3-D images of the embryos were obtained at a significantly lower illumination power by incorporating adaptive optics into the microscope. Several different structures in the embryos were revealed by the HG microscope at different stages of development. SHG signals were obtained from the central spindles during cytokinesis, whereas THG was generated from many objects in the specimen providing rich structural information about the embryo. Lipid droplets could be readily observed in the THG images in a highly specific manner, and therefore, this technique has great potential to study lipid droplet dynamics.17 We have shown that time-lapse imaging allowed observation of several developmental processes, such as morula compaction and blastocyst formation as they happen inside the embryo. This suggests that HG microscopy might be useful for studying the dynamics of blastocoel cavity formation, about which little is known. Compensating specimen-induced aberrations during long-term imaging of live mouse embryos increases the sample exposure. This will affect the embryo viability. Further improvements in adaptive HG imaging would allow compensation of specimen-induced aberrations to remove the drop in HG intensity as we focus deeper into the embryo. Because of the nature of the signal-generation process and being a label-free imaging technique, phototoxicity in HG microscopy is thought to be low. However, our previous experiments demonstrate that HG imaging affects the long-term viability of the embryos (see Ref. 17 for details). Phototoxicity effects from long-term HG imaging are not negligible and should remain a major consideration in its use.
Acknowledgments
This work was supported by BBSRC Grant No. BB/F011512/1. M.J.B. was supported by EPSRC (Grant No. EP/E055818/1). A.J. was supported by the Austrian Science Fund (Grant No. J2826-N20). S.S. was supported by a Wellcome Trust RCDF (Grant No. 074246/Z04/Z). We thank Vivienne Wilkins for help with embryo dissections.
References
- 1.Piotrowska K, Wianny F, Pedersen RA, Zernicka-Goetz M. Blastomeres arising from the first cleavage division have distinguishable fates in normal mouse development. Development. 2001;128:3739–3748. doi: 10.1242/dev.128.19.3739. [DOI] [PubMed] [Google Scholar]
- 2.Greicius MD. Neuroimaging in developmental disorders. Curr. Opin. Neurol. 2003;16:143–146. doi: 10.1097/01.wco.0000063763.15877.d2. [DOI] [PubMed] [Google Scholar]
- 3.Turnbull DH, Bloomfield TS, Baldwin HS, Foster FS, Joyner AL. Ultrasound backscatter microscope analysis of early mouse embryonic brain development. Proc. Natl. Acad. Sci., USA. 1995;92:2239–2243. doi: 10.1073/pnas.92.6.2239. [DOI] [PMC free article] [PubMed] [Google Scholar]
- 4.Sharpe J, Ahlgren U, Perry P, Hill B, Ross A, Hecksher-Srensen J, Baldock R, Davidson D. Optical projection tomography as a tool for 3D microscopy and gene expression studies. Science. 2002;296(5567):541–545. doi: 10.1126/science.1068206. [DOI] [PubMed] [Google Scholar]
- 5.Pawley JB. Handbook of Biological Confocal Microscopy. Springer; New York: 2006. [Google Scholar]
- 6.Keller PJ, Schmidt AD, Wittbrodt J, Stelzer EHK. Reconstruction of zebrafish early embryonic development by scanned light sheet microscopy. Science. 2008;322(5904):1065–1069. doi: 10.1126/science.1162493. [DOI] [PubMed] [Google Scholar]
- 7.Denk W, Strickler JH, Webb WW. Two-photon laser scanning fluorescence microscopy. Science. 1990;248(4951):73–76. doi: 10.1126/science.2321027. [DOI] [PubMed] [Google Scholar]
- 8.Barad Y, Eisenberg H, Horowitz M, Silberberg Y. Nonlinear scanning laser microscopy by third harmonic generation. Appl. Phys. Lett. 1997;70:922–924. [Google Scholar]
- 9.Campagnola PJ, Millard AC, Terasaki M, Hoppe PE, Malone CJ, Mohler WA. Three-dimensional high-resolution second-harmonic generation imaging of endogenous structural proteins in biological tissues. Biophy. J. 2002;82(1):493–508. doi: 10.1016/S0006-3495(02)75414-3. [DOI] [PMC free article] [PubMed] [Google Scholar]
- 10.Yelin D, Silberberg Y. Laser scanning third-harmonic-generation microscopy in biology. Opt. Express. 1999;5:169–175. doi: 10.1364/oe.5.000169. [DOI] [PubMed] [Google Scholar]
- 11.Cheng J-X, Xie XS. Green’s function formulation for third-harmonic generation microscopy. J. Opt. Soc. Am. B. 2002;19:1604–1610. [Google Scholar]
- 12.Debarre D, Supatto W, Pena A-M, Fabre A, Tordjmann T, Combettes L, Schanne-Klein M-C, Beaurepaire E. Imaging lipid bodies in cells and tissues using third-harmonic generation microscopy. Nat. Meth. 2006;3:47–53. doi: 10.1038/nmeth813. [DOI] [PubMed] [Google Scholar]
- 13.Debarre D, Supatto W, Farge E, Moulia B, Schanne-Klein M, Beaurepaire E. Velocimetric third-harmonic generation microscopy: micrometer-scalequantification of morphogenetic movements in unstained embryos. Opt. Lett. 2004;29:2881–2883. doi: 10.1364/ol.29.002881. [DOI] [PubMed] [Google Scholar]
- 14.Chu S, Chen S, Tsai T, Liu T, Lin C, Tsai H, Sun C. In vivo developmental biology study using noninvasive multi-harmonic generation microscopy. Opt. Express. 2003;11:3093–3099. doi: 10.1364/oe.11.003093. [DOI] [PubMed] [Google Scholar]
- 15.Hsieh C-S, Chen S-U, Lee Y-W, Yang Y-S, Sun C-K. Higher harmonic generation microscopy of in vitro cultured mammal oocytes and embryos. Opt. Express. 2008;16:11574–11588. [PubMed] [Google Scholar]
- 16.Jesacher A, Thayil A, Grieve K, Débarre D, Watanabe T, Wilson T, Srinivas S, Booth M. Adaptive harmonic generation microscopy of mammalian embryos. Opt. Lett. 2009;34:3154–3156. doi: 10.1364/OL.34.003154. [DOI] [PMC free article] [PubMed] [Google Scholar]
- 17.Watanabe T, Thayil A, Jesacher A, Grieve K, Debarre D, Wilson T, Booth M, Srinivas S. Characterisation of the dynamic behaviour of lipid droplets in the early mouse embryo using adaptive harmonic generation microscopy. BMC Cell Biol. 2010;11:38. doi: 10.1186/1471-2121-11-38. [DOI] [PMC free article] [PubMed] [Google Scholar]
- 18.Juškaitis R. Measuring the real point spread function of high numerical aperture microscope objective lenses. In: Pawley JB, editor. Handbook of Biological Confocal Microscopy. Springer; New York: 2006. pp. 239–250. [Google Scholar]
- 19.Booth MJ, Wilson T, Sun H-B, Ota T, Kawata S. Methods for the characterization of membrane deformable mirrors. Appl. Opt. 2005;44:5131–5139. doi: 10.1364/ao.44.005131. [DOI] [PubMed] [Google Scholar]
- 20.Navarro PAAS, Liu L, Trimarchi JR, Ferriani RA, Keefe DL. Noninvasive imaging of spindle dynamics during mammalian oocyte activation. Fertility Sterility. 2005;83:1197–1205. doi: 10.1016/j.fertnstert.2004.07.983. [DOI] [PubMed] [Google Scholar]
- 21.Schmid B, Schindelin J, Cardona A, Longair M, Heisenberg M. A high-level 3D visualization API for Java and ImageJ. BMC Bioinformatics. 2010;11:274. doi: 10.1186/1471-2105-11-274. [DOI] [PMC free article] [PubMed] [Google Scholar]


