Abstract
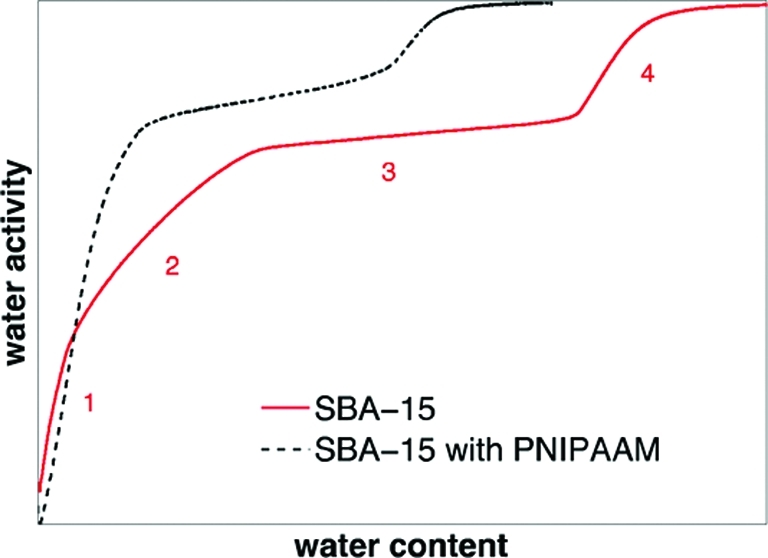
Mesoporous silica SBA-15 was modified in a three-step process to obtain a material with poly-N-isopropylacrylamide (PNIPAAM) grafted onto the inner pore surface. Water sorption calorimetry was implemented to characterize the materials obtained after each step regarding the porosity and surface properties. The modification process was carried out by (i) increasing the number of surface silanol groups, (ii) grafting 1-(trichlorosilyl)-2-(m-/p-(chloromethylphenyl) ethane, acting as an anchor for (iii) the polymerization of N-isopropylacrylamide. Water sorption isotherms and the enthalpy of hydration are presented. Pore size distributions were calculated on the basis of the water sorption isotherms by applying the BJH model. Complementary measurements with nitrogen sorption and small-angle X-ray diffraction are presented. The increase in the number of surface silanol groups occurs mainly in the intrawall pores, the anchor is mainly located in the intrawall pores, and the intrawall pore volume is absent after the surface grafting of PNIPAAM. Hence, PNIPAAM seals off the intrawall pores. Water sorption isotherms directly detect the presence of intrawall porosity. Pore size distributions can be calculated from the isotherms. Furthermore, the technique provides information regarding the hydration capability (i.e., wettability of different chemical surfaces) and thermodynamic information.
Introduction
Ordered mesoporous materials are subject to considerable research effort aimed at using the materials for various applications such as catalysis,1,2 drug delivery,3 and adsorbents.4−7 One course of action is to tailor the materials according to specific needs by the functionalization of (primarily) the huge internal surface area.8 Mesoporous silica materials, including the well-known MCM-419 and SBA-1510 silica, have in this respect been functionalized by several methods including postsynthesis grafting of various molecules on the inner pore surface.11−16 For instance, poly-N-isopropylacrylamide (PNIPAAM) was grafted on the walls of the mesopores in order to have a mean of active diffusion control.17−19 PNIPAAM exhibits a so-called lower critical solution temperature, LCST. Below this temperature, which is usually around 36 °C, the polymer is in a good solvent and is highly water-soluble, whereas above the temperature the polymer solubility decreases, which leads to the conformational collapse of the polymer chains.20,21 In other words, the polymer chains can at low temperature be regarded as more hydrophilic and therefore can adopt an elongated state (and can function thus as a diffusion hindrance) whereas the chains above the LCST appear to be more hydrophobic and collapse into a globular conformation (allowing free diffusion).22,23 Upon functionalization, it is required that the silica framework as such is preserved. The pore size, pore volume, and surface properties will be affected by the functionalization process, and for proper characterization, it is necessary to monitor both the porosity of the material and the dramatic changes in surface properties caused by the grafted material. In this work, we demonstrate that water sorption calorimetry is a suitable technique for fulfilling the characterization requirements regarding porosity as well as surface properties. Using this technique, valuable information is gained on SBA-15 functionalized with PNIPAAM and the different materials obtained in the stepwise functionalization process.
Porous material SBA-1510 is characterized by a 2D hexagonal structure (plane group p6m) with order on the mesoscopic scale. SBA-15, unlike the structurally similar MCM-41,9 possesses distinctive biporous character. The hexagonally ordered primary mesopores, with a very narrow pore size distribution, are highly connected through complementary pores, referred to as intrawall pores. These pores exhibit a broad pore size distribution from the micropore size (<2 nm) to the primary mesopore size (approximately 5 nm).24−27 This generates a highly complex 3D pore system resulting in complex diffusion processes of, for example, molecules in the pores.28,29
Nitrogen sorption is a technique that is commonly used to characterize porous materials, including mesoporous silica.30−32 It is also one of the first choices for the characterization of porous composites such as mesoporous silica functionalized with organic entities, including polymers.2,33 This method provides information mainly on geometrical properties (e.g., surface area, pore volume, and pore size). However, the surface properties are taken into account only to a certain extent in the available theoretical models for the analysis. The BET C value, for instance, provides some information because it is to a certain extent influenced by the adsorbent–adsorbate interaction. However, it is not solely influenced by the surface properties but also influenced by the microporosity, which is present in SBA-15.34 The performance of many applications (e.g., drug delivery35−37) relies on the available functional groups present on the surface. The loading capacity of drug molecules is partially dependent on the pore size.35 It is also strongly influenced by the interaction between the surface and molecules (e.g., drugs) that are taken up. It is thus important to monitor not only the porosity of the materials but also its surface properties. The particle diffusion in porous material is controlled by a number of mechanisms, with surface diffusion being an important contribution to the overall process.28,29 Hence, it is important to gain information on the surface properties of the functionalized mesoporous materials in order to tailor the drug-loading mechanism according to the needs of specific applications.3 The traditional schematic presentations of surface-functionalized materials with a rather homogeneous distribution throughout the whole material has been found to be too simplistic.34 It is necessary to consider that even after functionalization the concentration of surface silanol groups can be rather high and hence can contribute strongly to the overall surface properties of the functionalized material.34,38 Water sorption calorimetry, a technique sensitive to both surface properties, such as wettability, and porosity (see below), can provide valuable information that has an impact on a number of parameters that are critical for potential applications of mesoporous silica materials.39,40 This technique has previously been implemented and used for the characterization of mesoporous silica materials such as MCM-4139 and SBA-1540 in order to determine water sorption isotherms, the enthalpy of hydration, and the pore size distribution.40 The method has proven to be valuable for the characterization of both the hydration (i.e., the wettability) and porosity of these materials.39,40 With water sorption calorimetry, the presence (or absence) of intrawall pores in a mesoporous material, such as SBA-15, can be directly identified from the sorption isotherms.40 The intrawall porosity is manifested as an additional regime in the sorption isotherms. Nitrogen sorption, however, cannot directly identify the intrawall porosity from the sorption isotherms, but with advanced analysis methods, such as non-local-density functional theory (NLDFT),30 this pore category can be identified.
In this study, we evaluate the (pore) surface properties and the porosity of pure SBA-15 and functionalized SBA-15 with water sorption calorimetry. In addition to the presence of different types of pores, the water wettability of the surface is detectable from the water sorption isotherms.39
We have systematically studied the materials obtained in different steps leading to the final composite material of SBA-15 with grafted PNIPAAM.18 The properties of the final material are controlled by the first two steps (the location of the anchor determines where PNIPAAM is located because it functions as the starting point of polymerization), hence it is important to characterize them. Scheme 1 shows a representation of the surface modification after each step. First the calcined SBA-15 (Scheme 1a) material, denoted as SBA-15-1, is treated with an aqueous solution of nitric acid, which is aimed at increasing the number of surface (primarily at the porous inner surface) silanol groups (Scheme 1b). This material is denoted as SBA-15-2. Subsequently, 1-(trichlorosilyl)-2-(m-/p-(chloromethylphenyl) ethane is grafted to the surface (Scheme 1c), followed by the surface-initiated polymerization of n-isopropylacrylamide (Scheme 1d). These materials are denoted as SBA-15-3 and SBA-15-4, respectively.
Scheme 1. (a) SBA-15-1, (b) SBA-15-2 with an Increased Number of OH Groups, (c) SBA-15-3 with a Grafted Anchor, and (d) SBA15-4 with PNIPAAM.
Note that the images are only a schematic representation without absolute quantitative information.
The materials from each step in the modification process (i.e., SBA-15-1 to SBA-15-4) are evaluated by water sorption calorimetry. Complementary characterization is performed with small-angle X-ray diffraction (SAXD) and nitrogen sorption measurements. In a previous study, the corresponding samples were investigated by TGA, nitrogen sorption, and argon sorption.41 TGA showed a steep weight loss at around 400 °C, which is characteristic of PNIPAAM.
Experimental Section
Chemicals
The poly(ethylene oxide)-poly(propylene oxide)-based triblock copolymer (P104) was obtained as a gift from BASF and used as received. Tetramethylorthosilicate (TMOS) was obtained from Sigma-Aldrich (>98%), and HCl (12 M) was obtained from Merck. N-Isopropylacrylamide (>99% Sigma-Aldrich) was recrystallized from n-hexane (97% Sigma-Aldrich). 1-(Trichlorosilyl)-2-(m-/p-(chloromethylphenyl)ethane (Fluorochem Ltd.), toluene (anhydrous, Sigma-Aldrich), DMF (Sigma-Aldrich), CuCl (Sigma-Aldrich), 2,2-bipyridine (Sigma-Aldrich), acetone, and methanol were used without further purification.
Materials
On the basis of the original SBA-15 protocol,10 the initial SBA-15 silica material was synthesized by applying a modified procedure as described elsewhere.42 Triblock copolymer Pluronic P104 (EO27PO61EO27, 2.4 g) was dissolved in 93.8 g of 1.6 M HCl. The temperature of the solution was regulated to 60 °C (using a water bath). TMOS (3.57 mL) was added under continuous stirring. The solution was stirred at 60 °C for 24 h. Subsequently, the flask was put in an oven for hydrothermal treatment at 80 °C for another 24 h. Afterwards, the product was filtered, dried, and calcined in air at 500 °C for 6 h. This material is denoted as SBA-15-1.
Preparation of SBA-15/PNIPAAM Composites
End-tethered poly-N-isopropylacrylamide (PNIPAAM) was grafted inside the mesoporous silica matrix by first covalently attaching a monomer to an anchor grafted onto the pore surface and initiating polymerization using atom-transfer radical polymerization (ATRP).18 The number of possible grafting sites (i.e., silanol groups) for the anchor was increased by dispersing the original calcined SBA-15 (SBA-15-1) in an aqueous solution of HNO3. The slurry was then filtered, washed with water, and dried. This material is referred to as SBA-15-2.
Thereafter, the anchor, 1-(trichlorosilyl)-2-(m-/p-(chloromethylphenyl) ethane, was grafted onto the surface of SBA-15-2. First, SBA-15-2 was impregnated with anhydrous toluene (1.0 g of silica in 100 mL of toluene) and flushed with argon for several minutes to obtain a dry, water-free sample. After the toluene treatment, the anchor was added in large excess (1 mL of anchor for 1.0 g of silica) at room temperature. During the 48 h of reaction time, the mixture was stirred under an argon atmosphere. The product was filtered and subsequently washed with toluene, methanol, and acetone in order to remove excess ungrafted anchor molecules from the pores. The filtered material was dried for 2 h at 110 °C in an argon stream. This material is referred to as SBA-15-3.
For the surface-initiated polymerization of N-isopropylacryl-amide (NIPAAM) N,N-dimethylformamide (DMF, 150 mL) was added to SBA-15-3 in a round-bottomed flask that was then flushed with argon for several minutes. Thereafter, 2,2-bipyridine (bipy, 2.5 g) and CuCl (0.535 g) were added, followed by N-isopropylacrylamide (15.0 g). After 30 min of flushing with an argon flow, the flask was sealed and stirred at 30 °C for another 72 h. The product was cooled to room temperature, filtered, and washed with DMF, methanol, and water. Following this, it was dried for 2 h at 110 °C in an argon stream. This final material is denoted as SBA-15-4. Scheme 1 presents the stepwise modification process used to incorporate (by ATRP) PNIPAAM into SBA-15.
SAXD
The different materials (SBA-15-1 to SBA-15-4) were characterized by powder diffraction measurements performed with a Kratky camera equipped with a linear-position-sensitive detector containing 1024 channels of width 53.6 μm. Cu Kα radiation of wavelength 1.542 Å was supplied by a Seifert ID 2200 W X-ray tube operated at 55 kV and 40 mA. The measured raw data were normalized to the first-order peak (10) in order to compare the relative peak intensities of the higher-order Bragg peaks (i.e., (11) and (20)) directly.
Calorimetry
The products obtained by the different steps in the modification procedure (SBA-15-1 to SBA-15-4) were characterized by water sorption calorimetry performed at 25 °C in a two-chamber sorption calorimetric cell inserted into a double-twin microcalorimeter.43 Prior to the measurements, the samples were dried under high vacuum for two days and sample preparation (filling of the calorimetric cell) was performed in a glovebag in a dry nitrogen atmosphere. The mesoporous silica sample was inserted into the upper chamber, and Milli-Q water was injected into the lower chamber. During the sorption measurement, water evaporates from the lower chamber, diffuses through the tube connecting the two chambers, and is subsequently adsorbed by the sample in the upper chamber. The thermal power released in the two chambers is recorded simultaneously. The activity of water, aw (the partial pressure of water in the sample divided by the partial pressure of water over pure liquid water), was calculated from the thermal power of vaporization of water in the lower chamber as described previously.44
The partial molar enthalpy of the mixing of water was calculated using the following equation
| 1 |
where Pvap and Psorp are thermal powers registered in the vaporization and sorption chambers, respectively, and Hwvap is the molar enthalpy of evaporation of pure water. The enthalpy of mixing considered here, corresponds to the following reaction when liquid water is adsorbed by the silica material: H2O(l) → H2O(ads). To obtain an accurate calculation of the partial molar enthalpy of mixing of water, the sorption calorimeter was calibrated by using magnesium nitrate as a standard substance.45 The partial molar entropy of mixing of water was calculated from the enthalpy and the water activity data as follows
| 2 |
where T is the absolute temperature and R is the gas constant.
Nitrogen Sorption
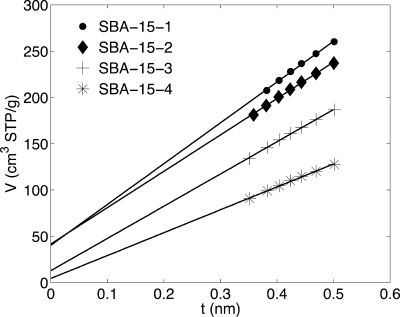
Nitrogen adsorption–desorption isotherms were measured at 77 K using a Micromeritics ASAP 2400. Prior to the measurements, the unmodified sample (SBA-15-1) was outgassed at 200 °C overnight, whereas the modified samples (SBA-15-2, SBA-15-3, and SBA-15-4) were outgassed at 80 °C overnight. The pore size distribution was obtained by applying the Barret–Joyner–Halenda method. For the determination of micropore volume in the presence of mesopores, the t-plot method using the de Boer46,47 equation was applied. In the plot, the adsorbed amount of gas n is plotted against t, the statistical thickness of an adsorbed film. The micropore volume is given by the intercept of the extrapolated t plot. In the case of a nonmicroporous material, the t-plot function crosses the origin of the plot.
Results and Discussion
SAXD
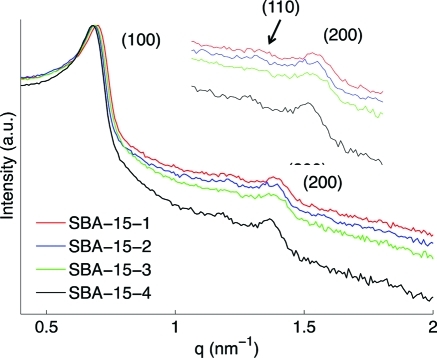
For all four materials (SBA-15-1 to SBA-15-4), the expected and well-defined structure of SBA-15 was observed (Figure 1). The SAXD patterns show three peaks, which can be indexed on the 2D hexagonal lattice (plane group p6m). The unit cell parameter (Table 1) is constant, 10.6 nm, for all samples. Clearly, the structure is maintained during the functionalization procedure. This demonstrates the advantage of using SBA-15 as a mesoporous host as compared to MCM-41 materials, for which the structure is modified during the grafting process.18,48 The treatment with acidic solution, which was done to increase the number of silanol groups on the surface, did not affect the periodic structure of the sample, which is in agreement with similar results by Rosenholm et al.34 The better stability of SBA-15 as compared to that of MCM-41 can be attributed to the thicker pore walls of SBA-15.34,49
Figure 1.
SAXD data of calcined SBA-15-1 (red), acid-treated SBA-15-2 (blue), SBA-15-3 with a grafted anchor (green), and SBA-15-4 with grafted PNIPAAM (black).
Table 1. Structural Data for SBA-15-1 to SBA-15-4 from N2 Sorption and SAXD.
| material | SBET(m2 g–1)a | Vp(cm3 g–1)b | BET Cc | dp (nm)d | a0 (nm)e |
|---|---|---|---|---|---|
| SBA-15-1 | 843 | 0.95 | 119 | 5.0 | 10.6 |
| SBA-15-2 | 766 | 0.88 | 160 | 5.0 | 10.6 |
| SBA-15-3 | 600 | 0.76 | 103 | 4.9 | 10.6 |
| SBA-15-4 | 411 | 0.56 (0.73) | 90 | 4.9 | 10.6 |
SBET, the BET specific surface area, is deduced from the isotherm analysis in the relative pressure range from 0.05 to 0.2.
Vp is the total pore volume.
BET C values were obtained in the relative pressure range from 0.05 to 0.2.
dp is taken from the BJH desorption pore size analysis.
Unit cell parameter a0 is calculated from the X-ray diffraction data.
Water Sorption
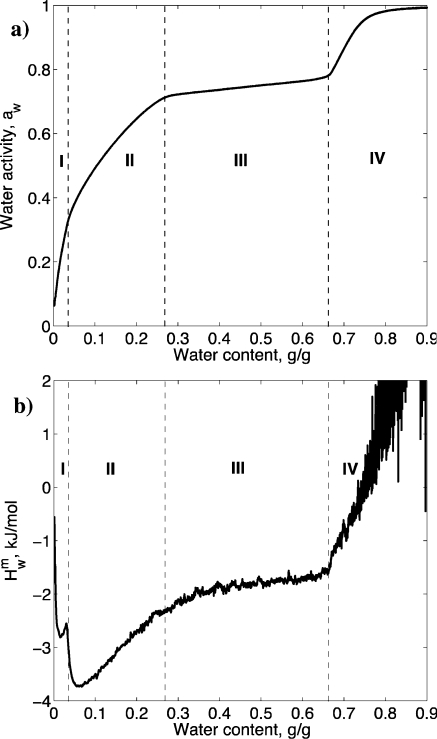
The water sorption isotherms and the corresponding enthalpy curve for SBA-15-1 are shown in Figure 2, and the derived parameters are summarized in Table 2. We present the isotherms as a function of water content (mass of water per mass of dry sample) to be consistent with previous water sorption results39,40 and to provide the possibility for easy comparison with the enthalpy data (Figure 2b). In the Supporting Information, the graphs are presented as a function of water activity for readers used to the typical representations of gas sorption isotherms. The water sorption isotherm of SBA-15-1 is divided into four distinct regimes, in agreement with earlier published results:40
Figure 2.
(a) Water sorption isotherm of calcined SBA-15-1 and the corresponding (b) enthalpy curve obtained from the water sorption isotherm showing the four regimes of water adsorption: (1) surface adsorption, (2) filling of intrawall pores, (3) capillary condensation in the primary mesopores, and (4) postcapillary condensation uptake of water.
Table 2. Regimes of Water Sorption for SBA-15-1 to SBA-15-4a.
| regime 1 | regime 2 | regime 3 | regime 4 | |
|---|---|---|---|---|
| conc range, hwg/g (Vi, cm3/g (SiO2)) | conc range, hwg/g (Vi, cm3/g (SiO2)) | conc range, hwg/g (Vi, cm3/g (SiO2)) | conc range, hwg/g (Vi, cm3/g (SiO2)) | |
| SBA-15-1 | 0.000–0.037(0.037) | 0.037–0.270 (0.233) | 0.270–0.665 (0.395) | 0.665–(−) |
| SBA-15-2 | 0.000–0.076 (0.076) | 0.076–0.289 (0.213) | 0.289–0.683 (0.394) | 0.683–(−) |
| SBA-15-3 | 0.000–0.058 (0.058) | 0.058–0.199 (0.141) | 0.199–0.565 (0.366) | 0.565–(−) |
| SBA-15-4 | 0.000–0.130 (0.130) | (−) | 0.130–0.432 (0.302) | 0.432–(−) |
| main processes | adsorption in micropores and mesopores | filling of intrawall pores, adsorption in mesopores | capillary condensation in mesopores | further uptake of water |
For simplicity, the density of liquid water was assumed to be 1.0 cm3/g.
regime 1 - surface adsorption;
regime 2 - filling of intrawall pores;
regime 3 - capillary condensation in the primary mesopores; and
regime 4 - postcapillary condensation uptake of water.
These regimes are identified in the water sorption isotherms for SBA-15-1 (Figure 2), where the starting and ending points for every regime are recognized by a change in the slope of the isotherm. This also demonstrates the strength of using water sorption calorimetry to probe the porosity of SBA-15 because it directly indicates the presence of the intrawall pores that are a typical attribute of SBA-15.40 The enthalpy curve shown in Figure 2b can be divided into these four regimes as well. A more detailed analysis of the data will be discussed separately for samples SBA-15-1 to SBA-15-4 further below.
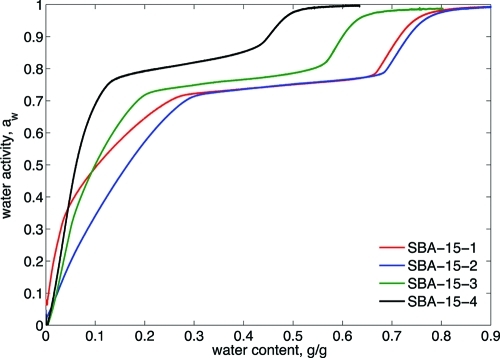
Figure 3 shows the water sorption isotherms for SBA-15-1 to SBA-15-4, and the derived parameters are summarized in Table 2. The water sorption isotherms are clearly distinct for each material, demonstrating that water sorption calorimetry is an effective technique for monitoring changes imposed on the material during a functionalization process. Below are detailed descriptions of the results, isotherms, and enthalpy data obtained for each of the respective materials.
Figure 3.
Water sorption isotherms of calcined SBA-15-1 (red), acid-treated SBA-15-2 (blue), SBA-15-3 with a grafted anchor (green), and SBA-15-4 with grafted PNIPAAM (black).
SBA-15-1
Regime 1 (up to 0.037 g of water/g of silica, see Table 2) is characterized by the adsorption of water molecules to the silica surface. At low water content, the dominant process is water physisorbing to the hydroxyl groups on the silica surface. Subsequently, the filling of intrawall pores (large micropores and mesopores) with water sets in at a water content of 0.037 g/g of silica. This is the main process in regime 2. The capillary condensation in the mesopores (regime 3) starts at a water content of about 0.270 g of water/g of silica, which is comparable to earlier published values.40 The water activity curve levels off at the onset of capillary condensation in mesopores, reflecting the narrow pore size distribution of the mesopores. Finally, after capillary condensation in mesopores, a further uptake of water by the sample is observed at high pressures (water content of 0.665 g/g of silica).
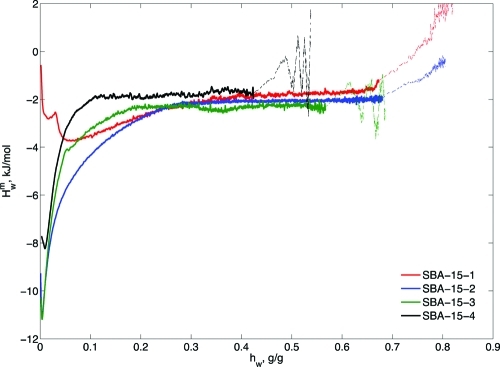
The enthalpy effect of water sorption in SBA-15-1 is relatively small at low water content but negative (Figure 4). The negative value reflects the exothermic effect expected as water adsorbs to highly polar silanol groups on the surfaces of the silica pores. Initially, the value decreases with increasing water content before it reached a local maximum at around 0.035 g of water/g of silica just prior to the filling of the intrawall pores. Thereafter, it levels off and reaches a constant value in the regime of capillary condensation in the primary mesopores (hw > 0.27, regime 3).
Figure 4.
Enthalpy curves obtained from water sorption isotherms of calcined SBA-15-1 (red), acid-treated SBA-15-2 (blue), SBA-15-3 with a grafted anchor (green), and SBA-15-4 with grafted PNIPAAM (black). Please note that for presentation reasons at higher water contents a larger filter factor was used.
SBA-15-2
The first regime in the water sorption isotherm of SBA-15-2 (Figure 3) is prolonged compared to that of SBA-15-1, up to a water content of 0.076 g/g of silica. This observation will be discussed further below. Also, the starting point of the capillary condensation in the mesopores (regime 3) is shifted to a slightly higher water content, namely 0.289 g of water/g of silica. The rather unexpected observation that capillary condensation takes place at the same water activity as for SBA-15-1 leads us to the conclusion that an increase in the number of silanol groups has mainly occurred in the intrawall pores. The SBA-15 material used here has a comparatively high intrawall porosity.27 A possible explanation of the above-mentioned phenomenon is based on the wetting abilities of the calcined SBA-15 material. Earlier published results39,40 show that upon immersing silica into liquid water the formation of air pockets can be observed. In our case, when impregnating the pores of SBA-15-1 with an acidic aqueous solution, which does not necessarily occur under equilibrium conditions, air pockets may be formed in the main mesopores, hence a fraction of the surface will not be hydroxylated. However, the vapor pressure of the acidic solution is sufficiently high that capillary condensation can occur in the smaller pores even if they are not initially filled with aqueous solution, thus facilitating the hydroxylation of the surface in the intrawall pores. The enthalpy curve for SBA-15-2 (Figure 4) has dramatically changed as compared to that of SBA-15-1. The enthalpy at low water content is much more negative than in SBA-15-1, with −11 kJ mol–1 compared to −2.5 kJ mol–1. To understand this phenomenon, one has to recall that approximately 84% of the silica surface is hydrophobic for calcined silica39 (SBA-15-1) with a large portion of siloxane bonds. The adsorption of water molecules on such a surface leads to the disruption of hydrogen bonds (compared to those in the bulk), but at the same time a new similar type of bond is formed with surface hydroxyl groups by the adsorption. The total heat effect will be weakly exothermic for surfaces with a low coverage of hydroxyl groups (and a high portion of siloxane bonds). Hence, the increase in the number of silanol groups on the surface, as a consequence of the acid treatment (i.e., SBA-15-2), renders the SBA-15 surface more hydrophilic. This facilitates the adsorption of water molecules and therefore results in a larger exothermic effect than that observed for SBA-15-1. Furthermore, this also explains the shift at the end of the first regime to higher water content for SBA-15-2 compared to that for SBA-15-1 as mentioned previously. The adsorbed water molecules can be more closely packed onto the more hydrophilic surface. The material is therefore able to adsorb more water before entering the second regime of filling the intrawall pores. This consequently contributes to the shift to higher water content for the onset of capillary condensation in the main mesopores.
SBA-15-3
The sorption isotherm for SBA-15-3 (the material with a grafted anchor) is also partitioned into four distinguishable regimes, but the regimes are clearly shifted in terms of water content compared to that for SBA-15-1 and SBA-15-2 (Figure 3). In particular, the second regime (filling of the intrawall pores) is shifted (starts at a lower water content of 0.076 g of water/g of silica) and decreased in the total water content taken up (0.141 g of water/g of silica). This amount corresponds to 60% of the observed uptake for SBA-15-1 (0.233 g water/g of silica) in the same regime, demonstrating the lower water uptake ability. This change is accompanied by an earlier onset of capillary condensation inside the mesopores (regime 3) at a water content of 0.199 g of water/g of silica, reflecting the filling of the mesopores at a lower water content as a result of the reduction of the intrawall pore volume due to the presence of the attached anchor molecules. The capillary condensation regime (regime 3) ends at a water content of 0.565 g of water/g of silica.
The enthalpy curve for SBA-15-3 (Figure 4) is very similar at low water content to the enthalpy curve obtained for SBA-15-2. First it goes through a minimum at around 0.2 g of water/g of silica and then increases constantly until it finally levels off at the point where the capillary condensation in the primary mesopores starts. The minimum value of the enthalpy with −11 kJ mol–1 is reasonable and is comparable to SBA-15-2, which reflects the heat released as water molecules attach to silanol groups. It should be noted that this argument holds even if the anchor is covalently linked to the surface silanol groups, thereby decreasing the number of these groups, where the oxygen of the surface silanol groups that links to the anchor molecules still has a free electron pair that is able to form bonds with water molecules. The anchor is a relatively small molecule and will not significantly shield the connecting oxygen atoms from the adsorbing water molecules.
SBA-15-4
Finally, in the case of SBA-15-4, the material with grafted PNIPAAM, the most striking difference is that the regime of filling the intrawall pores has nearly vanished (regime 2). The isotherm (Figure 3) exhibits only three pronounced regimes: adsorption of water molecules at the surface (regime 1), capillary condensation (regime 3), and postcapillary condensation uptake of water (regime 4). This behavior is similar to water sorption calorimetric measurements of MCM-41, which is characterized by only three regimes because the material does not have intrawall pores.26 The onset of the capillary condensation in the mesopores for SBA-15-4 is shifted even further to a smaller amount of water (0.130 g of water/g of silica) and additionally to higher water activity. The increase in activity reflects increased hydrophobicity as a consequence of the presence of PNIPAAM. The second regime, associated with the filling of the intrawall pores, has, as just mentioned, disappeared. The intrawall pores are thus not detected after the incorporation of the polymer, and hence this pore volume is no longer accessible. This indicates the preferential location of the PNIPAAM polymer in the intrawall pores or at the entrance of the pores, sealing them off. This finding is in accordance with previous N2- and Ar-sorption results.41 The enthalpy curve (Figure 4) for SBA-15-4 exhibits a minimum at low water content, −8 kJ mol–1, and therefore the value is smaller than for SBA-15-2 and SBA-15-3. This agrees with the argument of fewer accessible silanol groups. (The groups located in the intrawall pores are no longer accessible to the water molecules.) Subsequently, the exothermic effect decreases until it reaches a constant level when the capillary condensation in the main mesopores begins. This constant level has a slightly higher absolute value than for the other three samples (SBA-15-1, SBA-15-2, and SBA-15-3). Generally, when the regime of capillary condensation in the main mesopores is reached, the main enthalpy contribution arises from water–water interactions, independently of the molecules on the surface of the pores. For SBA-15-4, however, this situation is more complicated. During the water sorption measurements, PNIPAAM is getting hydrated as it simultaneously changes its conformation from being collapsed toward an elongated state in which it most likely stretches toward the center of the pores. The backbone of the polymer chain is built up by polyethylene, which is rather hydrophobic. Consequently, a second contribution to the overall heat effect emerges, namely, the interaction between water molecules and polymer chains. This is noticed in the slightly less negative value of the enthalpy for the PNIPAAM-containing sample as compared to that of the others.
N2 Sorption
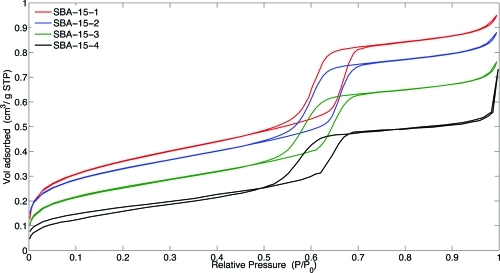
Figure 5 shows the nitrogen sorption isotherms for SBA-15-1 to SBA-15-4 displaying distinct type IV isotherms exhibiting marked H2 adsorption–desorption hysteresis (IUPAC classification50) typical of this class of material. Table 1 gives an overview of the structural data deduced from nitrogen sorption data. The BET surface area for SBA-15-1 is 843 m2 g–1, and this area is decreased after each modification step to 766 m2 g–1 for SBA-15-2, 600 m2 g–1 for SBA-15-3, and 411 m2 g–1 for SBA-15-4. Similar results were observed in another recent study.41 The total pore volume (obtained from the BJH pore size distribution for the desorption branch, see Table 1) follows the same trend. SBA-15-1 exhibits a pore volume of 0.95 cm3 g–1, and this value decreases after each step of the modification procedure. SBA-15-4 has a total pore volume of 0.56 cm3 g–1 corresponding to approximately 59% of the original total pore volume of SBA-15-1. This value is in good agreement with the results from the water sorption measurements, which show that the pore volume of SBA-15-4 corresponds to approximately 65% of the original volume of SBA-15-1. The values for the pore volume are taken at the end of the capillary condensation regime, explaining the lower total pore volume compared to the results obtained by nitrogen sorption measurements. Furthermore, several publications, including simulations, have shown the formation of small cavities, which are not filled with water because of hydrophobic patches of the material. This results in smaller total pore volumes because of the more hydrophobic surfaces.39,40,51
Figure 5.
Nitrogen sorption isotherms of calcined SBA-15-1 (red), acid-treated SBA-15-2 (blue), SBA-15-3 with a grafted anchor (green), and SBA-15-4 with grafted PNIPAAM (black).
The grafting of PNIPAAM to SBA-15 slightly increases the width of the adsorption–desorption hysteresis and makes the step less steep (Figure 5). This is an indication of the presence of more corrugated cylindrical pores.
Table 1 shows the BET C values for SBA-15-1 to SBA-15-4. The BET C values allow some conclusions to be drawn about the strength of the adsorbate–adsorbent interaction because higher values usually correspond to a more hydrophilic surface. Nevertheless, this number cannot be seen as a valid absolute quantification because it has been shown that the microporosity also has a substantial impact on the BET C value.52,53 However, the change in the BET C values with the progressing modification step is in agreement with the water sorption data and is consistent with the changes in surface properties. The oxidative acid treatment (hydroxylation) leads to an increase in the BET C value from 119 for SBA-15-1 to 160 for SBA-15-2, whereas the BET C values decreases to 103 after the anchor grafting and reaches a value of 90 for SBA-15-4. These values are in agreement with earlier published results,34 even though the value for SBA-15-1 is slightly lower compared to our previous detailed investigation using nitrogen and argon sorption. Nevertheless, 119, obtained for SBA-15-1, is a typical value for mesoporous silica.34
Pore Size Distributions
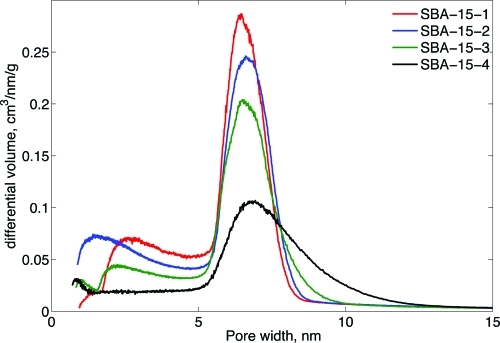
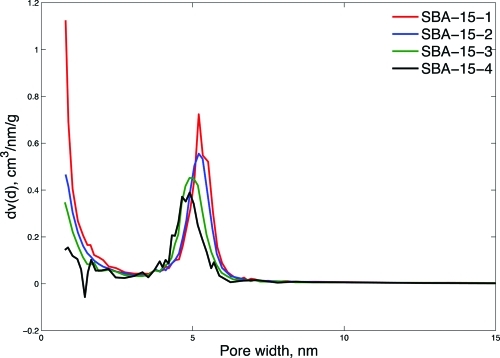
The water sorption isotherms shown in Figure 3 were used to calculate the pore size distributions for all four materials, SBA-15-1 to SBA-15-4, by using the BJH method according to an earlier published procedure and are presented in Figure 6.40,54 Pore size distributions from nitrogen sorption measurements (Figure 7) were also determined and compared to the pore size distributions obtained from the water sorption isotherms.
Figure 6.
BJH pore size distribution obtained from water sorption isotherms of calcined SBA-15-1 (red), acid-treated SBA-15-2 (blue), SBA-15-3 with a grafted anchor (green), and SBA-15-4 with grafted PNIPAAM (black).
Figure 7.
Nitrogen BJH pore size distribution obtained from the desorption branch of calcined SBA-15-1 (red), acid-treated SBA-15-2 (blue), SBA-15-3 with a grafted anchor (green), and SBA-15-4 with grafted PNIPAAM (black).
Figure 6 shows the pore size distribution obtained from the analysis of the water sorption data. All four pore size distributions exhibit a peak at around 6 nm, and no clear decrease in the pore size of the main mesopores is observed for SBA-15-3 and SBA-15-4, in accordance with previous studies.41 It has to be noted that, especially for SBA-15-4, the contact angle of water used to calculate the pore size distribution is difficult to estimate exactly for the given system. Therefore, we assumed a water contact angle of 46°, which is an average between a freshly calcined silica surface of SBA-15 (34°)39,40 and a PNIPAAM-covered surface (approximately 58° for hydrophilic fully extended PNIPAAM chains55). For SBA-15-1 and SBA-15-2, we chose a water contact angle of 28°, which corresponds to a silica surface that is not fully hydrated, with isotherms that show that the material is more hydrophobic than a fully hydrated silica as, for example, in earlier publications by Kocherbitov et al.39 We chose for the slightly more hydrophobic SBA-15-3 a value of 34° as the water contact angle, which was then consequently used for the approximation of the water contact angle of SBA-15-439 The volume of pores that are smaller than the main mesopores clearly decreased for SBA-15-3, reflecting the grafting of the anchor in the intrawall pores. A further reduction is observed for SBA-15-4, which is in very good agreement with the fact that regime 2 (filling of intrawall pores) in the water sorption isotherm is absent. When comparing the pore size distribution calculated from the water sorption isotherms and from the desorption branch of nitrogen sorption, several differences are obvious. The maximum peaks from the nitrogen desorption branch are found at slightly smaller values, around 5 nm (Figure 7). The value was calculated on the basis of a classical model for nitrogen sorption to obtain pore size distributions. Usually, these pore size calculations underestimate the pore size by up to 25%.56 Furthermore, it has been shown before that the pore size distributions calculated from the water sorption isotherm and the pore size distributions calculated using the NLDFT method (desorption branch) are in agreement. Hence, the water sorption results reveal an accurate estimation of the pore size.
Figure 8 shows the t plot obtained from the nitrogen sorption measurements in the region from t = 0.35 to 0.5 nm. The intercept of the fitted t plot reflects the amount of microporosity present in the material. The value of the intercept is much lower for SBA-15-3 and SBA-15-4 than for the other two materials. For SBA-15-4, the line almost passes through the origin, reflecting the fact that PNIPAAM is located in (or in the vicinity of) the micropores.57 The results from the t plot and the pore size distribution calculated from the water sorption isotherms agree very well, with both showing a decrease in microporosity/intrawall porosity. This demonstrates the accuracy of the pore size distribution calculated from water sorption isotherms.
Figure 8.
Nitrogen t plot from 0.35 to 0.5 nm for calcined SBA-15-1 (●), acid-treated SBA-15-2 (⧫), SBA-15-3 with a grafted anchor (+), and SBA-15-4 with grafted PNIPAAM (*). At each step in the modification process, the intercept of the t plot is decreasing, reflecting the decrease in microporosity/intrawall porosity.
Conclusion
We demonstrate that water sorption calorimetry contributes to a more comprehensive and complete picture of the porosity and surface properties of functionalized porous materials such as SBA-15 with grafted PNIPAAM. The changes in porosity and surface properties for the materials obtained along the functionalization process were probed.
By performing water sorption measurements, the surface properties of the pore walls in terms of hydrophobicity and hydrophilicity were monitored after each step in the functionalization process. The water sorption measurements were also compared with nitrogen sorption studies, and SAXD was used to monitor the structural properties.
For original SBA-15 silica, the water sorption isotherms clearly show the presence of intrawall pores displayed as an additional regime between the surface adsorption of water (regime 1) and the capillary condensation in the main mesopores (regime 3). In the case of SBA-15-2, it should be noticed that the increasing number of silanol groups is mainly located in the intrawall pores and the main mesopores remained mostly unchanged. Upon introducing the anchor (SBA-15-3), capillary condensation in the mesopores appeared at a slightly higher water activity, reflecting increased hydrophobicity, as well as at a lower water content compared to that of the original material. This clearly demonstrates the decrease in pore volume of micropores/intrawall pores. The second regime, related to the intrawall porosity, was less pronounced and is in accordance with results obtained from the nitrogen sorption measurements. It also confirms the observation that the increase in the number of silanol groups has mainly taken place in the intrawall pores because they function as the grafting point for the anchor. The location of the anchor determines the starting point of the polymerization of NIPAAM. Finally, the resulting SBA-15-PNIPAAM (SBA-15-4) material has the most hydrophobic character of all four materials, and the second regime, characteristic of the presence of intrawall pores, is no longer present.
Water sorption provides chemical information about the pore surface, which is not attainable by the classical gas sorption typically used for the characterization of mesoporous materials. Furthermore, the pore size distributions from the water sorption data are in good agreement with the nitrogen sorption analysis. Hence, we have demonstrated the ability of water sorption as an advantageous tool in understanding the surface properties of mesoporous silica while providing information on the porosity of the material. Water sorption calorimetry could thus be utilized to provide crucial information to evaluate specific interactions between drugs and functional groups attached to a mesoporous host and hence to obtain valuable information regarding the monitoring of drug release profiles.
Acknowledgments
Financial support by the Swedish Research Council (VR) through the Linnaeus grant Organizing Molecular Matter (OMM; N.V.R. and V.A.), the Center of Excellence (239-2009-6794), the Swedish Foundation for Strategic Research, through project grants (80475801, V.A.), the Danish National Research Foundation through the MEMPHYS Center of Excellence for Membrane Biophysics (B.K.), Marie-Curie Research Training Network BIOCONTROL (MRTN-CT-2006 033439; V.A., N.V.R., B.K., and T.N.), and the Swedish Foundation for Strategic Research (RMA08-0056; V.A., N.V.R., and T.N.) is gratefully acknowledged.
Supporting Information Available
Water sorption isotherms presented as a function of water activity. This material is available free of charge via the Internet at http://pubs.acs.org.
Supplementary Material
References
- Kalbasi R. J.; Kolahdoozan M.; Rezaei M. Mater. Chem. Phys. 2011, 125, 784–790. [Google Scholar]
- Choi M.; Kleitz F.; Liu D.; Lee H. Y.; Ahn W.; Ryoo R. J. Am. Chem. Soc. 2005, 127, 1924–1932. [DOI] [PubMed] [Google Scholar]
- Rosenholm J. M.; Sahlgren C.; Lindén M. Nanoscale 2010, 2, 1870–1883. [DOI] [PubMed] [Google Scholar]
- Wight A. P.; Davis M. E. Chem. Rev. 2002, 102, 3589–3614. [DOI] [PubMed] [Google Scholar]
- Zou H.; Wu S.; Shen J. Chem. Rev. 2008, 108, 3893–3957. [DOI] [PubMed] [Google Scholar]
- Wu Z.; Zhao D. Chem. Commun. 2011, 47, 3332–3338. [DOI] [PubMed] [Google Scholar]
- Kumar P.; Guliants V. V. Microporous Mesoporous Mater. 2010, 132, 1–14. [Google Scholar]
- Athens G. L.; Shayib R. M.; Chmelka B. F. Curr. Opin. Colloid Interface Sci. 2009, 14, 281–292. [Google Scholar]
- Kresge C. T.; Leonowicz M. E.; Roth W. J.; Vartuli J. C.; Beck J. S. Nature 1992, 359, 710–712. [Google Scholar]
- Zhao D.; Huo Q.; Feng J.; Chmelka B. F.; Stucky G. D. J. Am. Chem. Soc. 1998, 120, 6024–6036. [Google Scholar]
- Luan Z.; Fournier J. A.; Wooten J. B.; Miser D. E. Microporous Mesoporous Mater. 2005, 83, 150–158. [Google Scholar]
- Wei L.; Hu N.; Zhang Y. Materials 2010, 3, 4066–4079. [DOI] [PMC free article] [PubMed] [Google Scholar]
- Moller K.; Bein T.; Fischer R. X. Chem. Mater. 1999, 11, 665–673. [Google Scholar]
- Sasidharan M.; Mal N. K.; Bhaumik A. J. Mater. Chem. 2007, 17, 278–283. [Google Scholar]
- Stein A.; Melde B. J.; Schroden R. C. Adv. Mater. 2000, 12, 1403–1419. [Google Scholar]
- Huang L.; Dolai S.; Raja K.; Kruk M. Langmuir 2009, 26, 2688–2693. [DOI] [PubMed] [Google Scholar]
- Kruk M.; Dufour B.; Celer E. B.; Kowalewski T.; Jaroniec M.; Matyjaszewski K. Macromolecules 2008, 41, 8584–8591. [Google Scholar]
- Fu Q.; Rao G. V. R.; Ista L. K.; Wu Y.; Andrzejewski B. P.; Sklar L. A.; Ward T. L.; López G. P. Adv. Mater. 2003, 15, 1262–1266. [Google Scholar]
- Tian B.-S.; Yang C. J. Phys. Chem. C 2009, 113, 4925–4931. [Google Scholar]
- Yim H.; Kent M. S.; Huber D. L.; Satija S.; Majewski J.; Smith G. S. Macromolecules 2003, 36, 5244–5251. [Google Scholar]
- Zhang J.; Nylander T.; Campbell R. A.; Rennie A. R.; Zauscher S.; Linse P. Soft Matter 2008, 4, 500–509. [DOI] [PubMed] [Google Scholar]
- Zhou Z.; Zhu S.; Zhang D. J. Mater. Chem. 2007, 17, 2428–2433. [Google Scholar]
- Wang X.; Liu P.; Tian Y. J. Solid State Chem. 2011, 184, 1571–1575. [Google Scholar]
- Kruk M.; Jaroniec M.; Ko C. H.; Ryoo R. Chem. Mater. 2000, 12, 1961–1968. [Google Scholar]
- Ryoo R.; Ko C. H.; Kruk M.; Antochshuk V.; Jaroniec M. J. Phys. Chem. B 2000, 104, 11465–11471. [Google Scholar]
- Galarneau A.; Cambon H.; Martin T.; Mènorval L.-C. D.; Brunel D.; Renzo F. D.; Fajula F. In Nanoporous Materials III : Proceedings of the 3rd International Symposium on Nanoporous Materials; Sayari A., Jaroniec M., Eds.; Studies in Surface Science and Catalysis; Elsevier: Amsterdam, 2002; Vol. 141, pp 395–402. [Google Scholar]
- Reichhardt N.; Kjellman T.; Sakeye M.; Paulsen F.; Smått J.-H.; Lindén M.; Alfredsson V. Chem. Mater. 2011, 23, 3400–3403. [Google Scholar]
- Medved I.; Černý R. Microporous Mesoporous Mater. 2011, 142, 405–422. [Google Scholar]
- Krishna R. J. Phys. Chem. C 2009, 113, 19756–19781. [Google Scholar]
- Thommes M. Chem. Ing. Tech. 2010, 82, 1059–1073. [Google Scholar]
- Thommes M.; Smarsly B.; Groenewolt M.; Ravikovitch P. I.; Neimark A. V. Langmuir 2005, 22, 756–764. [DOI] [PubMed] [Google Scholar]
- Ravikovitch P. I.; Neimark A. V. Colloids Surf., A 2001, 187–188, 11–21. [Google Scholar]
- Guillet-Nicolas R.; Marcoux L.; Kleitz F. New J. Chem. 2010, 34, 355–366. [Google Scholar]
- Rosenholm J. M.; Lindén M. Chem. Mater. 2007, 19, 5023–5034. [Google Scholar]
- Hartmann M. Chem. Mater. 2005, 17, 4577–4593. [Google Scholar]
- Salis A.; Casula M. F.; Bhattacharyya M. S.; Pinna M.; Solinas V.; Monduzzi M. ChemCatChem 2010, 2, 322–329. [Google Scholar]
- Song S. W.; Hidajat K.; Kawi S. Langmuir 2005, 21, 9568–9575. [DOI] [PubMed] [Google Scholar]
- Grünberg B.; Emmler T.; Gedat E.; Shenderovich I.; Findenegg G. H.; Limbach H.-H.; Buntkowsky G. Chem.—Eur. J. 2004, 10, 5689–5696. [DOI] [PubMed] [Google Scholar]
- Kocherbitov V.; Alfredsson V. J. Phys. Chem. C 2007, 111, 12906–12913. [Google Scholar]
- Kocherbitov V.; Alfredsson V. Langmuir 2011, 27, 3889–3897. [DOI] [PubMed] [Google Scholar]
- Manuscript in preperation.
- Linton P.; Alfredsson V. Chem. Mater. 2008, 20, 2878–2880. [Google Scholar]
- Wadsö L.; Markova N. Rev. Sci. Instrum. 2002, 73, 2743–2754. [Google Scholar]
- Kocherbitov V. Thermochim. Acta 2004, 414, 43–45. [Google Scholar]
- Kocherbitov V. Thermochim. Acta 2004, 421, 105–110. [Google Scholar]
- Lippens B. C.; de Boer J. H. J. Catal. 1965, 4, 319–323. [Google Scholar]
- de Boer J. H.; Linsen B. G.; van der Plas T.; Zondervan G. J. J. Catal. 1965, 4, 649–653. [Google Scholar]
- Kumar D.; Schumacher K.; du Fresne von Hohenesche C.; Grün M.; Unger K. K. Colloids Surf., A 2001, 187–188, 109–116. [Google Scholar]
- Mokaya R. J. Phys. Chem. B 1999, 103, 10204–10208. [Google Scholar]
- Sing K. S. W.; Everett D. H.; Haul R. A. W.; Moscou L.; Pierotti R. A.; Rouquérol J.; Siemieniewska T. Pure Appl. Chem. 1985, 57, 603–619. [Google Scholar]
- Kocherbitov V. J. Phys. Chem. C 2008, 112, 16893–16897. [Google Scholar]
- Witte B.; Vercruysse K.; Aernouts K.; Verwimp P.; Uytterhoeven J. B. J. Porous Mater. 1995, 2, 307–313. [Google Scholar]
- Basaldella E.; Tara J.; Armenta G.; Patiño-Iglesias M.; Castellón E. J. Sol-Gel Sci. Technol. 2006, 37, 141–146. [Google Scholar]
- Barrett E. P.; Joyner L. G.; Halenda P. P. J. Am. Chem. Soc. 1951, 73, 373–380. [Google Scholar]
- Fu Q.; Rama Rao G. V.; Ward T. L.; Lu Y.; Lopez G. P. Langmuir 2006, 23, 170–174. [DOI] [PubMed] [Google Scholar]
- Thommes M.Nanoporous Materials: Science and Engineering; Lu G. Q., Zhao X. S., Eds.; Imperial College Press: London, 2004; pp 317–364and references therein. [Google Scholar]
- Galarneau A.; Cambon H.; Di Renzo F.; Ryoo R.; Choi M.; Fajula F. New J. Chem. 2003, 27, 73–79. [Google Scholar]
Associated Data
This section collects any data citations, data availability statements, or supplementary materials included in this article.


