Abstract
Intramolecular chain diffusion is an elementary process in the conformational fluctuations of the DNA hairpin-loop. We have studied the temperature and viscosity dependence of a model DNA hairpin-loop by FRET (fluorescence resonance energy transfer) fluctuation spectroscopy (FRETfs). Apparent thermodynamic parameters were obtained by analyzing the correlation amplitude through a two-state model and are consistent with steady-state fluorescence measurements. The kinetics of closing the loop show non-Arrhenius behavior, in agreement with theoretical prediction and other experimental measurements on peptide folding. The fluctuation rates show a fractional power dependence (β = 0.83) on the solution viscosity. A much slower intrachain diffusion coefficient in comparison to that of polypeptides was derived based on the first passage time theory of SSS [Szabo, A., Schulten, K. & Schulten, Z. (1980) J. Chem. Phys. 72, 4350–4357], suggesting that intrachain interactions, especially stacking interaction in the loop, might increase the roughness of the free energy surface of the DNA hairpin-loop.
Intramolecular chain diffusion is an elementary process in the folding of proteins and nucleic acids. Characterization of the nature and time scale of this process is essential to our understanding of biopolymer dynamics. One step toward realizing this goal is the development of techniques capable of accurately measuring the rate of intramolecular end-to-end contact formation. Recent examples of such techniques include the method of Bieri et al. (1), as well as that of Lapidus et al. (2), where intramolecular contact formation in polypeptides was measured by triplet–triplet energy transfer. Fluorescence resonance energy transfer (FRET) offers another opportunity to measure the rate of intramolecular diffusion. With FRET, the end-to-end chain diffusion can be monitored over a range of ≈2–10 nm. The first example was demonstrated by Hass et al. (3) two decades ago, and recently this technique was implemented by Lakowicz and coworkers (4), who used a long-lifetime rhenium metal-ligand complex.
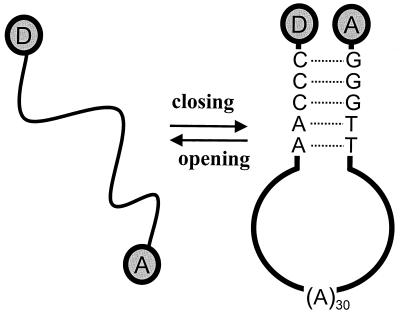
DNA hairpin-loop structures fluctuate between different conformations and are generally classified as open or closed (as shown in Fig. 1). They are involved in various biological functions, including gene expression and regulation (5, 6), and more recently they have found use as DNA biosensors (e.g., molecular beacons) (7, 8).
Figure 1.
Schematic of the conformational fluctuations of a donor (TMR) and acceptor (Cy5) labeled DNA hairpin-loop. The molecule is designed to fluctuate between open and closed states in solution at ambient temperature.
The open-to-closed transition provides a simple case with which to study the dynamics of intramolecular chain diffusion. Bonnet et al. (9) have recently used a combination of fluorescence quenching and fluorescence correlation spectroscopy (FCS) to examine the rate of conformational fluctuations in DNA hairpin-loops. Their experimental data supports a simple model of an all-or-none transition between open and closed states.
Continuing this theme, we developed a method for detecting biopolymer conformational dynamics based on the fluctuations in proximity ratio from FRET (10). By attaching donor and acceptor fluorophores to both ends of a DNA hairpin, the open-to-closed conformational dynamics of the system can be detected at ultra-high sensitivity down to the single-molecule level. By constructing the autocorrelation function of the proximity ratio rather than of the fluorescence intensity, we simplify the extraction of intramolecular kinetics from the correlation function. The use of the ratiometric method should result in a correlation function independent of molecular diffusion (10). This new approach enables us to observe stretched exponential kinetics for the conformational fluctuation in a DNA hairpin-loop system (10). A multiple-pathway, two-state model was proposed and used to simulate experimental single-molecule proximity ratio distributions (11).
In our previous studies, we concentrated on the time scale of the observed fluctuation and did not fully exploit the amplitude of the autocorrelation function. Here, we report the investigation of temperature and viscosity dependence for the conformational fluctuation of a DNA hairpin-loop. We show that the correlation amplitude is directly related to the equilibrium constant of the open-to-closed transition. By using a two-state model we are able to recover the apparent thermodynamic and kinetic parameters for the hairpin-loop conformational fluctuations under different buffer conditions. The kinetics for the open-to-closed transition of the hairpin-loop appear to show non-Arrhenius behavior akin to that found in peptide β-hairpins (12).
Materials and Methods
A 40-base oligonucleotide 5′-GGGTT-(A)30-AACCC-3′ was chosen as our model DNA hairpin-loop. Donor fluorophore carboxytetramethylrhodamine (TMR) is attached at its 3′ end via a modified cytosine and a six-carbon linker. Acceptor fluorophore indodicarbocyanine (Cy5) is attached at its 5′ end via a three-carbon linker. The donor and acceptor form a fluorescence resonance energy transfer pair with a FRET distance (R0) of ≈5.3 nm. Both dual-labeled and singly (TMR) labeled oligonucleotides were purchased from Operon Technologies (Alameda, CA) and were HPLC purified. The structure of the fully closed hairpin-loop is illustrated in Fig. 1.
The viscosity was varied by adding up to 55% (in mass) of glycerol (molecular biology reagent from Sigma) to the aqueous solution. The precise viscosity of the mixture was calculated by using a polynomial fit to the tabulated viscosity of water/glycerol mixture at 20°C (13). The minor effect of buffer and salt concentration on the viscosity was neglected.
Steady-state fluorescence experiments were carried on an Aminco-Bowman Series 2 Luminescence Spectrometer. At each temperature point, the sample was allowed to equilibrate for 10 min before measurement. TMR fluorescence intensity was integrated from 550–610 nm. Melting of the hairpin-loop was measured by normalization of TMR fluorescence of the FRET labeled sample to the singly (TMR) labeled sample at the same concentration.
FRET fluctuation experiments were performed on a home-built two-channel confocal fluorescence microscope using argon ion laser (514.5 nm) excitation. The details of this apparatus can be found elsewhere (14). Four-milliliter 10 nM samples were placed in a glass dish (WillCo Wells B.V., Amsterdam) and the temperature was controlled by a PE60 thermostage (Linkam Scientific Instruments, Surrey, U.K.). The temperature was monitored by using a thermocouple placed close to the laser focus (≈1 mm), and regulated better than ±0.2°C. To conduct the viscosity dependence experiment, 1-ml samples were placed into a glass chamber (Nalge Nunc, Naperville, IL) and the temperature controlled to 20 ± 0.1°C.
Results and Discussion
Temperature Dependence of the Fluctuation Amplitude.
Samples in three different solvent conditions [(i) MiliQ water, (ii) 10 mM Tris⋅HCl (pH 7.5), 1 mM EDTA, 100 mM NaCl, and (iii) 10 mM Tris⋅HCl (pH 7.5), 20 mM MgCl2] were investigated. We define proximity ratio P = IA/(ID + IA), where IA and ID are the acceptor and donor fluorescence intensity, respectively. The autocorrelation function of proximity ratio GP(t) was fit to a stretched exponential (10),
 |
1 |
where τ corresponds to the effective relaxation time associated with the correlated motion, and β is a stretch parameter.
The mean relaxation time 〈τ〉 can be related to τ and β by
 |
2 |
where Γ (β−1) is a gamma function.
The stretched exponential in Eq. 1 is only a phenomenological description of the kinetics and is not sufficient to determine a particular mechanism for the conformational fluctuation. Both inhomogeneous and homogeneous kinetics can lead to such nonexponential time dependence (15). However, nonexponential kinetics may be an indication of reduced effective diffusion coefficient as loop closure proceeds via rough energy landscape (16).
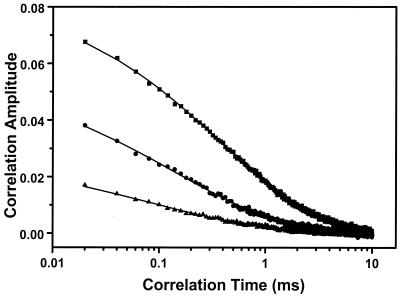
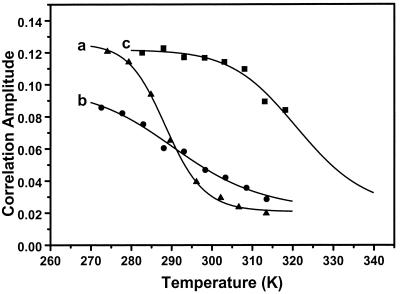
Fig. 2 shows correlation curves at different temperatures for a 10 nM sample of hairpin in buffer (10 mM Tris/1 mM EDTA (pH 7.5), 100 mM NaCl). Fig. 3 shows the temperature dependence of the correlation amplitude under three different conditions. It was found that the temperature dependence of the correlation amplitude resembles a melting curve. In MiliQ water it is relatively steep, in buffer with NaCl it is broad, and in buffer with 20 mM MgCl2 the melting point shifts to a much high temperature (48°C).
Figure 2.
Autocorrelation curves of proximity ratio for the 10 nM DNA hairpin-loop in buffer solution (10 mM Tris/1 mM EDTA (pH 7.5) and 100 mM NaCl) at different temperatures. Solid square, −0.6°C; solid circle, 19.9°C; solid triangle, 40.4°C. The solid lines are fits using Eq. 1.
Figure 3.
Temperature dependence of the correlation amplitudes for the proximity ratio of DNA hairpin in different buffer conditions. (a) MiliQ; (b) 10 mM Tris/1 mM EDTA (pH 7.5) and 100 mM NaCl; (c) 10 mM Tris and 20 mM MgCl2. The solid lines are fits based on Eq. 6. The derived apparent thermodynamic parameters are listed in Table 1.
An expression for the autocorrelation function of fluorescence intensity for two reversibly interconverting fluorescent species freely diffusing in solution was given by Elson and Magde (17),
 |
3 |
 |
where N is the average number of molecules in the probe volume, τC and τD are the chemical and diffusional relaxation times, ω describes the length-to-diameter ratio of the three-dimensional Gaussian volume element, K is the equilibrium constant, and Q is the fluorescence intensity ratio of the two species.
In calculating the autocorrelation function of the proximity ratio, the diffusional contribution to Eq. 3 will, in theory, be absent (10). In this case, the correlation amplitude GP(0) can be approximated by
 |
4 |
where A is a constant related to the number of fluctuating molecules in the confocal volume. The statically determined ratio Q may not be appropriate to apply to our dynamic case, because Q changes with conformation and temperature. Because both the nature of dynamic process and Q are unknown, an empirical description of the association transition must be used—in this case an all-or-none two-state model. Given that there are limiting values for GP(0) at both low and high temperatures (see Fig. 3), we may write
 |
5 |
where GP(0)0 and GP(0)∞ represent the limiting values of correlation amplitude at high and low temperatures. Assuming that the enthalpy and entropy changes are temperature-independent, then K = exp(−ΔH/RT + ΔS/R) and, hence, GP(0) can be given empirically,
 |
6 |
where C is the residual correlation amplitude. This function provides good fit to all three correlation amplitude curves (Fig. 3, solid lines). The apparent thermodynamic parameters derived from these fits are shown in Table 1.
Table 1.
Thermodynamic parameters for the open-to-closed transition and activation energies for the closing and opening kinetics of the DNA hairpin-loop
| Experimental conditions | FRET fluctuation
|
Steady-state
fluorescence
|
Activation energy
|
|||
|---|---|---|---|---|---|---|
| ΔH/kJmol−1 | ΔS/Jmol−1⋅K−1 | ΔH/kJmol−1 | ΔS/Jmol−1⋅K−1 | Ecl/kJmol−1 | Eop/kJmol−1 | |
| MiliQ water | −146 ± 2 | −507 ± 6 | −134 ± 5 | 119 ± 10 | ||
| 10 mM Tris/1 mM EDTA (pH 7.5) + 100 mM NaCl | −65 ± 7 | −224 ± 21 | −78 ± 1 | −272 ± 3 | −53 ± 2 | 59 ± 4 |
| 10 mM Tris + 20 mM MgCl2 | −101 ± 6 | −315 ± 20 | −116 ± 1 | −356 ± 2 | 94 ± 2 | |
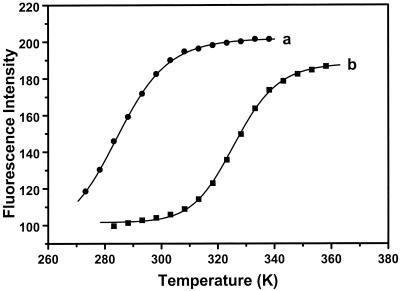
Fig. 4 shows the fluorescence melting curves of DNA hairpin in 100 mM NaCl and 20 mM MgCl2. Again, an all-or-none two-state model was also used to fit these fluorescence melting curves,
 |
7 |
where I0 and I∞ denote the fluorescence intensity of all-open and all-closed states (high and low temperature limits). The results are given in Table 1.
Figure 4.
Equilibrium thermal melting curves for the DNA hairpin-loop. The closed-to-open transition was monitored by the ratio of fluorescence intensity of TMR in a double-labeled sample to that of a TMR-only-labeled sample. (a) 10 mM Tris/1 mM EDTA (pH 7.5) and 100 mM NaCl; (b) 10 mM Tris and 20 mM MgCl2. Solid lines are two-state model fits according to Eq. 7. Apparent thermodynamic parameters are listed in Table 1.
The agreement between dynamic and static measurements is quite good. For example, fluctuation measurements give an apparent enthalpy change ΔH of −65 kJ/mol and −101 kJ/mol in 100 mM NaCl and 20 mM MgCl2 buffer, respectively, whereas steady-state measurements obtain the slightly larger values of −78 kJ/mol and −116 kJ/mol, respectively.
In MiliQ water, there are large enthalpy and entropy changes for the transition from random coil to closed state, resulting in a steep transition. These are much smaller in 100 mM NaCl. This implies that the transition in the later case must be less cooperative and broader. As such, it is not surprising that our previous single-molecule FRET measurement did not resolve two subpopulations in buffer (10). The effect of Mg2+ on the stability of hairpin is significant, substantially increasing the melting temperature (from 12°C in 100 mM NaCl buffer to 53°C in 20 mM MgCl2 buffer), and resulting in considerable FRET even at temperatures up to 90°C (data not shown). Thermodynamic parameters of association for a molecular beacon possessing a 15-nucleotide loop and 5-nucleotide arms were determined recently (ΔH = −142 kJ/mol, ΔS = −435 J/mol K, and Tm = 53°C in 100 mM KCl and 1 mM MgCl2; ref. 18). Because of the large size of the loop in our hairpin (30 in loop size), the melting temperature is, as expected, lower than that of this molecular beacon in similar condition (19°C determined by fluctuation measurement and 12°C by steady-state fluorescence).
Viscosity Dependence of Conformational Fluctuation Rate.
By examining the viscosity dependence of the fluctuation rate, one can begin to determine whether the underlying polynucleotide chain diffusion process is dominated by solvent or internal friction (19, 20). In the high viscosity limit, Kramers' theory predicts that reaction rates are inversely proportional to viscosity η (21). An off-lattice model simulation of polypeptides showed that the Kramers' model of barrier crossing provides a quantitative fit of the numerical result (22). However, in most cases, the observed rate constant for proteins has been shown to be inversely proportional to the fractional power of the viscosity, kobs = Bη−β (0 < β < 1) (23). Grote and Hynes (24) generalized Kramers' theory by allowing the friction opposing the local polymer motion to be frequency-dependent. A positive power dependence of viscosity on frequency leads to the inverse fractional power dependence of relaxation rate on viscosity.
For the intramolecular activated barrier-crossing process, the internal interaction within polymers may affect the reaction rate (25). If the rate-limiting step in a folding reaction involves internal rearrangement, the internal friction rather than solvent friction is expected to dominate in the reaction rate (26). Eaton and coworkers (19, 27) took consideration of both the solvent friction η and internal friction σ and proposed an empirical equation to describe the viscosity dependence of the conformational relaxation rate of myoglobin, kobs = [B/(η + σ)]exp(−E0/RT). Provided that both internal and solvent frictions are frequency-dependent, an empirical formula may be proposed: kobs = [B/(η + σ)β]exp(−E0/RT). For constant temperature, the relaxation time τ becomes
 |
8 |
As pointed out by Plaxco and Baker (20), the viscosity at the transition state is the primary determinant of the rate. As such, in a two-state process the forward and reverse reactions should be equally viscosity-dependent as a consequence of the principle of microscopic reversibility (28).
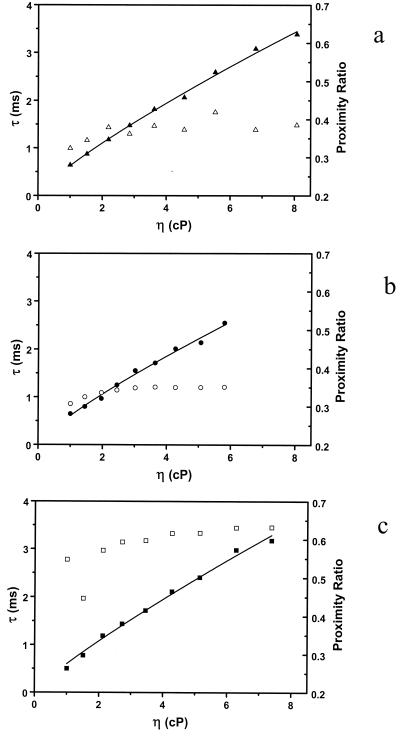
Eq. 8 was used to fit the viscosity dependence of the fluctuation rates in different buffer conditions. It was found that the internal friction σ is negligible within experimental error. The experimental results are shown in Fig. 5 together with the proximity ratio dependence on the viscosity. The fact that the internal friction in the DNA hairpin-loop fluctuation can be neglected is consistent with the recent finding that there is limited internal friction in the rate-limiting step of protein folding (20, 26). Although the proximity ratios in water/glycerol mixture containing 10 mM Tris and 20 mM MgCl2 are significantly larger, values of the β in all three cases are the same within experimental uncertainty (see Fig. 5 legend), implying that the effect of the buffer on the frequency dependence of the solvent friction is minor.
Figure 5.
Viscosity dependence for the fluctuation rates of DNA hairpin-loop. (a) Glycerol/water solution; (b) glycerol/water solution containing 10 mM Tris/1 mM EDTA (pH 7.5) and 100 mM NaCl; (c) glycerol/water solution containing 10 mM Tris and 20 mM MgCl2. The data were fitted to Eq. 8 and β derived are 0.82 ± 0.02, 0.81 ± 0.03, and 0.85 ± 0.03 for the case of a, b, and c, respectively. Proximity ratios are also plotted (unfilled symbols).
Kinetics of Conformational Fluctuation.
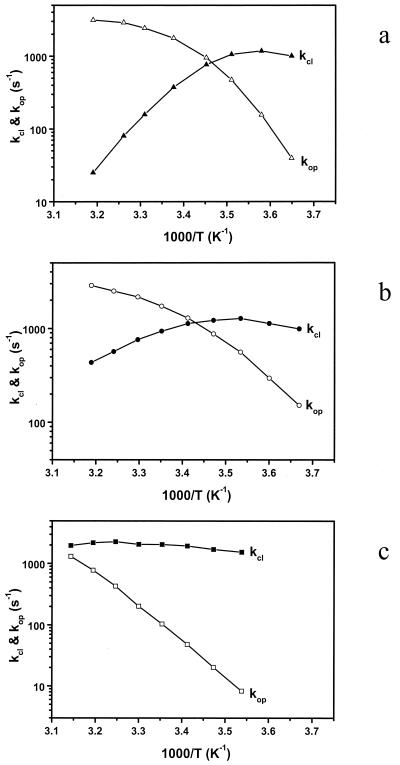
From the thermodynamic parameters in Table 1 and the mean fluctuation rates, the unfolding (opening) and folding (closing) rates were calculated and a plot of the logarithm of these rates as a function of 1000/T is shown in Fig. 6. In MiliQ and buffer/NaCl, the opening rates show Arrhenius-like behavior (curves have negative slope). This implies that over the temperature range studied the free energy barrier for escape from the closed state is always dominated by enthalpy. However, the gradient of the transition decreases with increasing temperature. This deviation from purely Arrhenius behavior indicates that the entropic contribution to the opening rate also increases with temperature. The closing rates show anti-Arrhenius behavior and are dominated by an entropic contribution to hairpin-loop formation. This time the gradient change shows an enthalpic contribution at low temperature. For the case of buffer/MgCl2, the much higher melting temperature of the hairpin-loop limits observation of kinetic rates to below the melting temperature. However, the general trend is the same as in the other two cases. The curved plots and the anti-Arrhenius behavior indicate that the hairpin-loop conformational fluctuation is similar to protein folding, being dominated by enthalpy at low temperatures and by entropy at high temperatures (29). The role of the contribution of configurational entropy to non-Arrhenius kinetics in protein folding was first discussed by Wolynes, Onuchic, and coworkers (30, 31) and observed in their lattice simulations. Recently, non-Arrhenius kinetics were found in molecular dynamics simulation by using an atomistic model (32). Experimental evidence is also present for α-helical peptides (33, 34), a β-hairpin peptide (12), CI2 and barnase (35), and lysozyme (36). Given the assumption that the interactions in the DNA hairpin-loop are independent of temperature, the unusual temperature dependence of the opening and closing kinetics might simply be a consequence of the temperature dependence of the accessible configuration space (32). At low temperatures, an increase in thermal energy makes it easier to get over the energy barrier. In this case, the rate-limiting step is zipping the base pair in the stem region of the hairpin (9); at high temperatures, the molecule can access a larger portion of configuration space available (more like random coil), resulting in a slowdown in the closing process (32). However, this simple approximation does not take into account the temperature dependence of the hydrophobic interactions between bases (37). Here, the main interactions are hydrogen bonding in base pairs and π interactions between bases in the stack. A significant heat capacity increase has been observed in the dissociation of DNA duplexes (38, 39), indicating the enthalpy changes are dependent on temperature. Therefore, the curvature in Arrhenius plot is probably due to both the base interactions and the variance in number of accessible conformational configurations.
Figure 6.
Arrhenius plot of the closing and opening kinetics for the DNA hairpin-loop. (a) MiliQ water; (b) 10 mM Tris/1 mM EDTA (pH 7.5) and 100 mM NaCl; (c) 10 mM Tris and 20 mM MgCl2. The viscosity corrected apparent activation energies are summarized in Table 1.
If we account for the temperature dependence of the solvent viscosity, the opening and closing rate constants can be written as
 |
 |
9 |
where η/η0 is the relative viscosity. The experimental value of β is 0.83. The activation energies for the opening and closing processes in MiliQ and buffer/NaCl were calculated based on four points at low and high temperatures, respectively. In the case of 20 mM MgCl2 buffer, the activation energy for the opening process was derived by all eight points. The results are summarized in Table 1. The activation energy of −53 kJ/mol in 100 mM NaCl buffer for the closing of this hairpin is comparable to −33 kJ/mol obtained by Ansari and coworkers (40) for a short hairpin. However, it should be mentioned that at low temperature the activation energy is slightly positive. There exists a maximum in closing rate for the hairpin, consistent with the scenario of a downhill folding in which the free energy bias toward the closed state is increased because of an even larger effect on the effective diffusion constant from increased roughness of the energy landscape (16).
Statistical mechanical models have been proved powerful to help understand the kinetics of helix-coil transition and β-hairpin formation in polypeptides (12, 41–43). The recent model proposed by Ansari's group (40) for the free energy cost of loop formation of DNA hairpin provides a good description of the equilibrium melting behavior, and the transition state is identified as an ensemble of looped conformations with one base pair closing the loop. The model also predicts a negative activation energy for the hairpin formation, in agreement with our experimental observation.
Intramolecular Diffusion Coefficient.
DNA hairpin-loop conformational fluctuation is a form of general end-to-end polymer contact formation. First passage time theory of Szabo, Schulten, and Schulten (SSS; ref. 44) is the simplest description of end-to-end polymer contact dynamics, and therefore it might be helpful to explain our experimental results. Based on the method of Lapidus et al. (2), the effective diffusion constant was analyzed as follows: in SSS theory, the contact rate is obtained by solving a diffusion equation for an ideal Gaussian chain in a purely entropic harmonic potential. When contact distance a is small compared with the length of the chain segment, the SSS rate is given by (2, 44)
 |
10 |
where 〈r2〉 is the equilibrium mean-square end-to-end distance, and D is the relative diffusion coefficient between the ends of the chain. Because the equilibrium constant K(kcl/kop) is (45, 46)
 |
11 |
the opening rate can be written as Kop = 3D/a2.
The worm-like-chain (WLC) model (47, 48) was used to estimate the value of 〈r2〉,
 |
12 |
where Lc and Lp is the contour and persistence length for single-stranded DNA (ssDNA), respectively. There are still controversies on the persistent length of ssDNA (40, 49, 50). Bustamante and coworkers (49) obtain Lp ≈ 0.75 nm from measurements of the elastic response of ssDNA molecules with optical tweezers. A value of 0.78 nm was suggested recently by Ansari and coworkers when using a statistical mechanical model (40). Taking the contour length of 18 nm for ssDNA with a size of 35 bases (loop size + 5), a persistent length of 0.78 nm, the mean-square end-to-end distance 〈r2〉 is estimated to be 27 nm2. The equilibrium constant K is ≈1.0 in 100 mM NaCl buffer at 20°C. By applying Eq. 11, the contact distance a is 4.7 nm, close to the FRET distance of 5.3 nm for TMR-Cy5 pair (51), further justifying the assumption that our FRET fluctuation method should be sensitive to this particular system. When we use the closing rate of 2 × 10³ s−1, the effective intramolecular diffusion constant D is derived to be 1.4 × 10⁻¹⁰ cm2⋅s−1 according to Eq. 10.
Comparison with Polypeptides.
It is quite illuminating to compare DNA hairpin fluctuation kinetics with those of β-hairpin peptide and α-helix peptide. Both DNA hairpin and β-hairpin peptide show similar kinetic behavior: non-Arrhenius kinetics with a negative apparent activation energy for the folding rate calculated from a two-state analysis (43). However, the time scale of fluctuation for a DNA hairpin is much slower. For a β-hairpin consisting of 16 amino acid residues, the folding time is about 6 μs at room temperature (12); in contrast, we predict for a DNA hairpin with the loop size of 16 a closing time constant of ≈100 μs based on our current work and that of Bonnet et al. (9). It is known that the rate of β-hairpin formation is much (>10-fold) slower than that of α-helices (1). The rate of end-to-end contact formation in a similar size polypeptide was measured to be ≈140 ns (2). Apparently, there is 100- to ≈1,000-fold difference in intramolecular diffusion coefficient between our DNA hairpin and the polypeptide. How do we reconcile these results? The key issue may lie in the intrachain interactions. For example, a 10-fold decrease in the fluctuation rate of DNA hairpin was observed when the loop content was changed from thymines to adenines, because of the large size of adenine compared with thymine and the increased interaction of adenines in stacking (9). Intrachain interactions can be viewed as introducing “roughness” to the entropic harmonic potential of SSS theory (2). Zwanzig (52) has shown that for diffusion in one dimension, roughness reduces the diffusion coefficient by a factor of exp[−(ɛ/kBT)2], where ɛ is the root-mean-square height of the energy barrier having a Gaussian distribution. As such, an increase in energy roughness only 2.63 kBT could reduce the diffusion coefficient a factor of 1,000. In the case of poly(A) hairpin-loop, to form the first base pair in the stem region, which is rate-limiting, the DNA chain has to break stacked AA pairs that prevent formation of the loop. According to the recent estimation (53), the AA stacking energy is about 2 kJ/mol; we estimate effective energy roughness about 3 AA pairs in the loop (≈6 kJ/mol). However, there are uncertainties when we directly compare results by using different experimental approaches. FRET gives the average diffusion constant at a distance about the Förster distance, which is 5.3 nm for the donor–acceptor pair used in this paper, whereas triplet–triplet energy transfer measures contact rates at a shorter distance, because the Dexter electron-exchange mechanism requires van der Waals contact between donor and acceptor (1).
Conclusions
We have shown that thermodynamic and kinetic parameters for the conformational transition can be extracted from a single measurement of the correlation in FRET of freely diffusing DNA molecules as a function of temperature. This method is generally applicable to the study of any process involving correlated motion between two sites of a biomolecule in the micro- to millisecond time regime. In contrast to recent laser temperature-jump and more conventional stopped-flow methods, which measure reaction kinetics from a nonequilibrium state, FRET fluctuation examines kinetics at equilibrium. We expect this approach will be powerful in studying conformational dynamics associated with protein folding, ligand binding, and enzymatic catalysis.
Acknowledgments
We thank Professor Ansari for providing us with her manuscript before publication. This work was supported by the Leverhulme Trust (Grant F650E).
Abbreviations
- FRET
fluorescence resonance energy transfer
- TMR
carboxytetramethylrhodamine
- SSS
first passage time theory of Szabo, Schulten, and Schulten
Footnotes
This paper was submitted directly (Track II) to the PNAS office.
References
- 1.Bieri O, Wirz J, Hellrung B, Schutkowski M, Drewello M, Kiefhaber T. Proc Natl Acad Sci USA. 1999;96:9597–9601. doi: 10.1073/pnas.96.17.9597. [DOI] [PMC free article] [PubMed] [Google Scholar]
- 2.Lapidus L J, Eaton W A, Hofrichter J. Proc Natl Acad Sci USA. 2000;97:7220–7225. doi: 10.1073/pnas.97.13.7220. [DOI] [PMC free article] [PubMed] [Google Scholar]
- 3.Hass E, Katchalski-Katzir E, Steinberg I Z. Biopolymers. 1978;17:11–31. [Google Scholar]
- 4.Kusba J, Piszczek G, Gryczynski I, Johnson M L, Lakowicz J R. Chem Phys Lett. 2000;319:661–668. doi: 10.1016/s0009-2614(00)00071-3. [DOI] [PMC free article] [PubMed] [Google Scholar]
- 5.Zazopoulos E, Lalli E, Stocco D M, Sassone-Corsi P. Nature (London) 1997;390:311–315. doi: 10.1038/36899. [DOI] [PubMed] [Google Scholar]
- 6.Dai X, Greizerstein M B, Nadas-Chinni K, Rothman-Denes L B. Proc Natl Acad Sci USA. 1997;94:2174–2179. doi: 10.1073/pnas.94.6.2174. [DOI] [PMC free article] [PubMed] [Google Scholar]
- 7.Tyagi S, Kramer F R. Nat Biotechnol. 1996;14:303–308. doi: 10.1038/nbt0396-303. [DOI] [PubMed] [Google Scholar]
- 8.Liu X, Tan W. Anal Chem. 1999;71:5054–5059. doi: 10.1021/ac990561c. [DOI] [PubMed] [Google Scholar]
- 9.Bonnet G, Krichevsky O, Libchaber A. Proc Natl Acad Sci USA. 1998;95:8602–8606. doi: 10.1073/pnas.95.15.8602. [DOI] [PMC free article] [PubMed] [Google Scholar]
- 10.Wallace M I, Ying L, Balasubramanian S, Klenerman D. J Phys Chem B. 2000;104:11551–11555. [Google Scholar]
- 11.Ying L, Wallace M I, Klenerman D. Chem Phys Lett. 2001;334:145–150. [Google Scholar]
- 12.Muñoz V, Thompson P A, Hofrichter J, Eaton W A. Nature (London) 1997;390:196–199. doi: 10.1038/36626. [DOI] [PubMed] [Google Scholar]
- 13.Sheely M L. Ind Eng Chem. 1932;24:1060–1064. [Google Scholar]
- 14.Ying L, Wallace M I, Balasubramanian S, Klenerman D. J Phys Chem B. 2000;104:5171–5178. [Google Scholar]
- 15.Metzler R, Klafter J, Jortner J, Volk M. Chem Phys Lett. 1998;293:477–484. [Google Scholar]
- 16.Eaton W A, Muñoz V, Hagen S J, Jas G S, Lapidus L J, Henry E R, Hofrichter J. Ann Rev Biophys Biomol Struct. 2000;29:327–359. doi: 10.1146/annurev.biophys.29.1.327. [DOI] [PMC free article] [PubMed] [Google Scholar]
- 17.Elson E L, Magde D. Biopolymers. 1974;13:1–27. doi: 10.1002/bip.1974.360130103. [DOI] [PubMed] [Google Scholar]
- 18.Bonnet G, Tyagi S, Libchaber A, Kramer F R. Proc Natl Acad Sci USA. 1999;96:6171–6176. doi: 10.1073/pnas.96.11.6171. [DOI] [PMC free article] [PubMed] [Google Scholar]
- 19.Ansari A, Jones C M, Henry E R, Hofrichter J, Eaton W A. Science. 1992;256:1796–1798. doi: 10.1126/science.1615323. [DOI] [PubMed] [Google Scholar]
- 20.Plaxco K W, Baker D. Proc Natl Acad Sci USA. 1998;95:13591–13596. doi: 10.1073/pnas.95.23.13591. [DOI] [PMC free article] [PubMed] [Google Scholar]
- 21.Kramers H A. Physica. 1940;7:284–304. [Google Scholar]
- 22.Klimov D K, Thirumalai D. Phys Rev Lett. 1997;79:317–320. [Google Scholar]
- 23.Oh-oka H, Iwaki M, Itoh S. Biochemistry. 1997;36:9267–9272. doi: 10.1021/bi9701787. [DOI] [PubMed] [Google Scholar]
- 24.Grote R F, Hynes J T. J Chem Phys. 1980;73:2715–2732. [Google Scholar]
- 25.Schlitter J. Chem Phys. 1988;120:187–197. [Google Scholar]
- 26.Bhattacharyya R P, Sosnick T R. Biochemistry. 1999;38:2601–2609. doi: 10.1021/bi982209j. [DOI] [PubMed] [Google Scholar]
- 27.Hagen S J, Hofrichter J, Eaton W A. Science. 1995;269:959–962. doi: 10.1126/science.7638618. [DOI] [PubMed] [Google Scholar]
- 28.Jacob M, Schindler T, Balbach J, Schmid F X. Proc Natl Acad Sci USA. 1997;94:5622–5627. doi: 10.1073/pnas.94.11.5622. [DOI] [PMC free article] [PubMed] [Google Scholar]
- 29.Dobson C M, Šali A, Karplus M. Angew Chem Int Ed Engl. 1998;37:868–893. doi: 10.1002/(SICI)1521-3773(19980420)37:7<868::AID-ANIE868>3.0.CO;2-H. [DOI] [PubMed] [Google Scholar]
- 30.Bryngelson J D, Onuchic J N, Socci N D, Wolynes P G. Proteins. 1995;21:167–195. doi: 10.1002/prot.340210302. [DOI] [PubMed] [Google Scholar]
- 31.Onuchic J N, Luthey-Schulten Z, Wolynes P G. Annu Rev Phys Chem. 1997;48:545–600. doi: 10.1146/annurev.physchem.48.1.545. [DOI] [PubMed] [Google Scholar]
- 32.Ferrara P, Apostolakis J, Caflisch A. J Phys Chem B. 2000;104:5000–5010. [Google Scholar]
- 33.Clarke D T, Doig A J, Stapley B J, Jones G R. Proc Natl Acad Sci USA. 1999;96:7232–7237. doi: 10.1073/pnas.96.13.7232. [DOI] [PMC free article] [PubMed] [Google Scholar]
- 34.Lednev I K, Karnoup A S, Sparrow M C, Asher S A. J Am Chem Soc. 1999;121:8074–8086. doi: 10.1021/ja003381p. [DOI] [PubMed] [Google Scholar]
- 35.Oliveberg M, Tan Y J, Fersht A R. Proc Natl Acad Sci USA. 1995;92:8926–8929. doi: 10.1073/pnas.92.19.8926. [DOI] [PMC free article] [PubMed] [Google Scholar]
- 36.Segawa S I, Sugihara M. Biopolymers. 1984;23:2473–2488. doi: 10.1002/bip.360231122. [DOI] [PubMed] [Google Scholar]
- 37.Scalley M L, Baker D. Proc Natl Acad Sci USA. 1997;94:10636–10640. doi: 10.1073/pnas.94.20.10636. [DOI] [PMC free article] [PubMed] [Google Scholar]
- 38.Chalikian T V, Völker J, Plum G E, Breslauer K J. Proc Natl Acad Sci USA. 1999;96:7853–7858. doi: 10.1073/pnas.96.14.7853. [DOI] [PMC free article] [PubMed] [Google Scholar]
- 39.Rouzina I, Bloomfield V A. Biophys J. 1999;77:3242–3251. doi: 10.1016/S0006-3495(99)77155-9. [DOI] [PMC free article] [PubMed] [Google Scholar]
- 40.Kuznetsov, S. V., Shen, Y., Benight, A. S. & Ansari, A. (2001) Proc. Natl. Acad. Sci. USA, in press.
- 41.Thompson P A, Eaton W A, Hofrichter J. Biochemistry. 1997;36:9200–9210. doi: 10.1021/bi9704764. [DOI] [PubMed] [Google Scholar]
- 42.Thompson P A, Muñoz V, Jas G S, Henry E R, Eaton W A, Hofrichter J. J Phys Chem B. 2000;104:378–389. [Google Scholar]
- 43.Muñoz V, Henry E R, Hofrichter J, Eaton W A. Proc Natl Acad Sci USA. 1998;95:5872–5889. doi: 10.1073/pnas.95.11.5872. [DOI] [PMC free article] [PubMed] [Google Scholar]
- 44.Szabo A, Schulten K, Schulten Z. J Chem Phys. 1980;72:4350–4357. [Google Scholar]
- 45.Wang J C, Davidson N. J Mol Biol. 1966;19:469–482. doi: 10.1016/s0022-2836(66)80017-7. [DOI] [PubMed] [Google Scholar]
- 46.Jacobson H, Stockmayer W H. J Chem Phys. 1950;18:1600–1606. [Google Scholar]
- 47.Landau L D, Lifshitz E M. Statistical Physics. 1980. , trans. Sykes, J. B. & Kearsley, M. J., revised by Lifshitz, E. M. & Pitaevskii, L. P. (Pergamon Press, New York), 3rd Ed., Vol. 5. [Google Scholar]
- 48.Rivetti C, Walker C, Bustamante C. J Mol Biol. 1998;280:41–59. doi: 10.1006/jmbi.1998.1830. [DOI] [PubMed] [Google Scholar]
- 49.Smith S B, Cui Y, Bustamante C. Science. 1996;271:795–798. doi: 10.1126/science.271.5250.795. [DOI] [PubMed] [Google Scholar]
- 50.Mills J B, Vacano E, Hagerman P J. J Mol Biol. 1999;285:245–257. doi: 10.1006/jmbi.1998.2287. [DOI] [PubMed] [Google Scholar]
- 51.Deniz A, Dahan M, Grunwell J R, Ha T, Faulhaber A E, Chemla D S, Weiss S, Schultz P G. Proc Natl Acad Sci USA. 1999;96:3670–3675. doi: 10.1073/pnas.96.7.3670. [DOI] [PMC free article] [PubMed] [Google Scholar]
- 52.Zwanzig R. Proc Natl Acad Sci USA. 1988;85:2029–2030. doi: 10.1073/pnas.85.7.2029. [DOI] [PMC free article] [PubMed] [Google Scholar]
- 53.Goddard N L, Bonnet G, Krichevsky O, Libchaber A. Phys Rev Lett. 2000;85:2400–2403. doi: 10.1103/PhysRevLett.85.2400. [DOI] [PubMed] [Google Scholar]


