

Abstract
Skin biopsy gene expression was analyzed by DNA microarray from 13 dSSc patients enrolled in an open label study of rituximab, 9 dSSc patients not treated with rituximab, and 9 healthy controls. These data recapitulate the patient ‘intrinsic’ gene expression subsets described previously including proliferation, inflammatory, and normal-like groups. Serial skin biopsies showed consistent and non-progressing gene expression over time, and importantly, the patients in the inflammatory subset do not move to the fibroproliferative subset, and vice versa. We were unable to detect significant differences in gene expression before and after rituximab treatment, consistent with an apparent lack of clinical response. Serial biopsies from each patient stayed within the same gene expression subset regardless of treatment regimen or the time point at which they were taken. Collectively, these data emphasize the heterogeneous nature of SSc and demonstrate that the intrinsic subsets are an inherent, reproducible and stable feature of the disease that is independent of disease duration. Moreover, these data have fundamental importance for the future development of personalized therapy for SSc; drugs targeting inflammation are likely to benefit those patients with an inflammatory signature, whereas drugs targeting fibrosis are likely to benefit those with a fibroproliferative signature.
INTRODUCTION
Systemic sclerosis (SSc) is a multi-system autoimmune disorder with a hallmark of skin fibrosis and thickening along with significant internal organ involvement (Mayes, 2003). SSc has historically been divided into limited and diffuse disease based on the extent of skin involvement, with limited cutaneous SSc (lSSc) involving skin restricted to the regions below the elbows, knees and face, and diffuse cutaneous SSc (dSSc) including more proximal skin. The degree of skin involvement has a direct correlation with SSc prognosis and internal organ complications (Barnett et al., 1988; Scussel-Lonzetti et al., 2002). However, within dSSc and lSSc, there is a heterogeneous range of skin and internal organ involvement. Approaches that objectively quantify disease heterogeneity and predict internal organ involvement are critically needed.
Previous genome-wide gene expression studies in SSc skin identified disease specific gene expression signatures in both lesional and non-lesional skin biopsies that are distinct from those found in healthy controls (Gardner et al., 2006; Milano et al., 2008; Whitfield et al., 2003). In addition, we have shown that distinct gene expression signatures divide SSc patients into ‘intrinsic subsets’, capturing the clinical heterogeneity of limited versus diffuse SSc, but extending this heterogeneity by revealing that patients with dSSc fall into several different subsets based on gene expression in skin (Milano et al., 2008). These results suggested that distinct pathogenic mechanisms may drive disease in different patients or at different stages of the disease. We previously identified four intrinsic gene expression subsets: a ‘diffuse-proliferation’ group comprised completely of patients with dSSc, showing increased expression of genes associated with the cell proliferation that could be further subdivided into two groups ‘diffuse1’ and ‘diffuse2’; an ‘inflammatory’ group comprised of dSSc, lSSc and morphea samples, showing increased expression of genes associated with inflammation; a ‘limited’ group comprised primarily of patients with lSSc; and the ‘normal-like’ group of dSSc and lSSc patients, showing gene expression similar to healthy controls. A weak relationship was found between disease duration and these intrinsic subsets, suggesting that they might reflect evolution of the disease process rather than biologically distinct pathogenic processes.
Here we recapitulate the intrinsic subsets, show these subsets are stable over time, and that treatment with rituximab fails to alter skin gene expression. These data illustrate that patients with an inflammatory signature do not go on to develop a fibroproliferative signature, suggesting a possible explanation why, in the past, broad spectrum anti-inflammatory agents may not have worked in SSc. It also indicates that different pathogenic mechanisms drive disease pathogenesis within phenotypically similar patients with dSSc and that this heterogeneity can be consistently and reproducibly detected by analyzing skin gene expression, having broad implications for the future development of therapies for SSc.
RESULTS
dSSc skin biopsies can reproducibly be divided into ‘intrinsic’ gene expression subsets
We analyzed skin biopsies from dSSc patients for gene expression changes indicative of patient specific heterogeneity. Gene expression was measured in 60 skin biopsies from 22 patients with dSSc and 9 healthy controls (Supplemental Table 1). A total of 89 microarrays were hybridized, which included 29 technical replicates. All patients were biopsied at a lesional forearm site, a subset were also biopsied at a non-lesional back site. Clinical data can be found in Supplemental Table 2.
Skin biopsies from dSSc patients were analyzed before and after treatment with rituximab for gene expression changes. Consistent with the lack of clinical response (Lafyatis et al., 2009), we did not find a significant change in gene expression associated with rituximab treatment. Instead, gene expression was nearly identical between serial biopsies of patients before and after treatment (see Supplemental Material; Supplemental Data File S1; Supplemental Figure S2).
We previously selected a set of ‘intrinsic’ genes that showed consistent non-changing gene expression between the lesional forearm and non-lesional back biopsies, but showed the largest changes between different patients (Milano et al. 2008), allowing us to compare differences between patients rather than between lesional/non-lesional biopsies. This resulted in the identification of patient subsets based on gene expression. These groups were labeled fibroproliferative, inflammatory, limited and normal-like based on the biological gene expression programs that predominated in each subset. We used the same strategy to classify patients in this independent cohort of patient. Hierarchical clustering using 2377 intrinsic genes (FDR 0.4%) recapitulated the major intrinsic subsets including the Fibroproliferative (Diffuse 1 and 2), Inflammatory, and Normal-like groups (Figure 1A and 2).
Figure 1. Gene expression over time in SSc Skin.
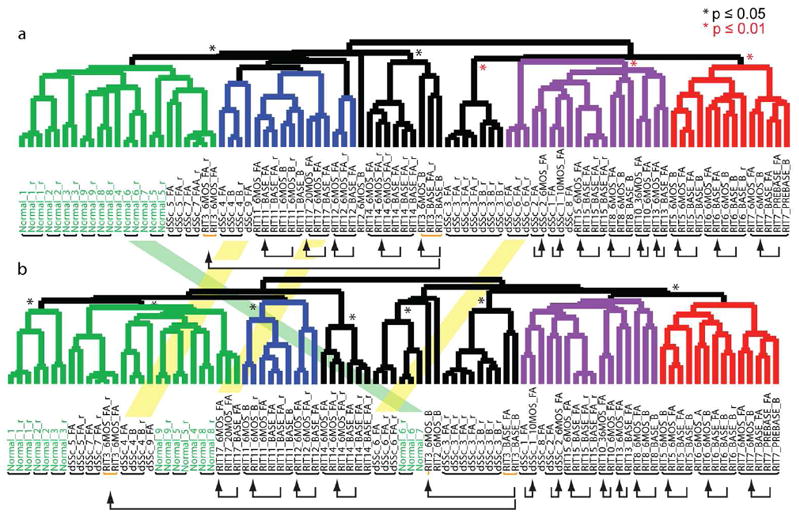
Shown are the hierarchical clustering dendrograms of the ‘intrinsic by patient’ (A) and ‘intrinsic by time point’ analyses (B). Dendrogram branches are colored by subtype: normal-like (green), inflammatory (purple), diffuse 1 (blue) and diffuse 2 (red) represent the diffuse-proliferation group. Statistically significant branches are indicated by an asterisk (Black *, p ≤ 0.05) and (red *, p ≤ 0.01). Black bars below the sample identifiers indicate arrays from skin biopsies from the same patient that clustered together, yellow bars below the identifiers identify arrays that split. Black arrows connect longitudinal samples. Overlaid between the two dendrograms are shaded bars indicating arrays that changed intrinsic subset between the two analyses.
Figure 2. Recapitulation of the intrinsic subsets.
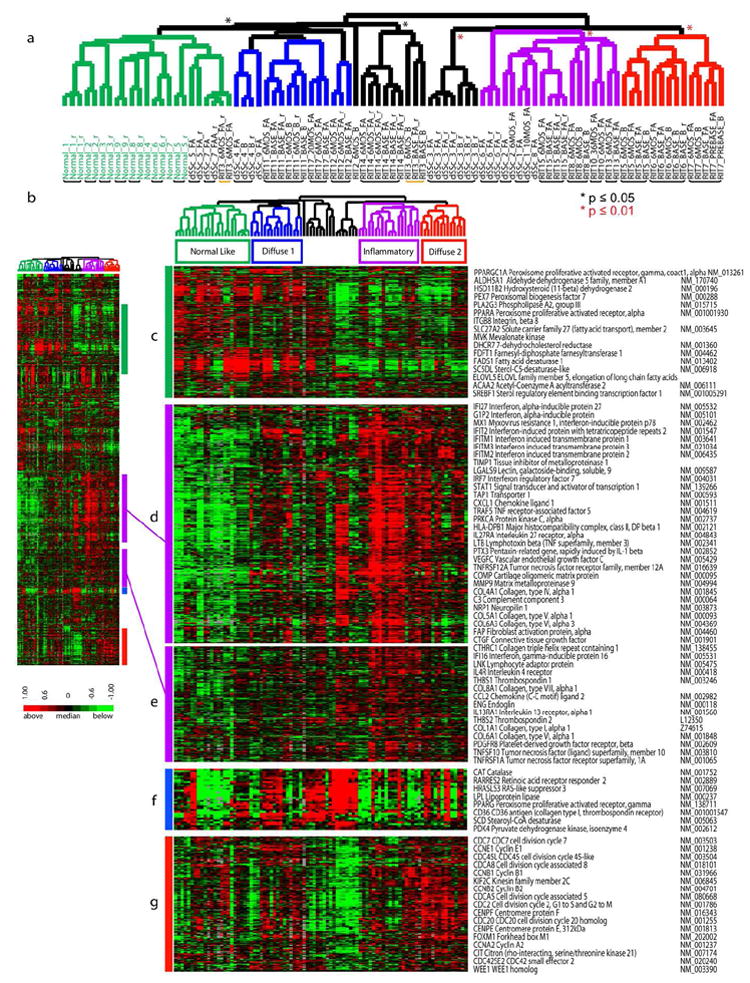
2377 genes were selected from 89 arrays (31 individuals) by ‘intrinsic by patient’ analysis. A. Hierarchical clustering dendrogram shows the normal-like (green branches), inflammatory (purple), and diffuse-proliferation groups (diffuse 1 (blue) and diffuse 2 (red)). Significance of clustering was determined by SigClust (p ≤ 0.05, black asterisk; p ≤ 0.01, red asterisk). Healthy control identifiers are green and dSSc are black. RIT indicates samples in the rituximab study. Black bars indicate patient samples that clustered together, the yellow bar indicates patient RIT 3 that did not cluster. B. Heat map of genes and samples clustered hierarchically. C. Fatty-acid synthesis genes. D and E. inflammatory and collagen genes. F. PPAR-γ genes. G. Proliferation cluster.
Patient biopsies taken at different time points show similar patterns of gene expression
We carried out a second analysis to specifically explore whether patients showed significant alterations in gene expression subset over time (intrinsic-by-patient analysis). Genes were selected that showed the most consistent expression at a single time point for each patient, but had the most diverse expression between time points (1888 genes, FDR of 1.58%). Organizing the samples by hierarchical clustering shows that serial biopsies from 13 of 14 patients group together, even though this analysis emphasizes differences between time points (Figure 1B, Supplemental Figure S1), indicating that serial biopsies are more similar to each other than to any other samples over the 6 months to 2 years analyzed. The dendrograms for the intrinsic by time point and intrinsic by patient analysis are remarkably similar confirming that gene expression varies little across time (Figure 1).
Distinct pathways are associated with each intrinsic gene expression group
Distinct sets of genes were associated with each subset that corresponded to specific biological processes in the skin, represented bv GO biological processes ((Milano et al.2008), Figure 2; Supplemental Data file S3). Genes associated with the inflammatory group are enriched for the GO biological processes of immune system response and inflammatory response (p ≤ 0.001, DAVID analysis; Figure 2D and E) and include interferon-induced genes such IFIT1, IFIT2, OAS3. This group of genes is also enriched for the GO biological processes of vasculature development (p ≤ .01) including the genes vascular endothelial growth factor C (VEGFC) and endoglin (ENG), as well as genes associated with fibrosis (COL6A3, COL6A1, COL5A2, COL5A1, COL1A1, COL1A2), Collagen Oligomeric Matrix Protein (COMP), matrix metalloproteinase 9, (MMP9) (Jimenez et al., 1996; Liu and Zhang, 2008; Ramirez et al., 2006; Varga and Jimenez, 1995).
Two groups of dSSc patients showed increased expression of the proliferation signature indicative of dividing cells (Figure 2G) and low expression of the inflammatory signature (Figure 2D), labeled diffuse 1 (blue) and diffuse 2 (red, showing a more prominent proliferation signature)(Whitfield et al., 2002). Genes associated with this subset are enriched for the GO biological processes of mitosis, m-phase of the mitotic cell cycle, chromosome segregation (p ≤ 0.001), and DNA metabolic process (p ≤ 0.05). These include the cell cycle-regulators CDCA8, CDC2, the kinesins KIF2C, KIF11, and cyclins CCNB2 and CCNB1.
Pathways more prominent in this study than seen previously include fatty acid metabolism (Milano et al.2008), with increased expression in the normal-like and diffuse 1 subsets (Figure 2C). Enriched GO Biological processes included lipid metabolism and fatty acid metabolism (p ≤ .001) include the peroxisome proliferation activated receptor gamma (PPAR-γ) coactivator alpha 1 gene. A group of genes with related function, but a different expression pattern centers on PPAR-γ gene expression (Figure 2F) (Wei et al.2010). Genes within this PPAR-γ pathway related group include several PPAR-γ target genes: CD36, (Huang et al., 2004), lipoprotein lipase (LPL) (Schoonjans et al., 1996), stearoyl-CoA desaturase (SCD) (Vondrichova et al., 2007), and Catalase (CAT) (Girnun et al., 2002).
We summarized the differentially regulated biological pathways by averaging the genes associated with each (Supplemental Material; Supplemental Figure S3-S4). We observe an increase in pathways associated with immune system activation (Supp. Fig. S3A) and an increase in gene expression associated with B cells, CD8+ T cells, leukocytes, macrophages and IFN treated keratinocytes and fibroblasts (Supp. Fig. S3B). The diffuse 2 subset showed an increase in cell cycle-related processes, decreases in cholesterol, steroid and fatty acid metabolism, as well as enrichment of genes associated with activated PBMCs, TNFalpha treated keratinocytes, T cells and dendritic cells (Supp. Fig. S3A–B). The normal-like and diffuse 1 group showed a decrease in immune activation and increases in lipid metabolism.
Intrinsic gene expression groups are stable over time
Two results from this study suggest the intrinsic subsets are not dependent on disease duration. The four major intrinsic subsets identified in our previous study, which had variable and longer disease duration (Milano et al.2008) were also found in this study cohort, all of these patients having early stage disease (Supplemental Figure S5A). If the subsets were dependent on disease duration then we would expect a skewing toward the early subset in these data. In addition, there is no significant difference in disease duration between subsets measured here (Supplemental Figure S5B). Collectively, these findings indicate that gene expression subsets are an inherent feature of the clinical dSSc phenotype and that this feature is independent of disease duration.
Despite the consistent gene expression, MRSS did change in patients that provide longitudinal biopsies (Supplemental Figure S6). Seven of the 15 patients showed increases in skin score, two patients (RIT7 and RIT14) showed a decrease and the remaining six showed little change. In all cases, patients maintained a stable pattern of gene expression. The range of MRSS for patients in this dataset has a slightly broader distribution than the skin scores in Milano et al. (Supplemental Figure S5C). When lSSc patients are excluded, the MRSS of proliferative and inflammatory groups though broader in distributions are otherwise similar to our past study (Milano et al.2008) (Supplemental Figure S5C-D). The inflammatory group has the widest range of MRSS scores, while the normal-like group consistently shows lower MRSS scores in both datasets. Autoantibodies did not show a significant association with intrinsic subset (Supplemental Table 2). One Diffuse 1 patient was anti-scl70 positive (1/4; p=0.52, Fisher’s Exact Test), two inflammatory patients were anti-RNA Polymerase III positive (2/7; p=0.12), and three unclassified patients were anti-scl-70 positive (2/3; p=0.051) and anti-centromere positive (1/3; p=0.16) positive. Diffuse 2 patients were negative for all three measured autoantibodies (p=0.52).
Independent validation by Immunohistochemistry
To validate the mRNA expression, we analyzed proteins for COMP and IFITM3 in representative biopsies spanning the intrinsic subsets. Both showed highest expression in the inflammatory subset consistent with gene expression data (Figure 2D, Supplemental Figure S7). IHC staining results paralleled and confirmed the gene expression findings. COMP showed highest expression in the inflammatory subset and lowest in the diffuse 2 subset (p<0.05) with slightly higher expression in the diffuse 1 subset (Supplemental Figure S7A); protein staining was most prevalent in dermal fibroblasts of SSc patients of the inflammatory subset (Supplemental Figure S7C and G) while absent in controls (Supplemental Figure S7E). IFITM3 showed highest expression in both the inflammatory and diffuse 2 subsets (Supplemental Figure S7B) and lowest expression in the diffuse 1 subset (p<0.05) with staining around the microvasculature in the skin (Supplemental Figure S7D and H). These data confirm and extend the gene expression findings at the protein level.
Validation of the 995-gene intrinsic subset gene set
We next determined whether the 995 genes selected in our previous study could stratify the cohort of patients described here into the intrinsic subsets (Milano et al.2008) and thus could be developed into a classifier for subset stratification. 808 genes that passed basic quality filters were used to organize the samples by hierarchical clustering (Figure 3B), showing that 26 out of 31 dSSc skin biopsies from different anatomical sites or time points grouped together by patient (Figure 3A). The subsets identified previously are similar to those found here using the same set of genes ((Milano et al.2008), Figure 3C). The proliferation and inflammatory groups in the two datasets are indicated with the diffuse-proliferation groups in red and the inflammatory group in purple. Subsets of overlapping genes between the groups are indicated. The inflammatory signature is more prominent in the dataset presented here, whereas the proliferation signature is more prominent in our previous report (Milano et al.2008). Therefore, the original 995 genes can stratify an independent cohort into the intrinsic patient subsets.
Figure 3. Concordance between datasets.
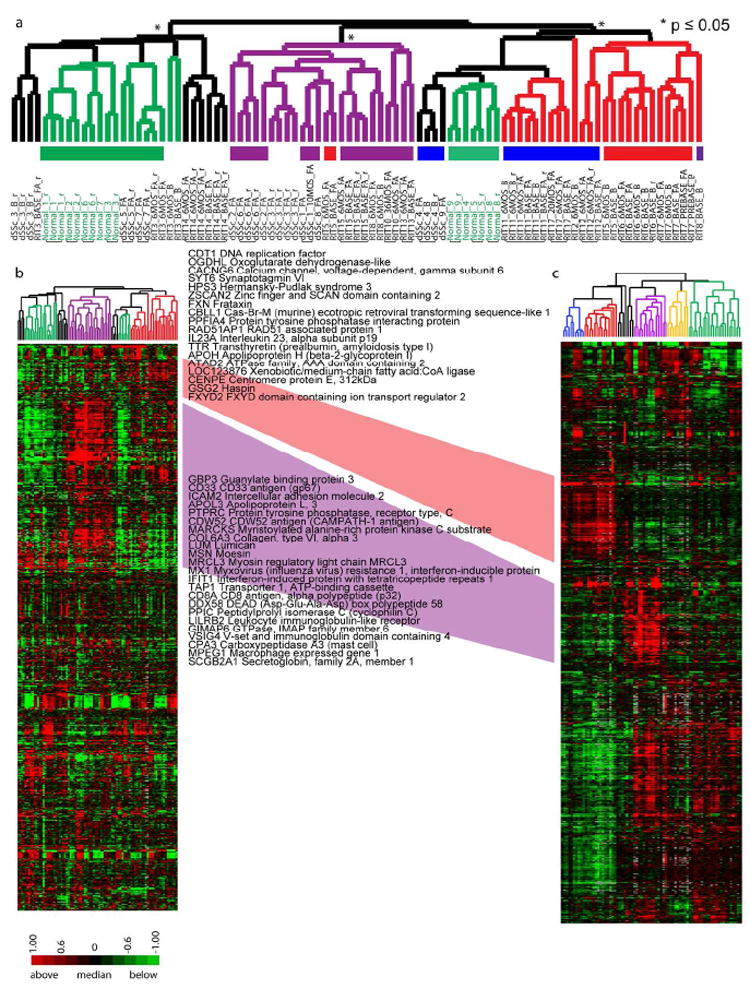
Hierarchical clustering of 808 genes that matched the 995 intrinsic genes from Milano et al (187 did not pass basic filtering criteria). A. Hierarchical clustering dendrogram shows normal-like (green), inflammatory (purple), diffuse-proliferation (diffuse 1 (blue) and diffuse 2 (red)), and limited groups (yellow). Significant branches are indicated (p ≤ 0.05, black asterisk; p ≤ 0.01, red asterisk). Black bars indicate subject samples that clustered together. B. Heat map for the 808 genes. C. Heat map of the original 995 ‘intrinsic’ genes in Milano et al. The diffuse-proliferation groups are between the two datasets are connected in red and the inflammatory groups connected in purple; genes found in the respective clusters of both datasets are indicated.
Surrogate gene biomarkers of MRSS
We previously reported a 177-gene expression signature that could serve as surrogate biomarker of MRSS (Milano et al.2008). We refined this by identifying 44 genes that were present in the 177-gene signature but also found in the intrinsic by patient analysis (Figure 2). Organizing the samples using these 44 genes revealed two major subdivisions of samples. One included both dSSc patients and healthy controls (Figure 4A, group 1) while the other included only dSSc patients (Figure 4A, group 2). Subjects in these groups showed a significant difference in mean MRSS (group 1: mean 17.92, standard deviation 11.61; Group 2: mean 25.90, standard deviation 8.52; p = 0.005; Figure 4B).
Figure 4. Surrogate gene expression biomarkers of MRSS.
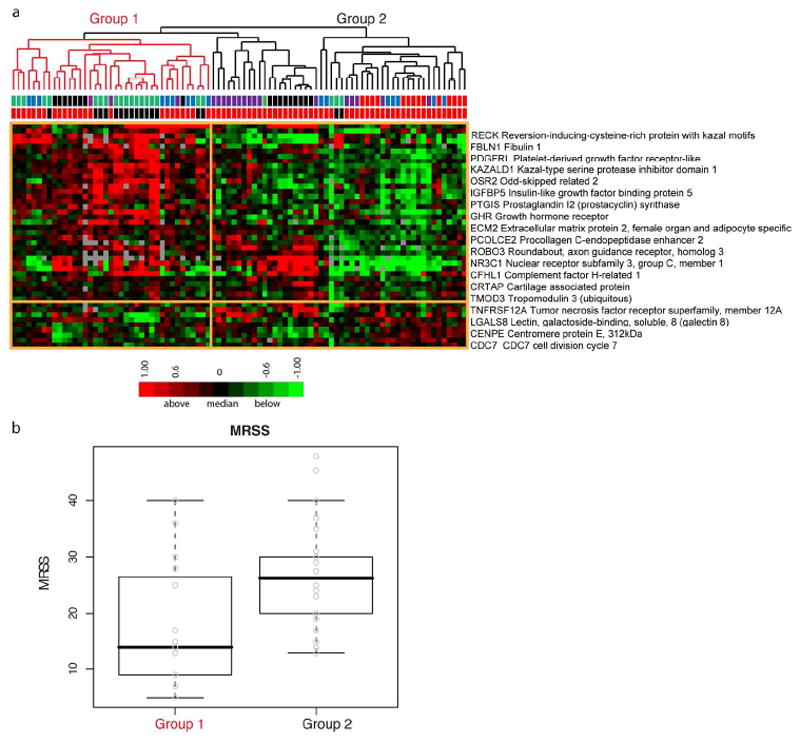
A. Probes that matched the 177 genes with correlations above |0.5| from Milano were extracted from the “by patient” intrinsic analysis resulting in 44 genes. Hierarchical clustering results in two groups. Group 1 (red branches) includes dSSc and healthy control skin biopsies, while group 2 (black branches) includes primarily dSSc skin biopsies. The first row below the dendrogram, bars indicate the intrinsic subset assignment in the ‘by patient’ analysis (normal-like, green; diffuse1, blue; diffuse2, red; inflammatory, purple; unclassified, black). The second row indicates sample diagnosis, dSSc (red) or healthy control (black). B. Comparison of MRSS between the two groups shows a statistically significant difference in MRSS (two sample t-test, p = 0.005).
Gene expression gradients are evident within a gene expression subset
To further power the analysis of SSc skin gene expression across time scales that cannot be easily captured with longitudinal biopsies, we combined the gene expression analyses from both this and our previous study (Milano et al.2008). The combined dataset includes skin biopsies from 39 patients with dSSc, 7 with lSSc, 3 with morphea, 1 patient with eosinophilic fasciitis, and skin biopsies from 15 healthy control subjects, totaling 121 biopsies. After Distance Weighted Discrimination (DWD) adjustment to remove systematic differences (Benito et al., 2004), intrinsic analysis was performed, 3551 probes selected (FDR 0.07%; Figure 5A), and the combined datsets clustered hierarchically. The two datasets recapitulated the major intrinsic subsets (Figure 5A). Gene expression in the ‘proliferative’ and ‘inflammatory’ groups both showed gradients of gene expression within their respective groups (Figure 5A). In the proliferation group the dendrogram split samples with high expression of the signature (‘Prolif 1’), and low expression (‘Prolif 2’). Similarly, the inflammatory group contained samples with high (‘Inflam 1’) and low (‘Inflam 2’) expression of the signature. To determine if the intensity of these signatures were associated with disease duration or MRSS, we compared the distributions between these two parameters within each group (Figure 6). The ‘Prolif 1’ group had a significantly longer disease duration (t-test, p = 0.0027) compared to ‘Prolif 2’ and a trend towards a higher MRSS (p < 0.05). In contrast, the ‘Inflam 2’ group, had a higher inflammatory gene expression signature, showed a significantly higher average MRSS (t-test, p = 0.016) with little difference in disease duration across the subgrouping. Thus, this analysis suggests that the gene expression within a group changes intensity with increased disease severity and/or duration.
Figure 5. Consistent classification and expression gradients within subsets.
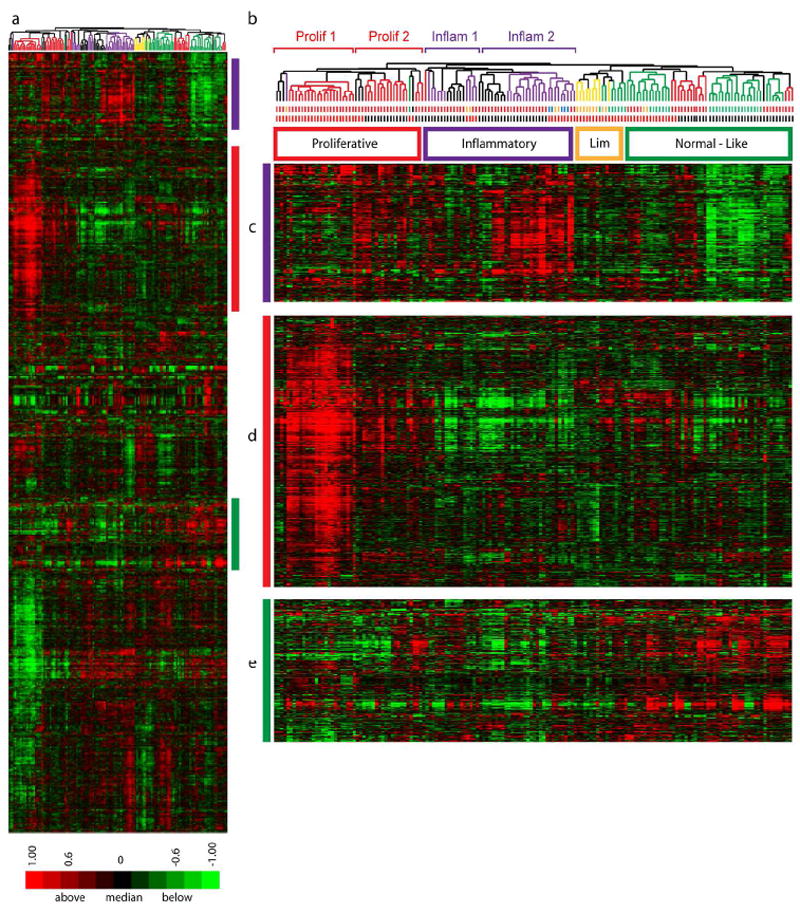
Data from this study and from Milano were merged to create a single dataset of 164 arrays. 3551 intrinsic genes were selected (FDR 0.07 %). A. Heat map of 2-dimensional hierarchical clustering. B. Clustering dendrogram with branches indicating the intrinsic subset each sample was assigned in the independent dataset analyses (proliferative (red), inflammatory (purple), limited (yellow), and normal-like (green)). The first row of bars below the dendrogram indicates patient diagnosis (dSSc, red; lSSc, yellow; Morphea and eosinophilic fasciitis, blue; healthy controls; green). The second row of bars indicates the dataset the samples were obtained: Milano, red; this study, black. C. Inflammatory cluster D. Proliferation cluster E. Fatty-Acid synthesis cluster.
Figure 6. Association between disease duration and MRSS within the proliferation and inflamatory subsets.
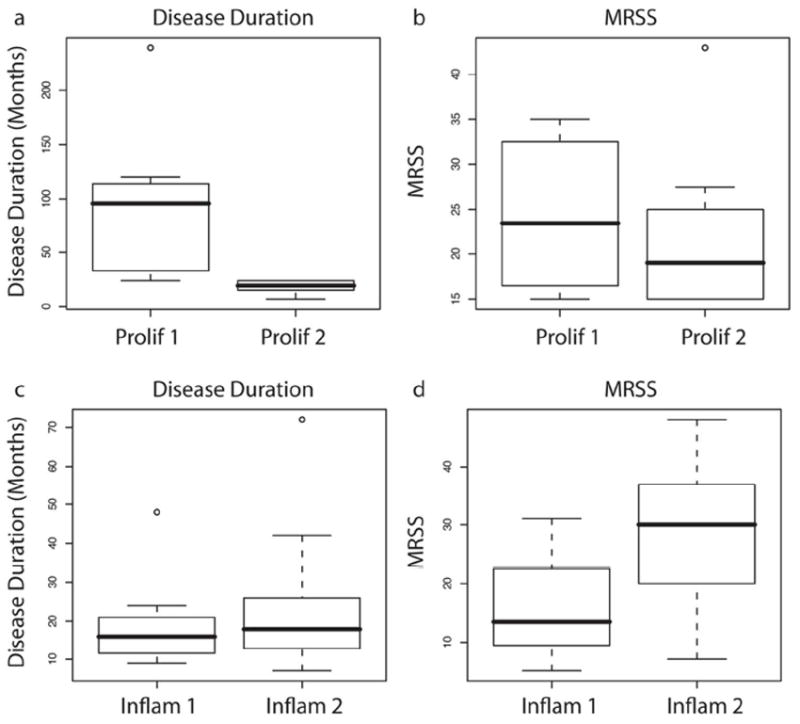
Above the dendrogram in Figure S6B, the ‘Prolif 1’, ‘Prolif 2’, ‘Inflam 1’ and ‘Inflam 2’ groups are indicated. These are groups showing differences in intensity of expression within the proliferative and inflammatory subsets. Differences in disease duration and MRSS between ‘Prolif 1’ and ‘Prolif 2’ (A and B), as well as between ‘Inflam 1’ and ‘Inflam 2’ are apparent (C and D).
Discussion
SSc is a progressive disease, with skin going through various phases that can begin with edema, then progressive fibrosis, and in some cases a skin softening late in the disease. Past studies have suggested that SSc skin pathology evolves from inflammatory to fibrotic changes over time (Fleischmajer et al., 1978; Fleischmajer et al., 1977; Kraling et al., 1995; Roumm et al., 1984). Our molecular analyses suggest that inflammatory changes in the skin are not part of an evolving process leading to fibrosis, but rather represent a subset of patients, with other patients having significantly less skin inflammation as part of the pathologic process. The data presented here indicate that the gene expression subsets are stable over time. We show that measuring gene expression of skin biopsies from patients at different time points consistently classifies the patients into the same intrinsic subsets. In addition, this data taken from a cohort of patients with shorter disease duration compared to our previous studies of patients with longer disease duration show the same disease subsets.
Strikingly, although patients do not appear to move between subsets over time, patients within inflammatory and particularly proliferative subsets show changes in the intensity of the signature associated with disease duration. Similar changes in intensity of gene expression was found in a study of limited SSc patients with and without PAH, suggesting that as disease becomes more severe the intensity of the changes increases (Pendergrass et al. 2010). Our data is consistent with previous observations that the expression of pro-fibrotic genes in non-lesional SSc fibroblasts tends to be intermediate between that observed in healthy and lesional SSc fibroblasts (Chen et al., 2005). Thus our data suggest that different biological processes may underpin dSSc pathogenesis in different patient subsets, and that the intensity of these processes change over time. Although we cannot exclude the possibility that analysis of serial biopsies over a longer period of time would show patients changing subsets, the data here support the notion that a patient could be assigned to a specific intrinsic subset early in their disease course. These observations then have the potential of suggesting treatments that block the immune response if a patient displays an inflammatory signature, or treatments that block fibrosis, if they posses a fibroproliferative signature. Thus, as the pathogenic mechanisms underlying intrinsic subsets are identified, patient subset identification might permit specific targeting of pathogenic processes. A TGFβ–responsive signature appears to drive at least in part pathogenesis in the diffuse-proliferative subset of patients (Sargent et al. 2010), emphasizing the contribution of this cytokine to the phenotype of SSc (Leask, 2009; Varga and Pasche, 2009) while IL-13 appears to play a key role in the inflammatory subset (Greenblatt et al., 2011).
This dataset recapitulates and validates our originally defined inflammatory, diffuse-proliferation, and normal-like subsets of SSc patients. The disease duration of the cohort analyzed here (< 2 years) is more homogeneous and more typical of when the disease is most actively progressing compared to our previous report. Despite these differences, the results show reproducibility of patient subsets in a completely new patient population from a different clinical center. The reproducibility and stability of these gene expression-based subsets confirms that they reflect fundamental underlying pathogenic processes that differ between patients in the different subsets, rather than stages in the progressive disease. The addition of more serial biopsies covering a larger span of time, coupled with longitudinal clinical data, should provide prognostic information for patients in each group.
A subset of patients in this analysis were treated with rituximab, a monoclonal antibody that depletes mature B cells. In that open-label trial of rituximab, patients did not show a significant change in skin score, pulmonary function or other measures of organ involvement, although immunohistochemistry showed depletion of both peripheral and skin resident B-cells (Lafyatis et al., 2009). Several other unblinded clinical trials have suggested some potential beneficial effect of rituximab on skin and/or lung disease in patients with SSc (Bosello et al.; Daoussis et al.; Smith et al.; Wesson et al., 2008). Rituximab may prove to have value in SSc, and it is particularly intriguing to consider its potential efficacy in SSc-associated interstitial lung disease where B cell infiltration is often quite prominent (Lafyatis et al., 2007). However our studies here are consistent with our clinical trial results suggesting no or modest effect on skin disease. We therefore believe that rituximab is more likely to show efficacy for SSc-associated interstitial lung disease and that lung disease would be a better target for a large-scale trial of B cell depletion.
Comparing the results of Chung et al. who reported two patients with dSSc that showed a response to treatment with imatinib mesylate (Chung et al., 2009), with the results reported here in rituximab-treated patients suggests that when a clinical response is evident, one is also likely to find a gene expression response. Thus, gene expression may be useful as a surrogate outcome measure and for stratifying likely patient responders in clinical trials. Since the patients with an inflammatory signature do not go on to display a fibroproliferative signature, and vice versa, it is essential to target patients with a therapy that is appropriate to their gene expression signature. Therefore, it will be imperative to identify patient subsets in clinical trials as drugs may target only those in a single subset.
MATERIALS AND METHODS
Patient Selection, Biopsy Processing and Microarray hybridization
All study participants gave informed consent under Boston University Medical Center Institutional Review Board an approved protocol. Forearm lesional skin, and for a subset of patients, non-lesional back skin were collected by punch biopsies (3-6 mm) from 13 patients enrolled in the rituximab study (Lafyatis et al., 2009), as well as from 9 additional patients with early dSSc (less than 1.5 years from diagnosis). A total of 60 skin biopsies were collected from 22 patients with dSSc and 9 healthy controls (Supplemental Tables 1 and 2). RNA purification and microarray hybridization was carried out essentially as described (Milano et al.2008). Detailed methodology is provided in supplemental text.
Bioinformatic and Statistical analyses
Intrinsic gene analysis was carried out as previously described (Supplemental material; (Milano et al.2008)). Gene expression data was organized by average linkage hierarchically clustering using Cluster 3.0 and visualized using Java TreeView. Significance of clustering was determined by Statistical Significance of Clustering (SigClust)(Liu et al., 2008). Enriched GO biological processes were determined using The Database for Annotation, Visualization, and Integrated Discovery (DAVID) (Huang da et al., 2007)(Supplementary DataFile S5). Module maps were created with Genomica. Correlation between gene expression and clinical parameters were calculated using Matlab. Statistics were done using R. Distance Weighted Discrimination (DWD) was performed utilizing the java implementation of DWD analysis (Benito et al., 2004). Gene expression data from this study is available from GEO (accession number GSE32413).
Supplementary Material
Acknowledgments
This work was supported by NIH grant U01-AR055063 to RL and MLW, and by a grant from the Scleroderma Research Foundation to MLW. MLW is a Hulda Irene Duggan Arthritis Investigator. SAP was supported by the NIAMS Autoimmunity and Connective Tissue Training Grant T32 AR007575-11 and by funds from the Arthritis Foundation.
Footnotes
Conflict of Interest Disclosure Michael L. Whitfield, Robert Lafyatis and Sarah A. Pendergrass have filed patent applications for gene expression biomarkers in scleroderma. Michael L. Whitfield is a scientific founder and holds an interest in Celdara Medical, LLC, that is aiming to translate these discoveries into clinical use.
References
- Barnett AJ, Miller MH, Littlejohn GO. A survival study of patients with scleroderma diagnosed over 30 years (1953-1983): the value of a simple cutaneous classification in the early stages of the disease. J Rheumatol. 1988;15:276–283. [PubMed] [Google Scholar]
- Benito M, Parker J, Du Q, Wu J, Xiang D, Perou CM, et al. Adjustment of systematic microarray data biases. Bioinformatics. 2004;20:105–114. doi: 10.1093/bioinformatics/btg385. [DOI] [PubMed] [Google Scholar]
- Bosello S, De Santis M, Lama G, Spano C, Angelucci C, Tolusso B, et al. B cell depletion in diffuse progressive systemic sclerosis: safety, skin score modification and IL-6 modulation in an up to thirty-six months follow-up open-label trial. Arthritis Res Ther. 2010;12:R54. doi: 10.1186/ar2965. [DOI] [PMC free article] [PubMed] [Google Scholar]
- Chen Y, Shi-Wen X, van Beek J, Kennedy L, McLeod M, Renzoni EA, et al. Matrix contraction by dermal fibroblasts requires transforming growth factor-beta/activin-linked kinase 5, heparan sulfate-containing proteoglycans, and MEK/ERK: insights into pathological scarring in chronic fibrotic disease. Am J Pathol. 2005;167:1699–1711. doi: 10.1016/s0002-9440(10)61252-7. [DOI] [PMC free article] [PubMed] [Google Scholar]
- Chifflot H, Fautrel B, Sordet C, Chatelus E, Sibilia J. Incidence and prevalence of systemic sclerosis: a systematic literature review. Semin Arthritis Rheum. 2008;37:223–235. doi: 10.1016/j.semarthrit.2007.05.003. [DOI] [PubMed] [Google Scholar]
- Chung L, Fiorentino DF, Benbarak MJ, Adler AS, Mariano MM, Paniagua RT, et al. Molecular framework for response to imatinib mesylate in systemic sclerosis. Arthritis Rheum. 2009;60:584–591. doi: 10.1002/art.24221. [DOI] [PMC free article] [PubMed] [Google Scholar]
- Daoussis D, Liossis SN, Tsamandas AC, Kalogeropoulou C, Kazantzi A, Sirinian C, et al. Experience with rituximab in scleroderma: results from a 1-year, proof-of-principle study. Rheumatology (Oxford) 2010;49:271–280. doi: 10.1093/rheumatology/kep093. [DOI] [PMC free article] [PubMed] [Google Scholar]
- Fleischmajer R, Gay S, Meigel WN, Perlish JS. Collagen in the cellular and fibrotic stages of scleroderma. Arthritis Rheum. 1978;21:418–428. doi: 10.1002/art.1780210404. [DOI] [PubMed] [Google Scholar]
- Fleischmajer R, Perlish JS, West WP. Ultrastructure of cutaneous cellular infiltrates in scleroderma. Arch Dermatol. 1977;113:1661–1666. [PubMed] [Google Scholar]
- Gardner H, Shearstone JR, Bandaru R, Crowell T, Lynes M, Trojanowska M, et al. Gene profiling of scleroderma skin reveals robust signatures of disease that are imperfectly reflected in the transcript profiles of explanted fibroblasts. Arthritis Rheum. 2006;54:1961–1973. doi: 10.1002/art.21894. [DOI] [PubMed] [Google Scholar]
- Girnun GD, Domann FE, Moore SA, Robbins ME. Identification of a functional peroxisome proliferator-activated receptor response element in the rat catalase promoter. Mol Endocrinol. 2002;16:2793–2801. doi: 10.1210/me.2002-0020. [DOI] [PubMed] [Google Scholar]
- Greenblatt MB, Sargent JL, Farina G, Tsang K, Lafyatis R, Glimcher LH, et al. Interspecies comparison of human and murine Scleroderma reveals IL13 and CCL2 as disease subset specific targets. Am J Pathol. 2011 doi: 10.1016/j.ajpath.2011.11.024. In Press. [DOI] [PMC free article] [PubMed] [Google Scholar]
- Huang da W, Sherman BT, Tan Q, Collins JR, Alvord WG, Roayaei J, et al. The DAVID Gene Functional Classification Tool: a novel biological module-centric algorithm to functionally analyze large gene lists. Genome Biol. 2007;8:R183. doi: 10.1186/gb-2007-8-9-r183. [DOI] [PMC free article] [PubMed] [Google Scholar]
- Huang H, Campbell SC, Bedford DF, Nelius T, Veliceasa D, Shroff EH, et al. Peroxisome proliferator-activated receptor gamma ligands improve the antitumor efficacy of thrombospondin peptide ABT510. Mol Cancer Res. 2004;2:541–550. [PubMed] [Google Scholar]
- Jimenez SA, Hitraya E, Varga J. Pathogenesis of scleroderma. Collagen. Rheum Dis Clin North Am. 1996;22:647–674. doi: 10.1016/s0889-857x(05)70294-5. [DOI] [PubMed] [Google Scholar]
- Kraling BM, Maul GG, Jimenez SA. Mononuclear cellular infiltrates in clinically involved skin from patients with systemic sclerosis of recent onset predominantly consist of monocytes/macrophages. Pathobiology. 1995;63:48–56. doi: 10.1159/000163933. [DOI] [PubMed] [Google Scholar]
- Lafyatis R, Kissin E, York M, Farina G, Viger K, Fritzler MJ, et al. B cell depletion with rituximab in patients with diffuse cutaneous systemic sclerosis. Arthritis Rheum. 2009;60:578–583. doi: 10.1002/art.24249. [DOI] [PMC free article] [PubMed] [Google Scholar]
- Lafyatis R, O’Hara C, Feghali-Bostwick CA, Matteson E. B cell infiltration in systemic sclerosis-associated interstitial lung disease. Arthritis Rheum. 2007;56:3167–3168. doi: 10.1002/art.22847. [DOI] [PubMed] [Google Scholar]
- Leask A. Signaling in fibrosis: targeting the TGF beta, endothelin-1 and CCN2 axis in scleroderma. Front Biosci (Elite Ed) 2009;1:115–122. doi: 10.2741/E12. [DOI] [PubMed] [Google Scholar]
- Liu T, Zhang J. Detection of V, III and I type collagens of dermal tissues in skin lesions of patients with systemic sclerosis and its implication. J Huazhong Univ Sci Technolog Med Sci. 2008;28:599–603. doi: 10.1007/s11596-008-0525-7. [DOI] [PubMed] [Google Scholar]
- Liu Y, Hayes DN, Nobel A, Marron JS. Statistical Significance of Clustering for High-Dimension, Low-Sample Size Data. Journal of the American Statistical Association. 2008;103:1281–1293. [Google Scholar]
- Mayes MD. Scleroderma epidemiology. Rheum Dis Clin North Am. 2003;29:239–254. doi: 10.1016/s0889-857x(03)00022-x. [DOI] [PubMed] [Google Scholar]
- Mayes MD, Lacey JV, Jr, Beebe-Dimmer J, Gillespie BW, Cooper B, Laing TJ, et al. Prevalence, incidence, survival, and disease characteristics of systemic sclerosis in a large US population. Arthritis Rheum. 2003;48:2246–2255. doi: 10.1002/art.11073. [DOI] [PubMed] [Google Scholar]
- Milano A, Pendergrass SA, Sargent JL, George LK, McCalmont TH, Connolly MK, et al. Molecular subsets in the gene expression signatures of scleroderma skin. PLoS ONE. 2008;3:e2696. doi: 10.1371/journal.pone.0002696. [DOI] [PMC free article] [PubMed] [Google Scholar]
- Pendergrass SA, Hayes E, Farina G, Lemaire R, Farber HW, Whitfield ML, et al. Limited systemic sclerosis patients with pulmonary arterial hypertension show biomarkers of inflammation and vascular injury. PLoS ONE. 2010;5 doi: 10.1371/journal.pone.0012106. [DOI] [PMC free article] [PubMed] [Google Scholar]
- Ramirez F, Tanaka S, Bou-Gharios G. Transcriptional regulation of the human alpha2(I) collagen gene (COL1A2), an informative model system to study fibrotic diseases. Matrix Biol. 2006;25:365–372. doi: 10.1016/j.matbio.2006.05.002. [DOI] [PubMed] [Google Scholar]
- Roumm AD, Whiteside TL, Medsger TA, Jr, Rodnan GP. Lymphocytes in the skin of patients with progressive systemic sclerosis. Quantification, subtyping, and clinical correlations. Arthritis Rheum. 1984;27:645–653. doi: 10.1002/art.1780270607. [DOI] [PubMed] [Google Scholar]
- Sargent JL, Milano A, Bhattacharyya S, Varga J, Connolly MK, Chang HY, et al. A TGFbeta-Responsive Gene Signature Is Associated with a Subset of Diffuse Scleroderma with Increased Disease Severity. J Invest Dermatol. 2009 doi: 10.1038/jid.2009.318. [DOI] [PMC free article] [PubMed] [Google Scholar]
- Schoonjans K, Peinado-Onsurbe J, Lefebvre AM, Heyman RA, Briggs M, Deeb S, et al. PPARalpha and PPARgamma activators direct a distinct tissue-specific transcriptional response via a PPRE in the lipoprotein lipase gene. EMBO J. 1996;15:5336–5348. [PMC free article] [PubMed] [Google Scholar]
- Scussel-Lonzetti L, Joyal F, Raynauld JP, Roussin A, Rich E, Goulet JR, et al. Predicting mortality in systemic sclerosis: analysis of a cohort of 309 French Canadian patients with emphasis on features at diagnosis as predictive factors for survival. Medicine (Baltimore) 2002;81:154–167. doi: 10.1097/00005792-200203000-00005. [DOI] [PubMed] [Google Scholar]
- Smith V, Van Praet JT, Vandooren B, Van der Cruyssen B, Naeyaert JM, Decuman S, et al. Rituximab in diffuse cutaneous systemic sclerosis: an open-label clinical and histopathological study. Ann Rheum Dis. 2010;69:193–197. doi: 10.1136/ard.2008.095463. [DOI] [PubMed] [Google Scholar]
- Varga J, Jimenez SA. Modulation of collagen gene expression: its relation to fibrosis in systemic sclerosis and other disorders. Ann Intern Med. 1995;122:60–62. doi: 10.7326/0003-4819-122-1-199501010-00010. [DOI] [PubMed] [Google Scholar]
- Varga J, Pasche B. Transforming growth factor beta as a therapeutic target in systemic sclerosis. Nat Rev Rheumatol. 2009;5:200–206. doi: 10.1038/nrrheum.2009.26. [DOI] [PMC free article] [PubMed] [Google Scholar]
- Vondrichova T, de Capretz A, Parikh H, Frenander C, Asman P, Aberg M, et al. COX-2 and SCD, markers of inflammation and adipogenesis, are related to disease activity in Graves’ ophthalmopathy. Thyroid. 2007;17:511–517. doi: 10.1089/thy.2007.0028. [DOI] [PubMed] [Google Scholar]
- Wei J, Ghosh AK, Sargent JL, Komura K, Wu M, Huang QQ, et al. PPARgamma downregulation by TGFss in fibroblast and impaired expression and function in systemic sclerosis: a novel mechanism for progressive fibrogenesis. PLoS ONE. 2010;5:e13778. doi: 10.1371/journal.pone.0013778. [DOI] [PMC free article] [PubMed] [Google Scholar]
- Wesson RN, Sparaco A, Smith MD. Chronic pancreatitis in a patient with malnutrition due to anorexia nervosa. JOP. 2008;9:327–331. [PubMed] [Google Scholar]
- Whitfield ML, Finlay DR, Murray JI, Troyanskaya OG, Chi JT, Pergamenschikov A, et al. Systemic and cell type-specific gene expression patterns in scleroderma skin. Proc Natl Acad Sci U S A. 2003;100:12319–12324. doi: 10.1073/pnas.1635114100. [DOI] [PMC free article] [PubMed] [Google Scholar]
- Whitfield ML, Sherlock G, Saldanha AJ, Murray JI, Ball CA, Alexander KE, et al. Identification of genes periodically expressed in the human cell cycle and their expression in tumors. Mol Biol Cell. 2002;13:1977–2000. doi: 10.1091/mbc.02-02-0030.. [DOI] [PMC free article] [PubMed] [Google Scholar]
- Falini B, Pileri S, Pizzolo G, Durkop H, Flenghi L, Stirpe F, et al. CD30 (Ki-1) molecule: a new cytokine receptor of the tumor necrosis factor receptor superfamily as a tool for diagnosis and immunotherapy. Blood. 1995;85:1–14. [PubMed] [Google Scholar]
- Farina G, Lemaire R, Pancari P, Bayle J, Widom RL, Lafyatis R. Cartilage oligomeric matrix protein expression in systemic sclerosis reveals heterogeneity of dermal fibroblast responses to transforming growth factor beta. Ann Rheum Dis. 2009;68:435–441. doi: 10.1136/ard.2007.086850. [DOI] [PubMed] [Google Scholar]
- Haider AS, Lowes MA, Suarez-Farinas M, Zaba LC, Cardinale I, Blumenberg M, et al. Cellular genomic maps help dissect pathology in human skin disease. J Invest Dermatol. 2008;128:606–615. doi: 10.1038/sj.jid.5701067. [DOI] [PubMed] [Google Scholar]
- Huang da W, Sherman BT, Tan Q, Collins JR, Alvord WG, Roayaei J, et al. The DAVID Gene Functional Classification Tool: a novel biological module-centric algorithm to functionally analyze large gene lists. Genome Biol. 2007;8:R183. doi: 10.1186/gb-2007-8-9-r183. [DOI] [PMC free article] [PubMed] [Google Scholar]
- Lafyatis R, Kissin E, York M, Farina G, Viger K, Fritzler MJ, et al. B cell depletion with rituximab in patients with diffuse cutaneous systemic sclerosis. Arthritis Rheum. 2009;60:578–583. doi: 10.1002/art.24249. [DOI] [PMC free article] [PubMed] [Google Scholar]
- Milano A, Pendergrass SA, Sargent JL, George LK, McCalmont TH, Connolly MK, et al. Molecular subsets in the gene expression signatures of scleroderma skin. PLoS ONE. 2008;3:e2696. doi: 10.1371/journal.pone.0002696. [DOI] [PMC free article] [PubMed] [Google Scholar]
- Palmer C, Diehn M, Alizadeh AA, Brown PO. Cell-type specific gene expression profiles of leukocytes in human peripheral blood. BMC Genomics. 2006;7:115. doi: 10.1186/1471-2164-7-115. [DOI] [PMC free article] [PubMed] [Google Scholar]
- Perou CM, Sorlie T, Eisen MB, van de Rijn M, Jeffrey SS, Rees CA, et al. Molecular portraits of human breast tumours. Nature. 2000;406:747–752. doi: 10.1038/35021093. [DOI] [PubMed] [Google Scholar]
- Samstag Y, Klemke M. Ectopic expression of L-plastin in human tumor cells: diagnostic and therapeutic implications. Adv Enzyme Regul. 2007;47:118–126. doi: 10.1016/j.advenzreg.2006.12.008. [DOI] [PubMed] [Google Scholar]
- Sorlie T, Perou CM, Tibshirani R, Aas T, Geisler S, Johnsen H, et al. Gene expression patterns of breast carcinomas distinguish tumor subclasses with clinical implications. Proc Natl Acad Sci U S A. 2001;98:10869–10874. doi: 10.1073/pnas.191367098. [DOI] [PMC free article] [PubMed] [Google Scholar]
- Tusher VG, Tibshirani R, Chu G. Significance analysis of microarrays applied to the ionizing radiation response. Proc Natl Acad Sci U S A. 2001;98:5116–5121. doi: 10.1073/pnas.091062498. [DOI] [PMC free article] [PubMed] [Google Scholar]
- Whitfield ML, Sherlock G, Saldanha AJ, Murray JI, Ball CA, Alexander KE, et al. Identification of genes periodically expressed in the human cell cycle and their expression in tumors. Mol Biol Cell. 2002;13:1977–2000. doi: 10.1091/mbc.02-02-0030.. [DOI] [PMC free article] [PubMed] [Google Scholar]
Associated Data
This section collects any data citations, data availability statements, or supplementary materials included in this article.