Abstract
During renal fibrogenesis, tubular epithelial-mesenchymal transition is closely associated with peritubular inflammation; however, it is not clear whether these two processes are connected. We previously identified the inhibitor of differentiation-1 (Id1), a dominant negative antagonist of basic helix-loop-helix transcription factors, as a major trigger of tubular cell dedifferentiation after injury. Id1 was induced selectively in degenerated proximal tubule and collecting duct epithelia after injury and was present in both the cytoplasm and nucleus, suggesting shuttling between these two compartments. Interestingly, the upregulation of Id1 was associated with peritubular inflammation in mouse and human nephropathies. In vitro, Id1 potentiated NF-κB signaling and augmented RANTES expression in kidney epithelial cells, which led to an enhanced recruitment of inflammatory cells. Id1 also induced Snail1 expression and triggered tubular epithelial dedifferentiation. In vivo, genetic ablation of Id1 in mice reduced peritubular inflammation and decreased tubular expression of RANTES following ureteral obstruction. Mice lacking Id1 were also protected against myofibroblast activation and matrix expression, leading to a reduced total collagen deposition in obstructive nephropathy. Thus, these results indicate that Id1 shuttles between nucleus and cytoplasm and promotes peritubular inflammation and tubular epithelial dedifferentiation, suggesting that these two events are intrinsically coupled during renal fibrogenesis.
Keywords: Id1, EMT, inflammation, renal fibrosis, TGF-β1
Introduction
Renal tubulointerstitial fibrosis (TIF) is often regarded as the final outcome of a wide range of progressive chronic kidney diseases. The pathogenesis of TIF is characterized by chronic peritubular inflammation, tubular cell dedifferentiation and epithelial-mesenchymal transition (EMT), and myofibroblast activation.1–4 These events ultimately lead to an over-production and excessive deposition of extracellular matrix (ECM), and destruction of the fine architecture of kidney parenchyma. It is generally believed that after a variety of insults, the injured tubular epithelia produce and secrete a host of chemokines, which trigger peritubular infiltration of inflammatory cells.5–8 The inflamed milieus, in turn, set up local microenvironment with high level of fibrogenic cytokines that drives epithelial cell dedifferentiation, EMT and tubular atrophy.9–12 In many respects, inflammatory infiltration and EMT constitute a vicious circuit of peritubular inflammation, tubular cell dedifferentiation and interstitial fibrosis.10, 13 However, whether peritubular inflammation and EMT are intrinsically coupled at molecular level is enigmatic.
Tubular EMT is an orchestrated, highly regulated process in which tubular cell dedifferentiation, characterized by loss of the epithelial cell adhesion receptor E-cadherin, is an early event.14, 15 Using gene expression microarray profiling, we previously identified the inhibitor of differentiation-1 (Id1), a dominant negative antagonist of the basic helix-loop-helix (bHLH) transcription factors,16 as a major trigger for tubular cell dedifferentiation after injury. Id1 expression is rapidly induced in the obstructed kidneys as early as 1 day after unilateral ureteral obstruction (UUO).17 Ectopic expression of Id1 in tubular epithelial cells represses the expression of E-cadherin and tight-junction protein zonula occludens-1 (ZO-1). Mechanistically, Id1 physically binds to the basic helix-loop-helix transcription factor HEB, and sequesters its ability to trans-activate E-cadherin promoter.16–18 Id1 protein in the obstructed kidneys is selectively upregulated in the degenerated tubules with a dilated lumen, consistent with its role in mediating tubular epithelial cell dedifferentiation.17 Somewhat surprisingly, Id1 is predominantly localized in the cytoplasm of the injured kidney epithelial cells in vivo, as demonstrated by an indirect immuofluorescence staining.17 This seems contradictory to its perceived function as a nuclear transcriptional antagonist that represses E-cahderin and ZO-1 gene expression. This paradox prompted us to further investigate the subcellular localization of Id1 and to explore any unrecognized functions of this protein in the pathogenesis of renal fibrosis.
Here we show that Id1 is present in both the nucleus and cytoplasm of tubular epithelial cells, and it undergoes nucleo-cytoplasmic shuttling. In addition to acting as transcriptional antagonist in the nucleus, cytoplasmic Id1 is able to promote NF-κB signaling and chemokine expression, and facilitate peritubular inflammation. Mice with Id1 deficiency are protected against renal inflammatory infiltration and interstitial fibrosis. Our results establish that Id1, as a single molecule, concomitantly promotes both epithelial cell dedifferentiation and peritubular inflammation, thereby providing an intrinsic, molecular link between two pathogenic events in renal fibrogenesis.
Results
Tubular segment-specific induction of Id1 in fibrotic kidneys
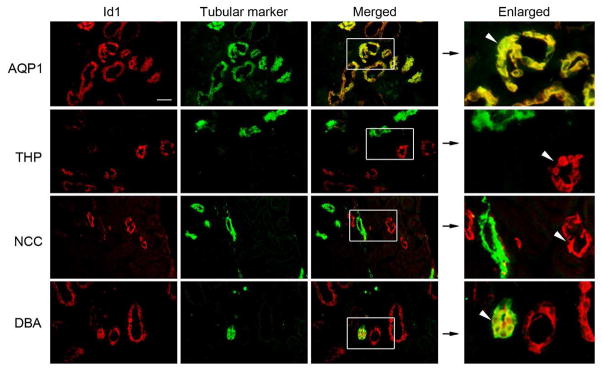
Earlier studies indicate that Id1 is specifically induced in renal tubular epithelia after obstructive injury by immuofluorescence staining.17 To further identify the tubular segments that express Id1, we carried out double-immunostaining for Id1 and various segment-specific tubular markers. As shown in Figure 1, co-localization of Id1 and aquaporin-1 (proximal tubular marker) was clearly evident in the obstructed kidneys at 7 days after unilateral ureteral obstruction (UUO), suggesting a proximal tubule-specific induction of Id1 after kidney injury. Of note, no or little Id1 staining was observed in normal kidneys of the sham-operated mice (data not shown), as previously reported.17 Interestingly, there was no co-localization of Id1 and Tamm-Horsfall glycoprotein (THP), also known as uromodulin, a marker for the cortical thick ascending limb of the loop of Henle. Similarly, Id1 was not found in the distal convoluted tubules of the obstructed kidneys, as it did not co-localize with thiazide-sensitive NaCl cotransporter (TSC)/NCC, a specific marker for that tubular segment (Figure 1). Id1, however, was co-stained with renal collecting duct marker, fluorescein-labeled Dolichos Biflorus agglutinin (DBA) (Figure 1). Together, it becomes clear that Id1 induction in the fibrotic kidneys takes place in a tubular segment-specific fashion.
Figure 1. Id1 is induced in a tubular segment-specific fashion after injury.
Immunofluorescence staining demonstrated Id1 (red) and various tubular markers (green) in the obstructed kidneys at 7 days after UUO. No or little Id1 expression was detected in the sham-operated normal kidneys (data not shown). Segment-specific tubular markers used are as follows: proximal tubule, aquaporin-1 (AQP1); cortical thick ascending limb, Tamm-Horsfall glycoprotein (THP); distal tubule, thiazide-sensitive NaCl cotransporter (TSC)/NCC; and collecting duct, fluorescein-labeled Dolichos Biflorus agglutinin (DBA). Boxed areas are enlarged. Arrowheads indicate Id1-positive tubules. Scale bar, 50 μm.
Id1 was induced in cultured human proximal tubular epithelial cells (HKC-8) in vitro after incubation with TGF-β1, as previously reported,17 suggesting that proximal tubular cells in vitro can recapitulate in vivo responses to injury. In view of the in vivo data (Figure 1), we also examined whether TGF-β1 regulates Id1 expression in renal collecting duct epithelia as well in vitro. To this end, mouse inner medullary collecting duct epithelial cells (mIMCD-3) were incubated with TGF-β1, and then assessed for Id1 expression. As shown in Supplementary Figure 1, TGF-β1 induced Id1 mRNA and protein expression in mIMCD-3 cells as well, as demonstrated by real-time RT-PCR and Western blot analyses, respectively.
Id1 undergoes nucleo-cytoplasmic shuttling
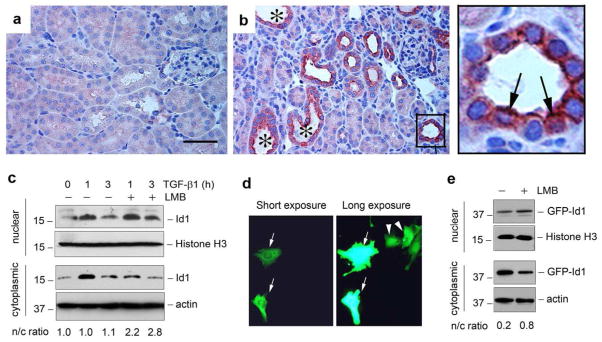
Immunostaining revealed that Id1 was localized predominantly in the cytoplasm of renal tubular epithelia after obstructive injury (Figure 1). To further clarify this issue, we utilized immunohistochemical staining, an approach with better morphological resolution, to examined Id1 subcellular localization. As shown in Figure 2, a and b, Id1 was selectively upregulated merely in the degenerated tubules with dilated lumens, but not in the morphologically intact tubules after UUO (Figure 2b). Higher magnification of the image revealed a clear cytoplasmic and nuclear localization of Id1 protein in the injured tubular epithelium (Figure 2, arrows in the enlarged box area).
Figure 2. Id1 is induced in both cytoplasm and nuclei of renal tubular epithelial cells in the injured kidneys.
(a, b) Immunohistochemical staining shows Id1 induction in the degenerated tubules after obstructive injury. (a), sham. (b), UUO for 7 days. Id1 induction was observed in the degenerated tubules with dilated lumen (*). Boxed area in Panel (b) was enlarged. Arrows indicate the tubular epithelial cells with both cytoplasmic and nuclear staining for Id1. Scale bar, 50 μm. (c) Western blot analyses demonstrate the presence of both cytoplasmic and nuclear Id1 protein. Human kidney tubular epithelial cells (HKC-8) were treated with or without TGF-β1 (2 ng/ml) in the absence or presence of leptomycin B (LMB) as indicated. Cytoplasmic and nuclear protein were prepared and immunoblotted with antibodies against Id1, histone H3 or actin, respectively. The ratio of nuclear/cytoplasmic Id1 (n/c ratio) was calculated and presented in the bottom of Panel (c). (d) Subcellular localization of the GFP-Id1 fusion protein. HKC-8 cells were transfected with GFP-Id1 expression vector. Two images in the same area with different exposure times are shown. Arrows show the cytoplasmic localization of GFP-Id1, while arrowheads denote a predominant nuclear location. (e) Nucleocytoplasmic shuttling of GFP-Id1 fusion protein. HKC-8 cells were transfected with GFP-Id1 expression vector, followed by incubation with or without LMB as indicated. Cytoplasmic and nuclear proteins were immunoblotted with different antibodies as indicated. The ratio of nuclear/cytoplasmic Id1 (n/c ratio) was given in the bottom of Panel (e).
To further address the Id1 subcellular localization, we used a biochemical approach to detect cytoplasmic and nuclear Id1 protein in HKC-8 cells after subcellular fractionation. As shown in Figure 2c, Id1 protein was detectable in both cytoplasm and the nuclei under basal conditions. Upon TGF-β1 stimulation, Id1 was markedly and transiently induced in HKC-8 cells. Notably, the ratio of nuclear versus cytoplasmic Id1 did not substantially change after TGF-β1 treatment. Incubation of HKC-8 cells with leptomycin B, an inhibitor of the nuclear export receptor CRM1 (chromosomal region maintenance 1),19 also known as exportin 1, resulted in a decrease of Id1 in the cytoplasm, accompanied by a concomitant increase in the nuclei (Figure 2c), suggesting that the nuclear export receptor CRM1 mediates the cytoplasmic localization of Id1 in tubular epithelial cells.
We also investigated the Id1 subcellular localization by genetically tagging the Id1 with GFP. To this end, an expression vector encoding GFP-Id1 fusion protein was constructed and transiently transfected into HKC-8 cells. Figure 2d showed both cytoplasmic (Figure 2d, arrows) and nuclear (Figure 2d, arrowheads) localization of GFP-Id1. Similarly, incubation with leptomycin B also reduced the cytoplasmic localization of GFP-Id1 fusion protein (Figure 2e). Collectively, these results indicate that Id1 is localized in both cytoplasm and nuclei, and that there is a dynamic, CRM1-dependent nucleo-cytoplasmic shuttling of Id1 in kidney tubular cells.
Induction of Id1 is closely associated with peritubular inflammation
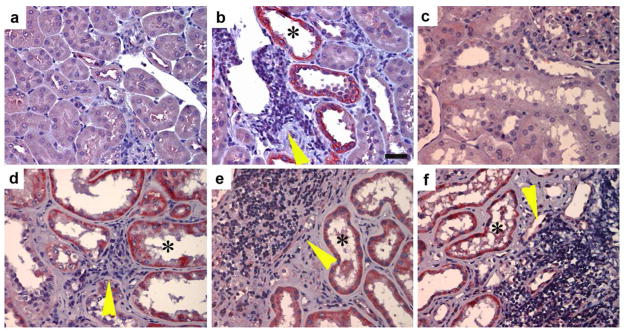
The cytoplasmic localization of Id1 might imply novel function of this protein, in addition to its role in regulating gene transcription in the nucleus. To address this issue, we first investigated Id1 regulation and its subcellular localization in other models of chronic kidney disease. In an accelerated mouse model of diabetic nephropathy, in which diabetes was induced by streptozotocin (STZ) in the nephrectomized CD-1 mice,20 Id1 induction was observed specifically in the degenerated, dilated renal tubules at 3 months after STZ injection, whereas morphologically normal tubules were essentially negative for Id1 staining (Figure 3, a and b). This unique pattern of Id1 expression is compatible with that in UUO mice (Figure 2b), suggesting that Id1 induction is associated with tubular cell dedifferentiation and degeneration in this model as well. Of particular interest, there was significant infiltration of inflammatory cells in the close proximity to the Id1-positve tubules (Figure 3b, arrowhead).
Figure 3. Id1 induction is closely associated with peri-tubular inflammation in chronic kidney diseases.
(a, b) Immunohistochemical staining shows a selective upregulation of Id1 in the degenerated, dilated tubules in mouse model of diabetic nephropathy. (a), control kidney; (b) diabetic kidney. Id1 was selectively induced in the dilated tubules (*) in the proximity of a cluster of inflammatory cells (yellow arrowhead). Scale bar, 25 μm. (c–f) Id1 is induced in renal tubules of kidney biopsies from patients with different nephropathies. (c), control kidney; (d) focal and segmental glomerulosclerosis (FSGS); (e, f) diabetic nephropathy. Asterisks (*) denote the Id1-positive renal tubules. Yellow arrowheads show the infiltration of inflammatory cells.
To explore the relevance of Id1 induction to the pathogenesis of chronic kidney diseases in humans, we examined the Id1 expression in human kidney biopsies with different nephropathies. As shown in Figure 3c, no or little Id1 staining was observed in human normal kidney. However, substantial induction of Id1 was found in renal tubules of kidney biopsies from patients with various kidney disorders. Notably, Id1 was localized in both cytoplasm and nuclei of tubular cells (Figure 3, d–f, asterisks). Interestingly, Id1-positive tubules were often surrounded by infiltrated inflammatory cells (Figure 3, d–f, arrowheads), suggesting that Id1 may not only be instrumental in mediating tubular cell dedifferentiation, but also could potentially play a role in inciting peritubular infiltration of inflammatory cells.
Id1 potentiates NF-κB signaling and promotes RANTES induction in tubular epithelial cells
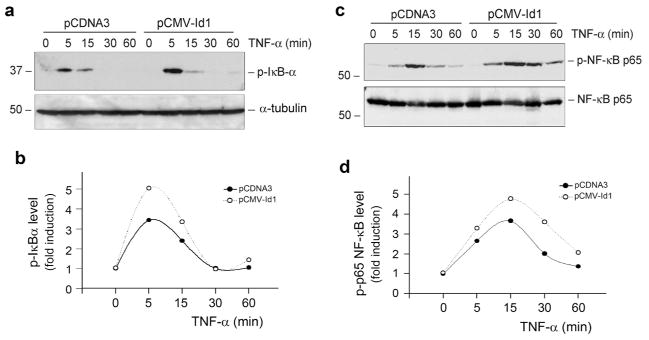
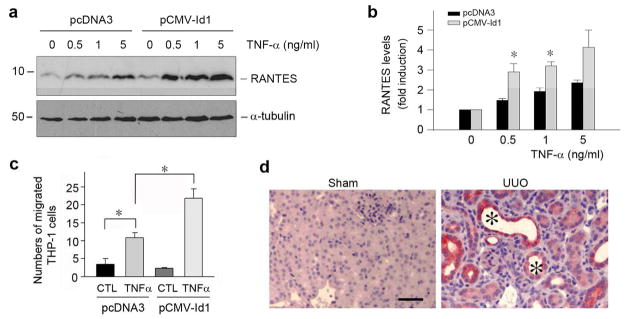
The close association between Id1 induction and inflammatory infiltration prompted us to investigate whether Id1 modulates renal inflammation and NF-κB signaling. As shown in Figure 4, a and b, Id1 over-expression enhanced IκBα phosphorylation, an early event of NF-κB signaling that takes place in the cytoplasm, in HKC-8 cells upon TNF-α stimulation. Id1 over-expression also increased p65 NF-κB phosphorylation upon TNF-α stimulation (Figure 4, c and d). The magnitude of TNF-α-mediated IκBα and p65 NF-κB phosphorylation were increased in Id1-overexpressing cells. This led to an increased RANTES (regulated on activation, normal T cell expressed), also known as CC-chemokine ligand 5 (CCL5), induction by TNF-α in Id1-over-expressing tubular cells. As shown in Figure 5, a and b, TNF-α at 0.5 ng/ml induced substantial RANTES expression in the Id1-overexpressing cells, comparing to the pcDNA3 mock-transfected controls. Using chemotaxis assay, we further evaluated the significance of an increased tubular expression of RANTES in recruiting inflammatory cells. To this end, the supernatants of cell cultures were used to assess their ability to attract THP-1 monocyte migration across the Transwell filter. As shown in Figure 5c, conditioned media derived from the Id1-over-expressing cells after TNF-α stimulation were more potent in chemo-attracting THP-1 cells, compared with pcDNA3 controls. Consistently, RANTES was selectively induced in the degenerated tubules in the obstructed kidneys after UUO (Figure 5d), a pattern similar to Id1 induction in this model (Figure 2b). Altogether, these results suggest that Id1 sensitizes tubular epithelial cells to produce pro-inflammatory RANTES and facilitates peritubular infiltration of inflammatory cells after injury.
Figure 4. Ectopic expression of Id1 potentiates NF-κB signaling in kidney tubular epithelial cells.
(a, b) Id1 potentiates IκBα phosphorylation after TNF-α stimulation. Id1-overexpressing cells and pcDNA3-mock transfection controls were treated with TNF-α (5 ng/ml) for various periods of time. Cell lysates were immunoblotted with anti-phospho-IκBα. (c, d) Id1 promotes p65 NF-κB phosphorylation after TNF-α stimulation. After treatment with TNF-α for various periods of time as indicated, cell lysates were immunoblotted with antibodies against phospho-p65 or total p65, respectively. (a, c) Representative Western blots; (b, d) Graphic presentation of the relative abundances (fold induction versus the controls).
Figure 5. Ectopic expression of Id1 potentiates RANTES induction in tubular epithelial cells and promotes monocyte chemotaxis.
(a, b) Id1 potentiates RANTES expression in response to TNF-α stimulation. HKC-8 cells transfected with either Id1 expression vector or pcDNA3 empty plasmid were treated with different doses of TNF-α for 24 h as indicated. Cell lysates were immunoblotted with antibodies against RANTES or α-tubulin, respectively. Representative Western blot (a) and quantitative data of RANTES expression in various groups (b) are presented. *P < 0.05 versus pcDNA3 control (n = 3). (c) Id1 promotes the chemoattraction of tubular epithelial HKC-8 cells to THP-1 monocytes in vitro. Id1-overexpressing HKC-8 cells and controls cells were treated with TNF-α for 24 h. Conditioned media were collected for chemotaxis assay to assess their ability to attract THP-1 cells to migrate across the filter of Transwell chambers. Data are expressed as the percentage of migrated cells in total cells added. *P < 0.05 versus pcDNA3 control (n = 3). (d) Immunohistochemical staining shows an induction of RANTES protein in the degenerated tubules (*) in the obstructed kidneys at 7 days after UUO. Scale bar, 50 μm.
Id1 promotes tubular cell dedifferentiation by inducing Snail1
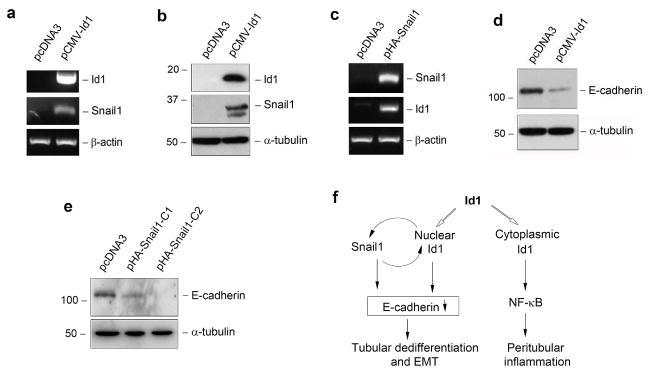
Over-expression of Id1 leads to tubular cell dedifferentiation characterized by loss of E-cadherin and ZO-1, as previously reported,17 which is largely mediated by Id1-driven sequestration of transcription factor HEB in the nucleus. To further delineate the mechanism by which Id1 promotes tubular cell dedifferentiation, we examined its potential role in regulating the expression of Snail1, a key transcription factor that is essential for repressing E-cadherin and triggering EMT.21, 22 As shown in Figure 6a, ectopic expression of Id1 in HKC-8 cells induced Snail1 mRNA expression. Similarly, Id1 also induced Snail1 protein expression in tubular epithelial cells (Figure 6b). Interestingly, over-expression of Snail1 reciprocally induced Id1 expression (Figure 6c). These results indicate that Id1 and Snail1 mutually induce each other, thereby forming a positive feedback loop. As previously reported,17, 23 ectopic expression of either Id1 (Figure 6d) or Snail1 (Figure 6e) in HKC-8 cells suppressed E-cadherin expression and triggered epithelial dedifferentiation. Therefore, nuclear Id1, via binding to and sequestration of HEB or/and inducing Snail1, plays a critical role in triggering tubular cell dedifferentiation (Figure 6f).
Figure 6. Id1 promotes tubular cell dedifferentiation by inducing Snail1 and repressing E-cadherin expression.
(a, b) Over-expression of Id1 induces Snail1 mRNA (a) and protein (b) expression in tubular epithelial cells. HKC-8 cells were transfected with Id1 expression vector (pCMV-Id1) or empty vector (pcDNA3). Id1 and Snail1 expression were assessed by RT-PCR and Western blot, respectively. (c) Snail1 also induces Id1 expression in tubular epithelial cells. Both Snail1 and Id1 expression were assessed by RT-PCR in HKC-8 cells transfected with Snail1 expression vector (pHA-Snail1) or empty vector (pcDNA3). (d, e) Either Id1 or Snail1 promotes tubular cell dedifferentiation by repressing E-cadherin expression. HKC-8 cells were transfected with either Id1 expression vector (pCMV-Id1) or Snail1 expression vector (pHA-Snail1). Cell lysates were immunoblotted with antibodies against E-cadherin or α-tubulin, respectively. C1 and C2 indicate individual cell clones after stable transfection. (f) Diagram shows that Id1, as a single molecule, promotes tubular cell dedifferentiation and peritubular inflammation.
Ablation of Id1 reduces renal inflammation after obstructive injury
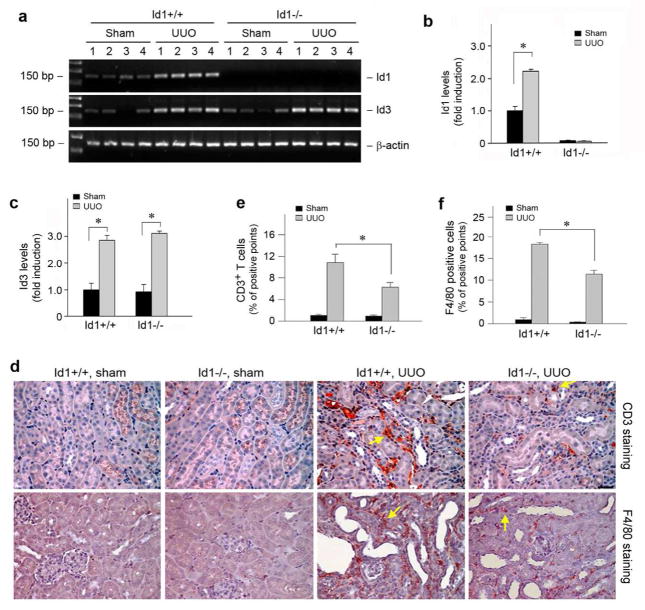
To determine the role of Id1 in renal inflammation and fibrogenesis in vivo, we employed a knockout mouse model in which Id1 gene is genetically disrupted. Mice with Id1 deficiency (Id1−/−) developed normally and displayed no overt abnormality in phenotypes, as previously reported.24 We first examined the expression of Id1 after obstructive injury in the wild type (Id1+/+) and Id1 null mice (Id1−/−). As shown in Figure 7, a and b, ureteral obstruction induced a significant increase in Id1 mRNA expression in the obstructed kidney of wild-type mice, compared to sham controls. As expected, no Id1 mRNA was detected in the kidneys of Id1 null mice. Id1 deficiency did not significantly affect the induction of Id3, another member of the Id family proteins that shares a high structural similarity to Id1,16 in the obstructed kidneys after UUO (Figure 7, a and c).
Figure 7. Genetic ablation of Id1 reduces the infiltration of T cells and monocytes/macrophages in obstructive nephropathy.
(a–c) RT-PCR analysis shows Id1 and Id3 mRNA expression in wild-type and Id1 knockout mice after UUO. Numbers denote each individual mouse in a given group. (a) representative RT-PCR data; (b, c) quantitative data of Id1 (b) and Id3 (c) mRNA levels. (d) Representative micrographs show the infiltration of CD3-positive T cells and F4/80-positive monocytes/macrophages in the obstructive kidneys of Id1 knockout mice and their control littermates. Kidney sections were stained with antibody against CD3 or F4/80 antigens. Yellow arrows show the infiltration of inflammatory cells. Bar = 25 μm. (e, f) Quantitative determination of the CD3-positive T cells (e) and F4/80-positive macrophages (f) in Id1 null mice and their control littermates at 7 days after UUO. *P < 0.05 (n = 6).
To assess the potential effect of Id1 on renal inflammation in vivo, we examined the peritubular infiltration of inflammatory cells including CD3-positive T cells and F4/80-positive monocytes/macrophages in the obstructed kidneys, respectively. As shown in Figure 7d, compared with sham controls, obstructive injury caused substantial T cells and macrophage infiltration in the obstructed kidneys, as illustrated by immunohistochemical staining for CD3 and F4/80 antigens. Id1 deficiency, however, significantly reduced renal infiltration of T cells and macrophages (Figure 7d, arrows). A computer-aided quantitative analysis also demonstrated a reduction of inflammatory cell infiltration in Id1 null mice after UUO, compared to the wild-type controls (Figure 7, e and f).
Id1 deficiency decreases renal expression of inflammatory mediators
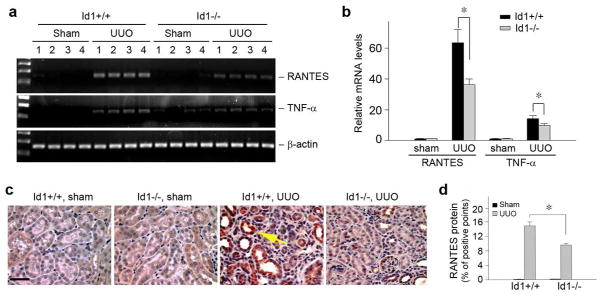
We next examined the expression of RANTES, an important inflammatory chemokine in the obstructed kidneys.25 As shown in Figure 8, a and b, quantitative, real-time RT-PCR analysis demonstrated a marked induction of RANTES mRNA in the obstructive kidney, when compared with sham controls. However, Id1 deficiency significantly inhibited RANTES mRNA expression. We further investigated the expression of TNF-α, a key inflammatory cytokine that is produced primarily by the infiltrated cells, in the obstructed kidney after UUO. Similarly, Id1 deficiency also reduced TNF-α expression in the obstructed kidneys (Figure 8, a and b).
Figure 8. Id1 deficiency reduces RANTES and TNF-α expression in obstructive nephropathy in vivo.
(a, b) RT-PCR results show that Id1 deficiency decreased renal RANTES and TNF-α mRNA expression at 7 d after UUO. (a) representative RT-PCR data; (b) graphic presentation of relative RANTES and TNF-α mRNA levels detected by quantitatively, real-time PCR. *P < 0.05 (n =6). (c, d) RANTES is induced in the degenerated tubules of obstructed kidneys at 7 d after UUO, which is attenuated in Id1 knockout mice. Kidney sections were immunostained with anti-RANTES antibody. Arrow shows the RANTES-positive tubules. Scale bar, 50 μm. (c) representative micrographs; (d) quantitative determination of RANTES protein expression in various groups as indicated. *P < 0.05 (n =6).
We also investigated RANTES protein expression and its localization by immunohistochemical staining. As shown in Figure 8c, no or little RANTES protein was observed in normal, sham-operated kidneys; however, RANTES was induced in the degenerated, dilated renal tubular epithelium in the obstructed kidney at 7 d after UUO. Consistent with the mRNA data, Id1 deficiency also reduced RANTES protein expression in the obstructed kidneys (Figure 8, c and d).
Id1 deficiency inhibits myofibroblast activation and matrix expression and reduces renal fibrosis
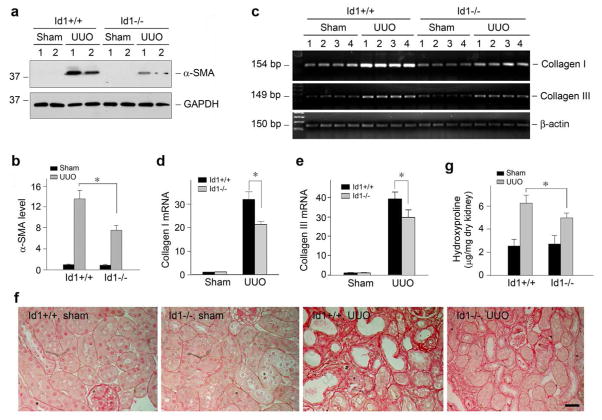
Finally we assessed the effects of Id1 deficiency on matrix production and renal fibrosis in obstructive nephropathy. To this end, we first examined the effects of Id1 deficiency on the activation of myofibroblasts, the principal matrix-producing cells in fibrotic kidney, after obstructive injury.26–28 As shown in Figure 9, a and b, ureteral obstruction induced a marked increase in the expression of α-SMA, the molecular signature of myofibroblasts. However, Id1 deficiency reduced renal α-SMA expression. Similar results were obtained when using an indirect immunofluorescence staining for α-SMA (data not shown).
Figure 9. Id1 deficiency attenuates myofibroblast activation, inhibits matrix gene expression and ameliorates fibrotic lesions in obstructive nephropathy.
(a, b) Western blot demonstrates that deficiency of Id1 inhibited α-SMA expression in the obstructed kidneys after UUO. Kidney lysates were immunoblotted with specific antibodies against α-SMA and GAPDH, respectively. Representative Western blot (a) and quantitative data of α-SMA expression in various groups (b) are presented. *P < 0.05 (n = 6). (c–e) Id1 deficiency inhibits matrix gene expression n obstructive nephropathy. (c) representative RT-PCR analysis of renal mRNA levels of type I and type III collagen in different groups as indicated. Numbers denote each individual mouse in a given group; (d, e) quantitative determination of renal type I (d) and type III collagen (e) mRNA levels by real-time PCR in various groups as indicated. *P < 0.05 (n = 6). (f) Representative micrographs show the deposition of collagen as detected by Picrosirius Red staining. Bar = 25 μm. (g) Renal total collagen content was estimated by measuring hydroxyproline levels in obstructed kidneys at days after UUO. Hydroxyproline levels were expressed as μg/mg dry kidney weight. *P < 0.05 (n = 6).
Figure 9, c through e, shows the expression of type I and type III collagen mRNA in the obstructed kidneys after UUO. As expected, marked induction of type I and type III collagen mRNA was observed at 7 days after ureteral obstruction in wild-type mice, when compared with their sham controls. However, ablation of Id1 significantly reduced type I and type III collagen mRNA expression (Figure 9, c through e). A collagen-specific Picrosirius Red staining also revealed a marked increase in collagen deposition after obstructive injury in wild-type mice, which was reduced in Id1 null mice (Figure 9f). Quantitative determination of renal hydroxyproline content also confirmed a reduced collagen accumulation in Id1 null mice (Figure 9g). Together, these results indicate that Id1 deficiency inhibits myofibroblast activation, attenuates matrix production and mitigates renal fibrosis in obstructive nephropathy.
Discussion
The linkage between inflammation and renal fibrosis has long been established,29–31 and is also consistent with pathohistological evidence, as fibrotic foci in the injured kidneys are typically instigated and encircled by inflammatory infiltrates. The classical view on the connection of inflammation/fibrosis is thought to be mediated by a paracrine fashion, in which inflammatory cells secrete profibrotic cytokines that act on resident fibroblasts and tubular cells to promote fibrogenesis.32, 33 In this study, we demonstrate an intrinsic connection between inflammatory signal and EMT within the same tubular cells at molecular levels. Id1 is selectively up-regulated in the degenerated proximal tubules and collecting ducts, and is present in both cytoplasm and nucleus. While nuclear Id1 promotes tubular cell dedifferentiation by transcriptionally repressing E-cadherin and ZO-1 expression,17 cytoplasmic Id1 potentiates NF-κB signaling and pro-inflammatory RANTES expression, and facilitates peritubular infiltration of inflammatory cells. These studies have clearly established that Id1, as a single molecule, intrinsically couples inflammation and tubular dedifferentiation, two important pathogenic events in renal fibrogenesis.
Id1 is the prototype of a family of transcriptional antagonists consisting of four members (Id1 through Id4), each of them with distinct expression pattern.16 Both Id1 and Id3 are induced in the fibrotic kidneys after obstructive injury, and genetic ablation of Id1 does not substantially affect Id3 induction in mice (Figure 6). We previously identified Id1 as an important player in mediating cell dedifferentiation of renal tubular epithelium, the early event of tubular EMT in the fibrotic kidneys.17 Because Id1 lacks the basic DNA binding domain but retains the ability to interact with HEB, such an Id1/HEB heterodimeric complex formation sequesters the ability of HEB to bind to the E-boxes in the E-cadherin gene promoter.17 In such way, Id1 acts as a dominant-negative inhibitor and blocks the HEB-mediated E-cadherin and ZO-1 expression, leading to epithelial cell dedifferentiation.17 This assumption is consistent with and supported by the characteristic pattern of Id1 induction, in which Id1 is exclusively upregulated in the degenerated tubules with a dilated lumen in various kinds of nephropathies in mice and humans (Figures 2 and 3). Of interest, the present study further reveals that Id1 is also able to induce the expression of Snail1 (Figure 6), a master transcription factor that not only suppresses E-cadherin but also induces the expression of mesenchymal genes.21, 23, 34 Furthermore, Id1 and Snail1 mutually induce each other (Figure 6), leading to the formation of a positive feedback loop. Taken together, these results indicate that Id1, as its name implied, triggers tubular epithelial cell dedifferentiation by specifically repressing E-cadherin via binding to and sequestration of HEB and inducing Snail1 expression (Figure 6f), which apparently takes place in the nucleus of tubular epithelial cells.
Subcellular distribution of Id1 protein, however, appears inconsistent with its perceived function as a transcriptional antagonist, because it is largely localized in the cytoplasm of renal tubular epithelium in vivo. The cytoplasmic localization of Id1 is confirmed by multiple approaches, including immunohistochemical staining, cellular fractionation, and direct visualization of GFP-tagged Id1 fusion protein. Therefore, it is highly unlikely that this pattern of Id1 subcellular distribution is caused by technical shortcomings such as non-specific staining. Furthermore, treatment with the nuclear export inhibitor leptomycin B reveals a nuclear retention of Id1, suggesting a CRM1/exportin-dependent nuclear export of Id1 at work in tubular cells (Figure 2). Such a nucleo-cytoplasmic shuttling of Id1 is also observed in human umbilical vein endothelial cells when cultured on Matrigel, and it is regulated by protein kinase A.35 Whether, and how, this nucleo-cytoplasmic shuttling of Id1 in tubular epithelial cells is regulated remain to be elucidated; nevertheless, it might not be controlled by TGF-β1, as the ratio of nuclear/cytoplasmic Id1 remains constant after TGF-β1 incubation in HKC-8 cells, despite an elevated level of total cellular Id1 in this setting.
One of the novel findings in this study is the identification of Id1 as an important regulator of peritubular inflammation after renal injury. This notion is substantiate by several lines of evidences. First, there is a close proximity between inflammatory infiltrates and the Id1-positive tubules in the diseased kidneys (Figure 3). More importantly, ectopic expression of Id1 potentiates IκBα phopshorylation and p65 NF-κB activation in tubular cells, and promotes RANTES expression after TNF-α stimulation. Consistently, conditioned media derived from Id1-overexpressing cells facilitate the recruitment and infiltration of inflammatory cells in chemotaxis assay (Figure 5c). Furthermore, genetic ablation of Id1 protects the kidneys against inflammatory infiltration of T cells and macrophages after obstructive injury (Figure 7). It should be noted that previous studies have shown that Id1 promotes cell survival in prostate cancer and breast cancer cells, and induces the proliferation of cochlear sensory epithelial cells via NF-κB activation.36–38 Id1 is also reported to potentiate NF-κB activation in a T cell line, leading to overproduction of cytokines such as TNF-α.39 These studies further strengthen the intrinsic connection between Id1 and NF-κB activation, although the molecular details remain to be elucidated. Of note, because IκBα phosphorylation is an early event in NF-κB signaling that takes place in the cytoplasm, this implies that the promotion of NF-κB signaling is operated presumably by cytoplasmic Id1. Along this line, it becomes clear that Id1 possesses two distinct functions, dependent on its subcellular localization. While nuclear Id1 induces tubular cell dedifferentiation by repressing E-cadherin expression via sequestering HEB and inducing Snail1, cytoplasmic Id1 is able to promote renal inflammation by potentiating NF-κB signaling and chemokine expression. Therefore, Id1, acting on distinct signal pathways in different subcellular compartments, intrinsically couples tubular cell dedifferentiation and peritubular inflammation (Figure 6f).
Renal fibrogenesis usually instigates focally in the proximity of microvasculature, an inflammatory and fibrotic microenvironment, before progressing into widespread tissue fibrosis. What constitutes the molecular basis of this fibrotic niche is poorly understood. Our studies suggest that Id1 is well suited to serve as a major and integral element of the fibrotic niche in diseased kidneys after injury. Id1 is induced rapidly and selectively in the degenerated tubules, and it intrinsically connects tubular cell dedifferentiation and peritubular inflammation. Therefore, Id1 is instrumental in creating a focal, inflammatory and fibrotic microenvironment, which further drives fibrogenic responses. As illustrated in Id1 null mice, targeting Id1 could be beneficial in preserving tubular cell integrity, reducing peritubular inflammation and ameliorating renal fibrogenesis.
Materials and Methods
Cell culture and treatment
Human proximal tubular epithelial cell line (clone-8) (HKC-8) was provided by Dr. L. Racusen of Johns Hopkins University. Mouse inner medullary collecting duct epithelial cells (mIMCD-3) were obtained from American Type Culture Collection (ATCC; Manassas, VA).40 Cells were cultured in Dulbecco’s modified Eagle’s medium (DMEM)-Ham’s F12 medium supplemented with 10% fetal bovine serum (FBS). HKC-8 cells were seeded at ~ 70% confluence in complete medium containing 10% FBS. Twenty four hours later, the cells were changed to serum-free medium and incubated for 16 h. Cells were then treated with recombinant human TNF-α (R & D Systems, Minneapolis, MN) for various periods of time at the concentration of 5 ng per ml except otherwise indicated. The cells were then collected at different time points for Western blot analysis. Serum-starved mIMCD-3 cells were treated with TGF-β1 (2 ng/ml) for various periods of time as indicated, and then collected for real-time RT-PCR and Western blot analyses. For some studies, cells were transfected with Id1 expression vector (pCMV-Id1), GFP-tagged Id1 expression vector (pGFP-Id1) or Snail1 expression vector (pHA-Snail1) by using Lipofectamine 2000 reagent (Invitrogen, Carlsbad, CA). Id1 expression vector (pCMV-Id1) was described previously.17 Construction of the GFP-tagged Id1 expression vector (pGFP-Id1) was carried out by standard molecular cloning techniques, and its correct sequences were confirmed by DNA sequencing at the University of Pittsburgh Biomedical Research Support Facilities.
Cellular fractionation
For preparation of nuclear protein, HKC-8 cells were washed twice with cold phosphate-buffered saline (PBS) and scraped off the plate with a rubber policeman. After centrifugation, cell pellets were resuspended in Buffer A (10 mM HEPES pH 7.9, 1.5 mM MgCl2, 10 nM KCl, 0.5% NP-40 and 1% protease inhibitor cocktail (Sigma)) and lysed with homogenizer. Cell nuclei were collected by centrifugation at 5,000 rpm for 15 min, and the supernatants were saved as cytoplasmic preparation. After washing with Buffer B (10 mM HEPES pH 7.9, 1.5 mM MgCl2, 10 nM KCl and 1% protease inhibitor cocktail), nuclei were lysed in SDS sample buffer.41
Animal model
Colonies of homozygous Id1 knockout (Id1−/−) and wild-type (Id1+/+) mice were described previously.24 A routine PCR protocol was used for genotyping of tail DNA samples with following primers: 5′-TCCTGCAGCATGTAATCGAC-3′, 5′-GACGTGCTACTTCCATTTGTCA-3′ and 5′-GAGACCCACTGGAAAGGACA-3′, which yielded 344 and 540-bp bands for the wild-type and mutated alleles, respectively. The experiments were performed on male Id1−/− and Id1+/+ mice with identical genetic backgrounds and with an average age of 8 weeks. There was no statistical difference in the body weight of Id1−/− and Id1+/+ mice at the time of the experiments. Unilateral ureteral obstruction (UUO) was performed using an established procedure, as described elsewhere.42 Mice were sacrificed at day 7 after surgery and kidneys were removed. One part of the kidney was fixed in 10% phosphate-buffered formalin, followed by paraffin embedding for histologic and immunohistochemical studies. Another part was immediately frozen in Tissue-Tek OCT compound (Sakura Finetek, Torrance, CA) for cryosection. The remaining kidneys were snap-frozen in liquid nitrogen and stored at −80°C for extraction of RNA and protein. All animal studies were approved by the Institutional Animal Care and Use Committee at the University of Pittsburgh.
Human tissue samples
Human kidney specimens were obtained from diagnostic renal biopsy performed at the University of Pittsburgh Medical Center. As normal controls, non-tumor kidney tissue from the patients who had renal cell carcinoma and underwent nephrectomy was used. Studies involving human tissues were approved by the Institutional Review Board at the University of Pittsburgh.
Western blot analysis
Western blot analysis for specific protein expression was performed essentially according to an established procedure.17 The primary antibodies used were as follows: anti-RANTES (sc-1410), anti-Id1 (sc-488) and anti-actin (sc-1616) (Santa Cruz Biotechnology, Santa Cruz, CA), anti-phospho-IκBα (Ser32/36), anti-phospho-p65 NF-κB (Ser536), anti-p65 NF-κB (Cell Signaling Technology, Beverly, MA), anti-Snail1 (ab17732), anti-histone H3 (Abcam, Cambridge, MA), anti-E-cadherin (#610182; BD Transduction, San Jose, CA) anti-α-SMA (clone 1A4), anti-α-tubulin (T9026) (Sigma, St. Louis, MO), anti-GAPDH (Ambion, Austin, TX). Quantification was performed by measuring the intensity of the signals with the use of NIH Image analysis software.
Quantitative, real-time reverse transcriptase (RT)-PCR analysis
Total RNA was extracted using TRIzol RNA isolation system (Invitrogen). The first strand of cDNA was synthesized using 2 μg of RNA in 20 μl of reaction buffer by reverse transcription using AMV-RT (Promega, Madison, WI) and random primers at 42°C for 30 min. Quantitative, real-time RT-PCR was performed on ABI PRISM 7000 Sequence Detection System (Applied Biosystems, Foster City, CA), as described previously.22 The PCR reaction mixture in a 25-μl volume contained 12.5 μl 2x SYBR Green PCR Master Mix (Applied Biosystems), 5 μl diluted RT product (1:10) and 0.5 μM sense and antisense primer sets. The sequences of the primer pairs were given in Supplementary Table 1. PCR reaction was run by using standard conditions. The mRNA levels of various genes were calculated after normalizing with β-actin. Some PCR products were also size fractionated on a 1.0% agarose gel and detected by ethidium bromide staining.
Immunofluorescence staining
Indirect immunofluorescence staining was performed using an established procedure.17, 43 Briefly, kidney cryosections were fixed with cold methanol:acetone (1:1) for 10 min at −20°C. Following blocking with 20% normal donkey serum in PBS buffer, the slides were incubated with the primary antibodies against Id1 (sc-488), aquaporin-1 (sc-9878), Tamm-Horsfall glycoprotein (THP) (sc-19554) (Santa Cruz Biotechnology, Santa Cruz, CA), thiazide-sensitive NaCl cotransporter (TSC)/NCC (AB3553; Millipore, Billerica, MA), and fluorescein-labeled Dolichos Biflorus agglutinin (DBA) (FL-1031; Vector Lab, Burlingame, CA). To visualize the primary antibodies, slides were stained with cyanine Cy2- or Cy3-conjugated secondary antibodies (Jackson ImmunoResearch Laboratories, West Grove, PA). Stained slides were viewed with a Nikon Eclipse E600 Epi-fluorescence microscope equipped with a digital camera (Melville, NY).
Histology and immunohistochemical staining
Kidney sections were prepared at 4 μm thickness by a routine procedure. Sections were stained with hematoxylin-eosin, periodic acid-Schiff, and Picrosirius Red reagents by standard protocol.5 Immunohistochemical staining of kidney sections was performed by an established protocol.4, 5 In brief, paraffin-embedded sections were stained with anti-Id1 (sc-488), anti-CD3 (sc-20047) (Santa Cruz Biotechnology), anti-F4/80 (14-4801-82; eBioscience, San Diego, CA), and anti-RANTES (500-P118; PeproTech Inc., Rocky Hill, NJ) antibodies using the M.O.M. immunodetection kit, according to the protocol specified by the manufacturer (Vector Laboratories, Burlingame, CA). Slides were viewed with an Eclipse E600 microscope equipped with a digital camera (Nikon, Melville, NY). CD-3, F4/80, and RANTES staining were semi-quantified by a computer-aided morphometric analysis (MetaMorph; Universal Imaging Co., Downingtown, PA). Briefly, a grid containing 117 (13 × 9) sampling points was superimposed onto images of cortical high-power field (x400). The number of grid points overlying positive area (except tubular lumen and glomeruli) was counted and expressed as a percentage of all sampling points. For each kidney, 5 randomly selected, non-overlapping fields were analyzed in a blinded manner.
Chemotaxis assay
Chemotaxis assay was performed using a 24-well Transwell plate as described previously.5 Human monocytic cell line (THP-1) (American Type Culture Collection, Manassas, VA) was maintained in RPMI-1640 medium supplemented with 10% fetal calf serum. Cultured THP-1 cells (5×10⁵ in 100 μl) were added onto the upper chamber of the Transwell insert (5 μm polycarbonate filter, Corning Inc. Corning, NY). Id1-overexpressing cell conditioned media (0.5 ml) were added in the lower chamber of the Transwell. After incubation at 37°C for 4 h, the number of cells migrated to the lower chamber of the Transwell was counted. Data are expressed as percentage of the migrated cells in total number of input cells.
Quantitative determination of tissue hydroxyproline content
To quantitative measurement of collagen deposition in the kidney, total tissue collagen was estimated by biochemical analysis of the hydroxyproline in the hydrolysates extracted from kidney samples. This assay is based on the observation that essentially all the hydroxyproline in animal tissues is found in collagen. Briefly, kidney samples were dried at 110°C for 48 h, and then accurately weighed. Dry kidney was hydrolyzed in sealed, oxygen-purged glass ampoules containing 2 ml of 6 N HCl at 110°C for 24 h. Hydroxyproline content in the hydrolysates was chemically quantified according to the techniques previously described.12 Tissue hydroxyproline content was expressed as μg per mg dry kidney weight.
Statistical Analyses
All data examined were expressed as mean ± SEM. Statistical analyses of the data were performed using SigmaStat software (Jandel Scientific Software, San Rafael CA). Comparison between groups was made using one-way ANOVA, followed by Student-Newman-Keuls test. P < 0.05 was considered significant.
Supplementary Material
Acknowledgments
We sincerely thank Dr. Robert Benezra (Memorial Sloan-Kettering Cancer Center, New York) for kindly providing Id1 knockout mice. This work was supported by the National Institutes of Health Grants DK061408 and DK064005.
Footnotes
Disclosures
None.
References
- 1.Liu Y. Renal fibrosis: New insights into the pathogenesis and therapeutics. Kidney Int. 2006;69:213–217. doi: 10.1038/sj.ki.5000054. [DOI] [PubMed] [Google Scholar]
- 2.Zeisberg M, Neilson EG. Mechanisms of tubulointerstitial fibrosis. J Am Soc Nephrol. 2010;21:1819–1834. doi: 10.1681/ASN.2010080793. [DOI] [PubMed] [Google Scholar]
- 3.Boor P, Ostendorf T, Floege J. Renal fibrosis: novel insights into mechanisms and therapeutic targets. Nat Rev Nephrol. 2010;6:643–656. doi: 10.1038/nrneph.2010.120. [DOI] [PubMed] [Google Scholar]
- 4.Li Y, Tan X, Dai C, et al. Inhibition of integrin-linked kinase attenuates renal interstitial fibrosis. J Am Soc Nephrol. 2009;20:1907–1918. doi: 10.1681/ASN.2008090930. [DOI] [PMC free article] [PubMed] [Google Scholar]
- 5.Tan X, Wen X, Liu Y. Paricalcitol inhibits renal inflammation by promoting vitamin D receptor-mediated sequestration of NF-κB signaling. J Am Soc Nephrol. 2008;19:1741–1752. doi: 10.1681/ASN.2007060666. [DOI] [PMC free article] [PubMed] [Google Scholar]
- 6.Vielhauer V, Kulkarni O, Reichel CA, et al. Targeting the recruitment of monocytes and macrophages in renal disease. Semin Nephrol. 2010;30:318–333. doi: 10.1016/j.semnephrol.2010.03.006. [DOI] [PubMed] [Google Scholar]
- 7.Tapmeier TT, Fearn A, Brown K, et al. Pivotal role of CD4+ T cells in renal fibrosis following ureteric obstruction. Kidney Int. 2010;78:351–362. doi: 10.1038/ki.2010.177. [DOI] [PubMed] [Google Scholar]
- 8.Giannopoulou M, Dai C, Tan X, et al. Hepatocyte growth factor exerts its anti-inflammatory action by disrupting nuclear factor-κB signaling. Am J Pathol. 2008;173:30–41. doi: 10.2353/ajpath.2008.070583. [DOI] [PMC free article] [PubMed] [Google Scholar]
- 9.St John MA, Dohadwala M, Luo J, et al. Proinflammatory mediators upregulate snail in head and neck squamous cell carcinoma. Clin Cancer Res. 2009;15:6018–6027. doi: 10.1158/1078-0432.CCR-09-0011. [DOI] [PMC free article] [PubMed] [Google Scholar]
- 10.Lopez-Novoa JM, Nieto MA. Inflammation and EMT: an alliance towards organ fibrosis and cancer progression. EMBO Mol Med. 2009;1:303–314. doi: 10.1002/emmm.200900043. [DOI] [PMC free article] [PubMed] [Google Scholar]
- 11.Hotz B, Visekruna A, Buhr HJ, et al. Beyond epithelial to mesenchymal transition: a novel role for the transcription factor snail in inflammation and wound healing. J Gastrointest Surg. 2010;14:388–397. doi: 10.1007/s11605-009-1068-3. [DOI] [PubMed] [Google Scholar]
- 12.Tan X, He W, Liu Y. Combination therapy with paricalcitol and trandolapril reduces renal fibrosis in obstructive nephropathy. Kidney Int. 2009;76:1248–1257. doi: 10.1038/ki.2009.346. [DOI] [PMC free article] [PubMed] [Google Scholar]
- 13.Wu Y, Deng J, Rychahou PG, et al. Stabilization of snail by NF-kappaB is required for inflammation-induced cell migration and invasion. Cancer Cell. 2009;15:416–428. doi: 10.1016/j.ccr.2009.03.016. [DOI] [PMC free article] [PubMed] [Google Scholar]
- 14.Yang J, Liu Y. Dissection of key events in tubular epithelial to myofibroblast transition and its implications in renal interstitial fibrosis. Am J Pathol. 2001;159:1465–1475. doi: 10.1016/S0002-9440(10)62533-3. [DOI] [PMC free article] [PubMed] [Google Scholar]
- 15.Liu Y. Epithelial to mesenchymal transition in renal fibrogenesis: pathologic significance, molecular mechanism, and therapeutic intervention. J Am Soc Nephrol. 2004;15:1–12. doi: 10.1097/01.asn.0000106015.29070.e7. [DOI] [PubMed] [Google Scholar]
- 16.Perk J, Iavarone A, Benezra R. Id family of helix-loop-helix proteins in cancer. Nat Rev Cancer. 2005;5:603–614. doi: 10.1038/nrc1673. [DOI] [PubMed] [Google Scholar]
- 17.Li Y, Yang J, Luo JH, et al. Tubular epithelial cell dedifferentiation is driven by the helix-loop-helix transcriptional inhibitor Id1. J Am Soc Nephrol. 2007;18:449–460. doi: 10.1681/ASN.2006030236. [DOI] [PubMed] [Google Scholar]
- 18.Gumireddy K, Li A, Gimotty PA, et al. KLF17 is a negative regulator of epithelial-mesenchymal transition and metastasis in breast cancer. Nat Cell Biol. 2009;11:1297–1304. doi: 10.1038/ncb1974. [DOI] [PMC free article] [PubMed] [Google Scholar]
- 19.Jang BC, Munoz-Najar U, Paik JH, et al. Leptomycin B, an inhibitor of the nuclear export receptor CRM1, inhibits COX-2 expression. J Biol Chem. 2003;278:2773–2776. doi: 10.1074/jbc.C200620200. [DOI] [PubMed] [Google Scholar]
- 20.Dai C, Yang J, Bastacky S, et al. Intravenous administration of hepatocyte growth factor gene ameliorates diabetic nephropathy in mice. J Am Soc Nephrol. 2004;15:2637–2647. doi: 10.1097/01.ASN.0000139479.09658.EE. [DOI] [PubMed] [Google Scholar]
- 21.Thiery JP, Acloque H, Huang RY, et al. Epithelial-mesenchymal transitions in development and disease. Cell. 2009;139:871–890. doi: 10.1016/j.cell.2009.11.007. [DOI] [PubMed] [Google Scholar]
- 22.Hao S, He W, Li Y, et al. Targeted inhibition of {beta}-catenin/CBP signaling ameliorates renal interstitial fibrosis. J Am Soc Nephrol. 2011;22:1642–1653. doi: 10.1681/ASN.2010101079. [DOI] [PMC free article] [PubMed] [Google Scholar]
- 23.Tan X, Li Y, Liu Y. Paricalcitol attenuates renal interstitial fibrosis in obstructive nephropathy. J Am Soc Nephrol. 2006;17:3382–3393. doi: 10.1681/ASN.2006050520. [DOI] [PubMed] [Google Scholar]
- 24.Lyden D, Young AZ, Zagzag D, et al. Id1 and Id3 are required for neurogenesis, angiogenesis and vascularization of tumour xenografts. Nature. 1999;401:670–677. doi: 10.1038/44334. [DOI] [PubMed] [Google Scholar]
- 25.Krensky AM, Ahn YT. Mechanisms of disease: regulation of RANTES (CCL5) in renal disease. Nat Clin Pract Nephrol. 2007;3:164–170. doi: 10.1038/ncpneph0418. [DOI] [PMC free article] [PubMed] [Google Scholar]
- 26.Hu K, Wu C, Mars WM, et al. Tissue-type plasminogen activator promotes murine myofibroblast activation through LDL receptor-related protein 1-mediated integrin signaling. J Clin Invest. 2007;117:3821–3832. doi: 10.1172/JCI32301. [DOI] [PMC free article] [PubMed] [Google Scholar]
- 27.Meran S, Steadman R. Fibroblasts and myofibroblasts in renal fibrosis. Int J Exp Pathol. 2011 doi: 10.1111/j.1365-2613.2011.00764.x. [DOI] [PMC free article] [PubMed] [Google Scholar]
- 28.Barnes JL, Gorin Y. Myofibroblast differentiation during fibrosis: role of NAD(P)H oxidases. Kidney Int. 2011;79:944–956. doi: 10.1038/ki.2010.516. [DOI] [PMC free article] [PubMed] [Google Scholar]
- 29.Duffield JS. Macrophages and immunologic inflammation of the kidney. Semin Nephrol. 2010;30:234–254. doi: 10.1016/j.semnephrol.2010.03.003. [DOI] [PMC free article] [PubMed] [Google Scholar]
- 30.Rangan G, Wang Y, Harris D. NF-kappaB signalling in chronic kidney disease. Front Biosci. 2009;14:3496–3522. doi: 10.2741/3467. [DOI] [PubMed] [Google Scholar]
- 31.Ricardo SD, van Goor H, Eddy AA. Macrophage diversity in renal injury and repair. J Clin Invest. 2008;118:3522–3530. doi: 10.1172/JCI36150. [DOI] [PMC free article] [PubMed] [Google Scholar]
- 32.Nightingale J, Patel S, Suzuki N, et al. Oncostatin M, a cytokine released by activated mononuclear cells, induces epithelial cell-myofibroblast transdifferentiation via Jak/Stat pathway activation. J Am Soc Nephrol. 2004;15:21–32. doi: 10.1097/01.asn.0000102479.92582.43. [DOI] [PubMed] [Google Scholar]
- 33.Lee SB, Kalluri R. Mechanistic connection between inflammation and fibrosis. Kidney Int. 2010;78:S22–S26. doi: 10.1038/ki.2010.418. [DOI] [PMC free article] [PubMed] [Google Scholar]
- 34.Liu Y. New insights into epithelial-mesenchymal transition in kidney fibrosis. J Am Soc Nephrol. 2010;21:212–222. doi: 10.1681/ASN.2008121226. [DOI] [PMC free article] [PubMed] [Google Scholar]
- 35.Nishiyama K, Takaji K, Uchijima Y, et al. Protein kinase A-regulated nucleocytoplasmic shuttling of Id1 during angiogenesis. J Biol Chem. 2007;282:17200–17209. doi: 10.1074/jbc.M611609200. [DOI] [PubMed] [Google Scholar]
- 36.Kim H, Chung H, Kim HJ, et al. Id-1 regulates Bcl-2 and Bax expression through p53 and NF-kappaB in MCF-7 breast cancer cells. Breast Cancer Res Treat. 2008;112:287–296. doi: 10.1007/s10549-007-9871-6. [DOI] [PubMed] [Google Scholar]
- 37.Ling MT, Wang X, Ouyang XS, et al. Id-1 expression promotes cell survival through activation of NF-kappaB signalling pathway in prostate cancer cells. Oncogene. 2003;22:4498–4508. doi: 10.1038/sj.onc.1206693. [DOI] [PubMed] [Google Scholar]
- 38.Ozeki M, Hamajima Y, Feng L, et al. Id1 induces the proliferation of cochlear sensory epithelial cells via the nuclear factor-kappaB/cyclin D1 pathway in vitro. J Neurosci Res. 2007;85:515–524. doi: 10.1002/jnr.21133. [DOI] [PubMed] [Google Scholar]
- 39.Yang Y, Liou HC, Sun XH. Id1 potentiates NF-kappaB activation upon T cell receptor signaling. J Biol Chem. 2006;281:34989–34996. doi: 10.1074/jbc.M608078200. [DOI] [PubMed] [Google Scholar]
- 40.Liu Y, Tolbert EM, Sun AM, et al. In vivo and in vitro evidence for increased expression of HGF receptor in kidney of diabetic rat. Am J Physiol Renal Physiol. 1996;271:F1202–F1210. doi: 10.1152/ajprenal.1996.271.6.F1202. [DOI] [PubMed] [Google Scholar]
- 41.Wang D, Li Y, Wu C, et al. PINCH1 is transcriptional regulator in podocytes that interacts with WT1 and represses podocalyxin expression. PLoS One. 2011;6:e17048. doi: 10.1371/journal.pone.0017048. [DOI] [PMC free article] [PubMed] [Google Scholar]
- 42.Yang J, Shultz RW, Mars WM, et al. Disruption of tissue-type plasminogen activator gene in mice reduces renal interstitial fibrosis in obstructive nephropathy. J Clin Invest. 2002;110:1525–1538. doi: 10.1172/JCI16219. [DOI] [PMC free article] [PubMed] [Google Scholar]
- 43.Dai C, Liu Y. Hepatocyte growth factor antagonizes the profibrotic action of TGF-beta1 in mesangial cells by stabilizing Smad transcriptional corepressor TGIF. J Am Soc Nephrol. 2004;15:1402–1412. doi: 10.1097/01.asn.0000130568.53923.fd. [DOI] [PubMed] [Google Scholar]
Associated Data
This section collects any data citations, data availability statements, or supplementary materials included in this article.


