

Abstract
The biological significance of DNA amplification in cancer is thought to be due to the selection of increased expression of a single or few important genes. However, systematic surveys of the copy number and expression of all genes within an amplified region of the genome have not been performed. Here we have used a combination of molecular, genomic, and microarray technologies to identify target genes for 17q23, a common region of amplification in breast cancers with poor prognosis. Construction of a 4-Mb genomic contig made it possible to define two common regions of amplification in breast cancer cell lines. Analysis of 184 primary breast tumors by fluorescence in situ hybridization on tissue microarrays validated these results with the highest amplification frequency (12.5%) observed for the distal region. Based on GeneMap'99 information, 17 known genes and 26 expressed sequence tags were localized to the contig. Analysis of genomic sequence identified 77 additional transcripts. A comprehensive analysis of expression levels of these transcripts in six breast cancer cell lines was carried out by using complementary DNA microarrays. The expression patterns varied from one cell line to another, and several overexpressed genes were identified. Of these, RPS6KB1, MUL, APPBP2, and TRAP240 as well as one uncharacterized expressed sequence tag were located in the two common amplified regions. In summary, comprehensive analysis of the 17q23 amplicon revealed a limited number of highly expressed genes that may contribute to the more aggressive clinical course observed in breast cancer patients with 17q23-amplified tumors.
DNA amplification is an important mechanism that allows cancer cells to increase expression of critical genes, such as oncogenes and genes conferring drug resistance. In breast cancer, several genes, such as ERBB2 (at 17q12), MYC (8q24), and CCND1 (11q13), are known to be amplified in 10–25% of tumors, and their amplification is associated with advanced stage of the disease (1, 2). Several other regions of the genome also are amplified in breast cancer. Efforts are underway to identify the genes affected in these amplifications and their role in breast cancer development. For example, studies of the 20q12-q13 amplification have implicated a number of genes with putative oncogenic potential, such as AIB1, BTAK, CAS-1, and ZNF217 (3–6), indicating that multiple genes may be activated in a given amplification locus.
The chromosomal region 17q23 initially was found to be amplified in breast cancer based on genomewide copy number analysis by comparative genomic hybridization (CGH) (7). The 17q23 amplification is seen in ≈20% of primary breast tumors by CGH, and it seems to be more common in high-grade tumors (8, 9) and in tumors from BRCA1 or BRCA2 mutation carriers (10). Recently, we showed that this amplification is associated with poor prognosis of breast cancer patients (11), suggesting that genes affected by this amplification may have a crucial role in breast cancer progression. Copy number gains at 17q23 by CGH also have been reported in tumors of the brain (12–14), lung (15, 16), bladder (17), testis (18), and liver (19), indicating that genes located at 17q23 may contribute to the development of other tumor types as well.
To date, five genes (RPS6KB1, RAD51C, PAT1/APPBP2, SIGMA1B, and TBX2) have been implicated as putative target genes for the 17q23 amplification (11, 20–22). In the present study, we describe a comprehensive characterization of the 17q23 amplification in breast cancer, including molecular cloning of an about 4-Mb region at 17q23 and detailed evaluation of the amplicon structure in breast cancer cell lines and primary breast tumors. A full expression profiling of the amplified region was performed by using a custom-made complementary DNA (cDNA) microarray containing 156 transcripts from the 17q23 region as well as all known genes mapping to chromosome 17.
Materials and Methods
Physical and Transcript Mapping.
Yeast artificial chromosome (YAC) clones representing the amplified region were identified from the Whitehead Institute database (http://www-genome.wi.mit.edu/) by using mapping information from our previous study (23). Corresponding sequence tag sites (STSs) and expressed sequence tags (ESTs) were identified from the dbSTS and dbEST databases (http://www.ncbi.nlm.nih.gov/), and their location in the YACs was confirmed by PCR. The STSs and ESTs were used to screen commercially available P1 and bacterial artificial chromosome (BAC) libraries (Genome Systems, St. Louis; Research Genetics, Huntsville, AL) or a PAC library provided by Pieter J. De Jong (Roswell Park Institute, Buffalo, NY). New STSs were generated by clone end sequencing. The STS, EST, and clone end sequences were compared against the nr and htgs databases by using the blastn program (http://www.ncbi.nlm.nih.gov/BLAST/) to identify genomic clones with sequence information. All clones were hybridized to normal metaphase chromosomes to verify their chromosomal location and in some instances fiber-fluorescence in situ hybridization (FISH) was performed to confirm the clone order as described (23, 24). To create a transcript map for the amplified region, ESTs identified from the Whitehead YAC map and GeneMap'99 (http://www.ncbi.nlm.nih.gov/genemap) were localized to the contig by PCR. All primer sequences, PCR conditions, and genomic clone information are available on request.
Breast Cancer Cell Lines.
Seven breast cancer cell lines (BT-474, HCC1428, MCF7, MDA-157, MDA-361, MDA-436, and UACC-893; American Type Culture Collection) were used in this study. Normal human mammary epithelial cells were obtained from Clonetics (Walkersville, MD). Cells were grown under recommended culture conditions.
Tissue Microarray.
The tissue microarray used in this study has been described (25) and included 372 ethanol-fixed primary breast cancers from the Institute of Pathology, University of Basel. The tumors were 69.6% ductal, 14% lobular, 2.4% medullary, 1.6% mucinous, 8.4% other rare histological subtypes, and 4% ductal carcinoma in situ. The grade distribution was 24% grade 1, 40% grade 2, and 36% grade 3. All specimens evaluated were anonymous, archival tissue specimens. The use of these tissue specimens for tissue microarray analysis was approved by the National Institutes of Health Institutional Review Board.
FISH.
Dual-color interphase FISH to breast cancer cell lines was done as described (23). Probes were labeled with SpectrumOrange (Vysis, Downers Grove, IL) by random priming, and a SpectrumGreen-labeled chromosome 17 centromere probe (Vysis) was used as a reference. Twenty-five nonoverlapping nuclei with intact morphology based on the 4′,6-diamidino-2-phenylindole counterstain were scored to determine the mean number of hybridization signals for each probe. FISH to the tissue microarray was done as described (25). Briefly, consecutive sections of the array were deparaffinized, dehydrated in ethanol, denatured at 74°C for 5 min in 70% formamide/2×SSC, and hybridized with labeled test and control probes. Specimens containing tight clusters of test probe signals or more than a 3-fold increase in the number of test probe signals, as compared with chromosome 17 centromere signals, in at least 10% of the tumor cells were considered to be amplified.
Chromosome 17-Specific cDNA Microarray.
Clones for the cDNA microarray were selected based on the information available in GeneMap'99 (http://www.ncbi.nlm.nih.gov/genemap) and included all known genes on chromosome 17 and all ESTs from intervals D17S933-D17S930 (293–325 cR, the ERBB2 locus) and D17S791-D17S795 (333–435 cR, the 17q23-q24 region). Seventy-seven additional transcribed sequences (34 Unigene clusters and 43 single ESTs) were identified from genomic sequence of nine BAC clones (1073f15, 178c3, 217 l10, 215p18, 987k16, 15k2, 332h18, 136h19, and 264b14) by performing sequence similarity searches to the dbEST database with genemachine software (http://genemachine.nhgri.nih.gov/). A total of 636 clones, including 156 clones from the 17q23 region (35 clones from the contig, 77 clones identified from the genomic sequence, and 44 additional transcripts from radiation hybrid map interval 367–386 cR corresponding to our contig), were placed on the array. These included 201 known genes, 20 of which came from the 17q23 region. Full information on the clone identity is available in Table 1, which is published as supplemental material on the PNAS web site, www.pnas.org. The preparation and printing of the cDNA clones on glass slides were performed as described (26, 27). Each clone was printed in duplicate.
Copy Number and Expression Analyses by cDNA Microarrays.
The CGH microarray analysis was done as described (28) with slight modifications. Briefly, 20 μg of genomic DNA from breast cancer cell lines and normal placental reference was digested for 14–18 h with AluI and RsaI restriction enzymes (Life Technologies, Rockville, MD) and purified by phenol/chloroform extraction. Six micrograms of digested cell line DNA was labeled with Cy3-dUTP (Amersham Pharmacia) and 8 μg of placental DNA with Cy5-dUTP (Amersham Pharmacia) by using a Bioprime Labeling kit (Life Technologies). Hybridization was done according to the protocol by Pollack et al. (28), and posthybridization washes were as described (29, 30). For the expression analyses, total RNA (MDA-361 and UACC-893) or mRNA (BT-474, HCC1428, MCF7, MDA-157, MDA-436, and human mammary epithelial cells) was extracted by using a FASTTRACK 2.0 kit (Invitrogen). The breast cancer cell line MDA-436 with no copy number increase at 17q23 (see Results) was used as a standard reference in all experiments. Sixteen micrograms of MDA-436 mRNA was labeled with Cy5-dUTP and 4 μg of test mRNA or 80 μg of total RNA with Cy3-dUTP by use of oligo(dT)-primed polymerization by SuperScript II reverse transcriptase (Life Technologies). The labeled cDNAs were hybridized on microarrays as described (29, 30). For both the copy number and expression analyses, the fluorescence intensities at the targets were measured by using a laser confocal scanner (Agilent Technologies, Palo Alto, CA). The fluorescent images from the test and control hybridizations were scanned separately, and the data were analyzed by using dearray software (31). After background subtraction, average intensities at each spot in the test hybridization were divided by the average intensity of the same spot in the control hybridization. For the copy number analysis, the ratios were normalized on the basis of the distribution of ratios of all targets on the array and for the expression analysis on the basis of 88 housekeeping genes (29).
Results
Molecular Cloning of the Amplified Region at 17q23.
Seven YAC clones were shown to be nonchimeric by metaphase FISH and amplified in MCF7 breast cancer cell line (data not shown) and served as the basis for contig construction. Approximately a 4-Mb contig (with a single gap of unknown size) was constructed between markers WI-16256 and D17S948 (Fig. 1A). The contig consists of 74 large insert size P1 artificial chromogene, BAC, and P1 clones representing at least a 2-fold coverage, and part of it has been published previously (32). A total of 17 known genes and 26 ESTs were positioned in the contig by STS mapping.
Figure 1.

(A) Physical and transcript map of the 17q23 region. A minimal tiling path consisting of 57 clones between markers WI-16256 and D17S948 is shown. YAC clones are symbolized by thick bars and BAC, P1 artificial chromogene (PAC), and P1 clones by thin bars. A gap of unknown size in the contig is marked with an arrow. STSs are indicated on the top of the contig while ESTs and known genes (marked in red) are shown under the contig. The clones marked with red bars were used for copy number analysis as illustrated in B. The map is not drawn in scale. (B) Amplicon mapping in MCF7 and BT-474 breast cancer cell lines. DNA sequence copy number changes were analyzed by interphase FISH using 22 clones from the contig (indicated in red in A). The mean absolute copy number per cell is plotted for each probe.
Copy Number Analysis in Breast Cancer Cell Lines and Primary Breast Tumors.
Seven breast cancer cell lines (BT-474, HCC1428, MCF7, MDA-157, MDA-361, MDA-436, and UACC-893) were screened by interphase FISH to define a minimal common region of amplification at 17q23. Copy number analysis using 22 clones from the contig showed high-level amplification in BT-474 and MCF7 cell lines (Fig. 1B). In BT-474 cells, the copy number increases ranged from an average of 9–37 copies per cell (1.5- to 6.5-fold relative to the chromosome 17 centromere) and in MCF7 cells from an average of 7–55 copies per cell (2.3- to 18-fold). Both cell lines had two separate, but partly overlapping, regions of high-level amplification that allowed identification of two major common regions of involvement: one from clone 242o20 to 58p18 and another from clone 52i20 to 215p18. Clone 52a23 at the distal end of the contig also showed amplification in both cell lines. Low-level amplification of 17q23 was detected in the MDA-157, MDA-361, HCC1428, and UACC-893 cell lines (data not shown). MDA-157 had an average of seven copies per cell (2-fold amplification relative to the chromosome 17 centromere) of all 22 probes tested, MDA-361 had 7–12 copies per cell (2- to 3-fold amplification), and HCC1428 and UACC-893 had 6–8 copies per cell (3- to 4-fold amplification). No copy number increase was observed in the MDA-436 cell line (data not shown).
To extend the initial studies on breast cancer cell lines to a very large number of primary tumors, copy numbers of 10 selected clones were analyzed by using a tissue microarray containing 372 primary breast tumors. Evaluable results with all 10 clones were obtained in 184 tumors and the amplification frequencies ranged from 3.8% to 12.5% (Fig. 2A) with the most frequently amplified core region (five clones) located in the middle of our 17q23 map. Twenty-seven tumors (15%) showed amplification of at least one of the clones (Fig. 2B). The majority of these (20/27; 74%) showed coamplification of at least five of the clones, indicating that amplicons in this region are usually large and continuous (Fig. 2B). The remaining seven tumors showed amplification of 1–4 clones. The highest frequency of amplification was around clone 224b10, but the differences between the individual clones were not sufficient to confine amplification within the core region defined by the five clones (Fig. 2B).
Figure 2.

Amplicon mapping in primary breast tumors by FISH to tissue microarray. (A) Amplification frequencies of 10 clones from the 17q23 contig in 184 primary breast tumors. (B) Amplification patterns in 27 primary breast tumors that showed amplification with at least one of the probes tested. Rows correspond to individual tumor samples and columns to each clone. Empty boxes represent no copy number increase and shaded boxes indicate amplification.
Comprehensive Analysis of Copy Number and Expression of Genes from Chromosomal Region 17q23 Using cDNA Microarrays.
After the region of amplification was approximately defined by physical mapping and tissue microarray-based amplicon mapping, we resorted to high-resolution DNA microarray analysis (a total of 636 cDNA clones from chromosome 17, 156 of these from 17q23) to identify the specific genes involved in this region. The copy number analysis in six breast cancer cell lines (BT-474, HCC1428, MCF7, MDA-157, MDA-361, and UACC-893) by CGH to the cDNA microarray identified a distinct region of increased copy number at 370–390 cR (Fig. 3A). The location of this region corresponds to the location obtained by FISH mapping at 17q23. This broad survey of the entire chromosome indicates that the region defined by us is the major amplification locus at 17q23.
Figure 3.

Copy number (A) and expression (B) survey of chromosome 17-specific genes in MCF7 breast cancer cell line by cDNA microarrays. The copy number and expression ratio data are plotted as a function of the position of the clones in the radiation hybrid map in cR scale. Individual data points are connected with a line. A moving average of three (a mean copy number ratio of three adjacent clones) is shown in A. (C) The copy number ratio as a function of the expression ratio in MCF7 breast cancer cell line. The oval indicates a set of genes that are both highly amplified and overexpressed. Each clone was printed in duplicate on the array, and results from both observations are shown.
The cDNA microarray analysis for expression of the 636 chromosome 17-specific genes (Table 1) indicated multiple highly overexpressed genes corresponding to the amplicon (Fig. 3 B and C). Focused evaluation of 156 clones from the 17q23 region in the six cell lines with 17q23 amplification identified a total of 19 transcripts that were overexpressed (greater than 3-fold) in at least three of the cell lines but not in the normal mammary epithelial cells. Sixteen of the overexpressed sequences were located within our contig (five of these originated from the genomic sequence) and included five known genes (MPO, MUL, RPS6KB1, APPBP2, and TRAP240) (Fig. 4). Five of the overexpressed sequences (the MUL, RPS6KB1, APPBP2, and TRAP240 genes as well as one uncharacterized EST, AA806470) mapped in the common amplified regions identified by FISH in the breast cancer cell lines.
Figure 4.
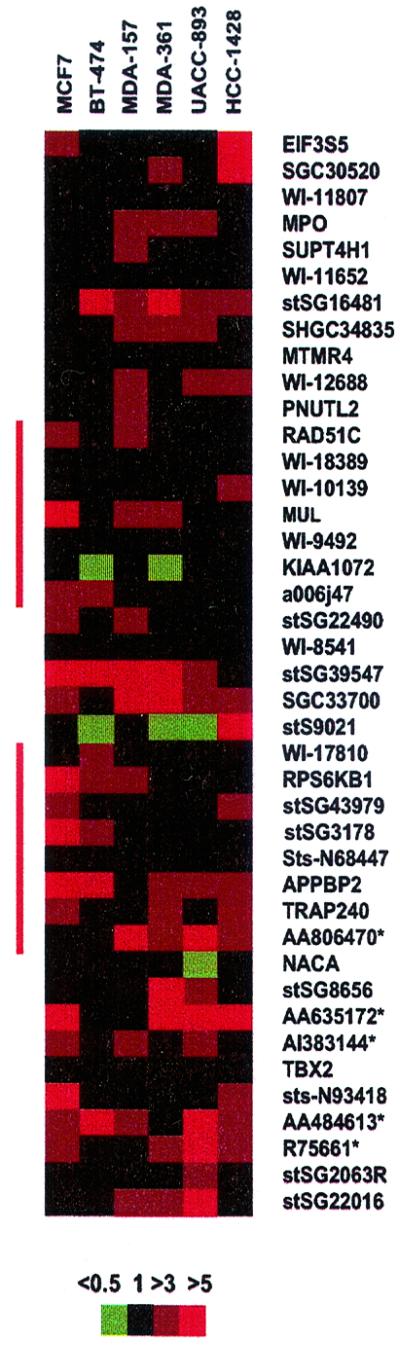
Expression map of the 17q23 region in six breast cancer cell lines. Each column represents one breast cancer cell line and each row a transcribed sequence arranged according to their physical order in the 17q23 contig from centromere to telomere. ESTs obtained from the genomic sequence are shown only if they were overexpressed in at least three cell lines and are indicated with an *. Color coding for the expression ratio is shown below the expression map. The locations of the common amplification regions identified in the breast cancer cell lines are indicated with red vertical bars.
Discussion
Studies by CGH have indicated that the 17q23 region is one of the most commonly amplified regions in breast cancer and therefore may harbor genes important for breast cancer development and progression. Previous studies by us and others have implicated five known genes (RPS6KB1, RAD51C, PAT1/APPBP2, SIGMA1B, and TBX2) as putative target genes for this amplification (11, 20–22). In the present study, we undertook a detailed analysis of the 17q23 amplicon in breast cancer cell lines and a large series of primary breast tumors and used the cDNA microarray technology for comprehensive evaluation of copy numbers and expression levels of 156 transcripts from this chromosomal region.
A 4-Mb contig was constructed for the 17q23 region and the precise locations of 17 known genes and 26 transcripts identified from GeneMap'99 were determined within this contig. To obtain a more complete representation of all genes from this region, we also used the genomic sequence generated by the Human Genome Project. Although the sequence based analysis did not cover the entire 17q23 region, we were able to identify a large number of transcribed sequences that were not present in GeneMap'99, indicating the importance of such bioinformatics effort in uncovering and localization of novel genes.
The structure of the 17q23 amplicon was evaluated in detail in six breast cancer cell lines by using 22 genomic clones from the contig. Amplicon mapping in the MCF7 cell line identified two separate highly amplified regions flanked by a region of low-level amplification. BT-474 cell line showed amplification of a single large segment that overlapped both of the regions identified in MCF7 and therefore allowed the definition of two separate common regions of amplification. A recent study by Wu et al. (22) also identified two regions of amplification at 17q23 in MCF7 and a single region in BT-474, but these regions did not overlap with each other. This discrepancy is most likely due to the fact that the study by Wu et al. relied on GeneMap'99 for mapping information. Unfortunately, the radiation hybrid map does not represent the true order and position of genes in a given chromosomal region, and detailed physical mapping studies are necessary for accurate evaluation of amplicon structures. It is expected that the complete human genome sequence will replace the radiation hybrid map in the near future and therefore will make such very tedious physical mapping efforts unnecessary.
We also studied the 17q23 amplification in a large set of primary breast tumors by using tissue microarray technology. The amplification frequencies of 10 clones from the contig varied from 3.8% to 12.5%. In 74% of the tumors with amplification, five or more clones were coamplified, suggesting that in most primary tumors a large continuous segment at 17q23 is involved in amplification. However, in a few cases smaller regions of involvement were observed but did not allow definition of a single common region of amplification. These results again differ from those obtained by Wu et al. (22), who studied amplification patterns of four genes from this region and showed coamplification in only two of the 26 amplified tumors. This difference might be explained by differences in the tumor materials analyzed but are most likely due to technical variances in the interpretation of Southern data as compared with the higher precision of copy number evaluation that is possible by FISH analysis.
To fully analyze the copy number and expression patterns of 17q23-specific genes in breast cancer cell lines, we constructed a custom-made cDNA microarray containing 636 cDNA clones including all known genes from chromosome 17 and 156 transcripts from the 17q23 region. CGH microarray analysis indicated a distinct region of amplification at 17q23 and the expression profiling revealed 16 genes that were overexpressed in at least three of the six 17q23-amplified cell lines. Of these, RPS6KB1, APPBP2, TRAP240, and an uncharacterized EST, AA806470, were located in the region found to be commonly amplified in the breast cancer cell lines as well as in primary breast tumors and therefore may contribute to the more aggressive clinical course observed in breast cancer patients with 17q23-amplified tumors (11). In addition, the MUL gene was highly amplified and overexpressed in cell lines, but was located in a region less frequently amplified in primary breast tumors. Furthermore, it is possible that other highly overexpressed genes, such as those represented by ESTs stSG39547, SGC33700, and AA635172, although not located in the common regions of amplification, also play a significant role in breast cancer pathogenesis.
The cDNA microarray analysis confirmed the previous data from us and others (11, 20–22) suggesting RPS6KB1, a mediator involved in G1- to S-phase progression of the cell cycle (33), and APPBP2, a cytoplasmic protein that is involved in cellular trafficking of amyloid precursor protein (34), as putative targets for the 17q23 amplification. Of the other previously implicated 17q23 genes, SIGMA1B was not included in this survey, RAD51C was overexpressed in two cell lines, and TBX2 did not show overexpression possibly due to the difficulty in quantitation of scarce messages by cDNA microarray. The present cDNA microarray analysis indicated that other genes also are activated by the 17q23 amplification. The MUL gene was recently cloned and showed to encode for a member of the zinc finger protein family with RING-B-box-Coiled-coil domain (35). Members of this protein family have various functions, including regulation of development and cell proliferation (36, 37), and some of them, such as MDM2 and BRCA1, have an established role in cancer, thus making MUL a very interesting putative target gene for the 17q23 amplification. TRAP240 belongs to a large multisubunit complex of thyroid hormone receptor-associated proteins that in a ligand-dependent manner interact with thyroid receptor and activate transcription of genes involved in diverse biological processes (38). The cDNA microarray survey also implicated an uncharacterized EST (AA806470) from the amplified region as putative target gene. Interestingly, this EST was originally identified through our analysis of the genomic sequence from this region.
This study is a comprehensive characterization of the 17q23 amplification in breast cancer where a combination of molecular, genomic, and microarray technologies was used to systematically identify target genes for an amplicon. A genomic contig was constructed to accurately map transcribed sequences to the region and to map the amplicon boundaries in breast cancer cell lines and in a large set of primary breast tumors. By taking advantage of our transcript map, the genomic sequence information, and GeneMap'99, a complete expression profiling of the 17q23 amplicon was performed and revealed a limited number of genes that may have a crucial role in breast cancer progression. This study represents a unique concept for systematic evaluation of gene copy number and gene expression changes of all transcripts in a specific chromosomal region by using cDNA microarrays. As the sequence information from the Human Genome Project becomes increasingly available, construction of such full representation targeted microarrays will become easier. Targeted cDNA microarray surveys of all genes in a specific chromosomal region are likely to be important not only in identification of amplification target genes in cancer but also in a wide variety of other applications.
Supplementary Material
Acknowledgments
We thank Natalie Goldberger, Nasser Z. Parsa, Art Glatfelter, Chris Gooden, and Christiane Robbins for their excellent technical assistance. This study was supported in part by the Academy of Finland, Emil Aaltonen Foundation, the Finnish Medical Society Foundation, the Finnish Cultural Foundation, Sigrid Juselius Foundation, and Tampere University Hospital Research Foundation.
Abbreviations
- BAC
bacterial artificial chromosome
- cDNA
complementary DNA
- CGH
comparative genomic hybridization
- EST
expressed sequence tag
- FISH
fluorescence in situ hybridization
- STS
sequence tag site
- YAC
yeast artificial chromosome
Footnotes
This paper was submitted directly (Track II) to the PNAS office.
References
- 1.Ross J S, Fletcher J A. Semin Cancer Biol. 1999;9:125–138. doi: 10.1006/scbi.1998.0083. [DOI] [PubMed] [Google Scholar]
- 2.Cuny M, Kramar A, Courjal F, Johannsdottir V, Iacopetta B, Fontaine H, Grenier J, Culine S, Theillet C. Cancer Res. 2000;60:1077–1083. [PubMed] [Google Scholar]
- 3.Anzick S L, Kononen J, Walker R L, Azorsa D O, Tanner M M, Guan X Y, Sauter G, Kallioniemi O-P, Trent J M, Meltzer P S. Science. 1997;277:965–968. doi: 10.1126/science.277.5328.965. [DOI] [PubMed] [Google Scholar]
- 4.Sen S, Zhou H, White R A. Oncogene. 1997;14:2195–2200. doi: 10.1038/sj.onc.1201065. [DOI] [PubMed] [Google Scholar]
- 5.Brinkmann U, Gallo M, Polymeropoulos M H, Pastan I. Genome Res. 1996;6:187–194. doi: 10.1101/gr.6.3.187. [DOI] [PubMed] [Google Scholar]
- 6.Collins C, Rommens J M, Kowbel D, Godfrey T, Tanner M, Hwang S I, Polikoff D, Nonet G, Cochran J, Myambo K, et al. Proc Natl Acad Sci USA. 1998;95:8703–8708. doi: 10.1073/pnas.95.15.8703. [DOI] [PMC free article] [PubMed] [Google Scholar]
- 7.Kallioniemi A, Kallioniemi O-P, Piper J, Tanner M, Stokke T, Chen L, Smith H S, Pinkel D, Gray J W, Waldman F M. Proc Natl Acad Sci USA. 1994;91:2156–2160. doi: 10.1073/pnas.91.6.2156. [DOI] [PMC free article] [PubMed] [Google Scholar]
- 8.Moore E, Magee H, Coyne J, Gorey T, Dervan P A. J Pathol. 1999;187:403–409. doi: 10.1002/(SICI)1096-9896(199903)187:4<403::AID-PATH284>3.0.CO;2-J. [DOI] [PubMed] [Google Scholar]
- 9.Roylance R, Gorman P, Harris W, Liebmann R, Barnes D, Hanby A, Sheer D. Cancer Res. 1999;59:1433–1436. [PubMed] [Google Scholar]
- 10.Tirkkonen M, Johansson O, Agnarsson B A, Olsson H, Ingvarsson S, Karhu R, Tanner M, Isola J, Barkardottir R B, Borg A, Kallioniemi O-P. Cancer Res. 1997;57:1222–1227. [PubMed] [Google Scholar]
- 11.Bärlund M, Forozan F, Kononen J, Bubendorf L, Chen Y, Bittner M L, Torhorst J, Haas P, Bucher C, Sauter G, et al. J Natl Cancer Inst. 2000;92:1252–1259. doi: 10.1093/jnci/92.15.1252. [DOI] [PubMed] [Google Scholar]
- 12.Brinkschmidt C, Christiansen H, Terpe H J, Simon R, Boecker W, Lampert F, Stoerkel S. J Pathol. 1997;181:394–400. doi: 10.1002/(SICI)1096-9896(199704)181:4<394::AID-PATH800>3.0.CO;2-1. [DOI] [PubMed] [Google Scholar]
- 13.Vandesompele J, Van Roy N, Van Gele M, Laureys G, Ambros P, Heimann P, Devalck C, Schuuring E, Brock P, Otten J, et al. Genes Chromosomes Cancer. 1998;23:141–152. doi: 10.1002/(sici)1098-2264(199810)23:2<141::aid-gcc7>3.0.co;2-2. [DOI] [PubMed] [Google Scholar]
- 14.Weber R G, Bostrom J, Wolter M, Baudis M, Collins V P, Reifenberger G, Lichter P. Proc Natl Acad Sci USA. 1997;94:14719–14724. doi: 10.1073/pnas.94.26.14719. [DOI] [PMC free article] [PubMed] [Google Scholar]
- 15.Ried T, Petersen I, Holtgreve-Grez H, Speicher M R, Schröck E, du Manoir S, Cremer T. Cancer Res. 1994;54:1801–1806. [PubMed] [Google Scholar]
- 16.Schwendel A, Langreck H, Reichel M, Schröck E, Ried T, Dietel M, Petersen I. Int J Cancer. 1997;74:86–93. doi: 10.1002/(sici)1097-0215(19970220)74:1<86::aid-ijc15>3.0.co;2-g. [DOI] [PubMed] [Google Scholar]
- 17.Richter J, Jiang F, Gorog J P, Sartorius G, Egenter C, Gasser T C, Moch H, Mihatsch M J, Sauter G. Cancer Res. 1997;57:2860–2864. [PubMed] [Google Scholar]
- 18.Korn W M, Oide Weghuis D E, Suijkerbuijk R F, Schmidt U, Otto T, du Manoir S, Geurts van Gessel A, Harstrick A, Seeber S, Becher R. Genes Chromosomes Cancer. 1996;17:78–87. doi: 10.1002/(SICI)1098-2264(199610)17:2<78::AID-GCC2>3.0.CO;2-Y. [DOI] [PubMed] [Google Scholar]
- 19.Marchio A, Meddeb M, Pineau P, Danglot G, Tiollais P, Bernheim A, Dejean A. Genes Chromosomes Cancer. 1997;18:59–65. [PubMed] [Google Scholar]
- 20.Couch F J, Wang X-Y, Wu G-J, Qian J, Jenkins R B, James C D. Cancer Res. 1999;59:1408–1411. [PubMed] [Google Scholar]
- 21.Bärlund M, Monni O, Kononen J, Cornelison R, Torhorst J, Sauter G, Kallioniemi O-P, Kallioniemi A. Cancer Res. 2000;60:5340–5344. [PubMed] [Google Scholar]
- 22.Wu G J, Sinclair C S, Paape J, Ingle J N, Roche P C, James C D, Couch F J. Cancer Res. 2000;60:5371–5375. [PubMed] [Google Scholar]
- 23.Bärlund M, Nupponen N N, Karhu R, Tanner M M, Paavola P, Kallioniemi O-P, Kallioniemi A. Cytogenet Cell Genet. 1998;82:189–191. doi: 10.1159/000015096. [DOI] [PubMed] [Google Scholar]
- 24.Heiskanen M, Karhu R, Hellsten E, Peltonen L, Kallioniemi O-P, Palotie A. BioTechniques. 1994;17:928–934. [PubMed] [Google Scholar]
- 25.Kononen J, Bubendorf L, Kallioniemi A, Bärlund M, Schraml P, Leighton S, Torhorst J, Mihatsch M J, Sauter G, Kallioniemi O-P. Nat Med. 1998;4:844–847. doi: 10.1038/nm0798-844. [DOI] [PubMed] [Google Scholar]
- 26.DeRisi J, Penland L, Brown P O, Bittner M L, Meltzer P S, Ray M, Chen Y, Su Y A, Trent J M. Nat Genet. 1996;14:457–460. doi: 10.1038/ng1296-457. [DOI] [PubMed] [Google Scholar]
- 27.Shalon D, Smith S J, Brown P O. Genome Res. 1996;6:639–645. doi: 10.1101/gr.6.7.639. [DOI] [PubMed] [Google Scholar]
- 28.Pollack J R, Perou C M, Alizadeh A A, Eisen M B, Pergamenschikov A, Williams C F, Jeffrey S S, Botstein D, Brown P O. Nat Genet. 1999;23:41–46. doi: 10.1038/12640. [DOI] [PubMed] [Google Scholar]
- 29.Khan J, Simon R, Bittner M, Chen Y, Leighton S B, Pohida T, Smith P D, Jiang Y, Gooden G C, Trent J M, Meltzer P S. Cancer Res. 1998;58:5009–5013. [PubMed] [Google Scholar]
- 30.Mousses S, Bittner M L, Chen Y, Dougherty E R, Baxevanis A, Meltzer P S, Trent J M. In: Functional Genomics. Livesey F J, Hunt S P, editors. Oxford: Oxford Univ. Press; 2000. pp. 113–137. [Google Scholar]
- 31.Chen Y, Dougherty E R, Bittner M L. J Biomed Optics. 1997;2:364–374. doi: 10.1117/12.281504. [DOI] [PubMed] [Google Scholar]
- 32.Paavola P, Avela K, Horelli-Kuitunen N, Bärlund M, Kallioniemi A, Idänheimo N, Kyttälä M, de la Chapelle A, Palotie A, Lehesjoki A-E, Peltonen L. Genome Res. 1999;9:267–276. [PMC free article] [PubMed] [Google Scholar]
- 33.Chou M M, Blenis J. Curr Opin Cell Biol. 1995;7:806–814. doi: 10.1016/0955-0674(95)80064-6. [DOI] [PubMed] [Google Scholar]
- 34.Zheng P, Eastman J, Vande Pol S, Pimplikar S W. Proc Natl Acad Sci USA. 1998;95:14745–14750. doi: 10.1073/pnas.95.25.14745. [DOI] [PMC free article] [PubMed] [Google Scholar]
- 35.Avela K, Lipsanen-Nyman M, Idänheimo N, Seemanova E, Rosengren S, Mäkelä T P, Perheentupa J, de la Chapelle A, Lehesjoki A-E. Nat Genet. 2000;25:298–301. doi: 10.1038/77053. [DOI] [PubMed] [Google Scholar]
- 36.Saurin A J, Borden K L, Boddy M N, Freemont P S. Trends Biochem Sci. 1996;21:208–214. [PubMed] [Google Scholar]
- 37.Slack F J, Ruvkun G. Trends Biochem Sci. 1998;23:474–475. doi: 10.1016/s0968-0004(98)01299-7. [DOI] [PubMed] [Google Scholar]
- 38.Mangelsdorf D J, Evans R M. Cell. 1995;83:841–850. doi: 10.1016/0092-8674(95)90200-7. [DOI] [PubMed] [Google Scholar]
Associated Data
This section collects any data citations, data availability statements, or supplementary materials included in this article.