Abstract
S-adenosyl-L-homocysteine hydrolase (SAHH) catalyzes the reversible conversion of S-adenosyl-L-homocysteine (SAH) to adenosine (ADO) and L-homocysteine (Hcy), promoting methyltransferases activity by relief of SAH inhibition. SAH catabolism is linked to S-adenosylmethionine metabolism and the development of SAHH inhibitors is of interest for new therapeutics with anti-cancer or cholesterol-lowering effects. We have developed a continuous enzymatic assay for adenosine that facilitates high-throughput analysis of SAHH. This luciferase-based assay is 4000-fold more sensitive than former detection methods and is well suited for continuous monitoring of ADO formation in a 96 well plate format. The high-affinity adenosine kinase from Anopheles gambiae (AgAK) efficiently converts adenosine to AMP in the presence of GTP. AMP is converted to ATP and coupled to firefly luciferase. With this procedure, kinetic parameters (Km, kcat) for SAHH were obtained, in good agreement with literature values. Assay characteristics include sustained light output combined with ultra-sensitive detection (10−7 unit SAHH). The assay is documented with the characterization of slow-onset inhibition for inhibitors of the hydrolase. Application of this assay may facilitate the development of SAHH inhibitors and provide an ultrasensitive detection for the formation of adenosine from other biological reactions.
Keywords: adenosine detection, S-adenosyl-L-homocysteine hydrolase, S-adenosyl-L-homocysteine, luciferase, methyltransferase, adenosine kinase
S-Adenosyl-L-homocysteine hydrolase (SAHH) is the sole enzyme responsible for the catabolism of S-adenosyl-L-homocysteine (SAH) in mammals; it catalyzes the hydrolysis of SAH to adenosine (ADO) and L-homocysteine (Hcy).1 Although the reaction is reversible in vitro, the occurrence of adenosine kinase (AK) and adenosine deaminase (ADA) in cells shifts the chemical equilibrium away from SAH synthesis.2 SAH is both a product of biomethylation reactions and also a strong inhibitor. The selective inhibition of SAHH may promote indirect inhibition of the S-adenosylmethionine mediated transmethylations.3,4 Mechanistic and structural studies have led to an improved understanding of the enzyme,5–9 the design of immunosuppressive and anti-inflammatory agents,10–12 the development of new therapeutics with anti-cancer,13–15 and cholesterol-lowering effects.16–18 More recently, SAHH inhibition has been a focus of anti-parasitic studies.19–21
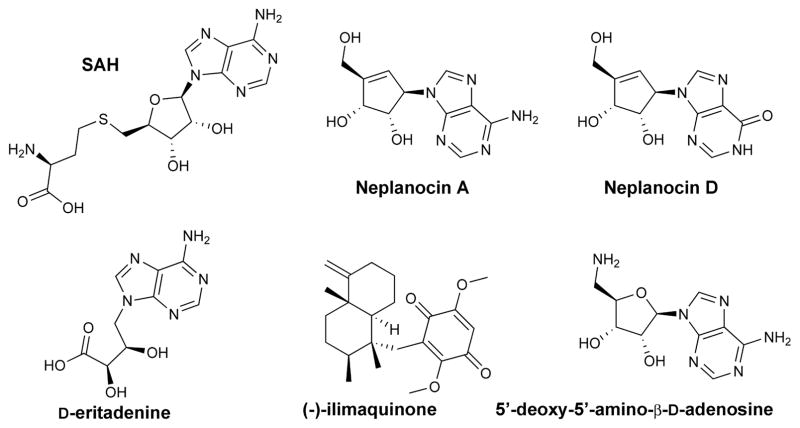
Neplanocin A (INH) and its structural analogues display nanomolar affinity toward SAHH in vitro (Fig. 1). However, in vivo, adenosine analogues are often substrates for ADA and AK enzymes and the formation of neplanocin D and phosphorylated neplanocin A (Fig. 1) explains the high cytotoxicity of these drugs independent of their SAH inhibition.22–24 Although new molecules with different scaffolds are known (e.g. ilimaquinone, D-eritadenine; Fig. 1), there is a need for more specific and powerful SAHH inhibitors.25–28 Rapid and sensitive assays may permit the identification of such compounds by evaluating hits from computational docking, screening chemical libraries or fragment-based design.
Figure 1.
A few examples of SAHH inhibitors. Neplanocin A (INH) is a ‘suicide’ inhibitor with a tight affinity for the hydrolase enzyme. However, in vivo, this drug loses its inhibitory power upon phosphorylation or deamination by adenosine kinase (AK) or adenosine deaminase (ADA), respectively; in the later case, neplanocin D is formed. Therefore, new classes of inhibitors have been identified. D-eritadenine, initially isolated from shiitake mushrooms (Lentinula edodes), exhibits a low nanomolar Ki toward HsSAHH while (−)-ilimaquinone (Smenospongia sp.) or 5′-deoxy-5′-amino-β-D-adenosine (INH-1) display low micromolar affinity with the same enzyme. Note the resemblances with the S-adenosyl-L-homocysteine substrate (SAH).
Current methods to monitor SAHH activity include 1) The detection of ADO formed during the hydrolysis reaction via UV absorbance (coupling with ADA; ε265 = 7760 M−1 cm−1),1 2) the use of radiolabeled substrates combined with the isolation/separation of their corresponding products by resins or HPLC,29,30 and 3) the detection of Hcy with Ellman’s reagent (5-thio-2-nitrobenzoic acid, DTNB; ε412 = 13700 M−1 cm−1) or more recently the use of fluorosurfactant-capped gold nanoparticules.31,32
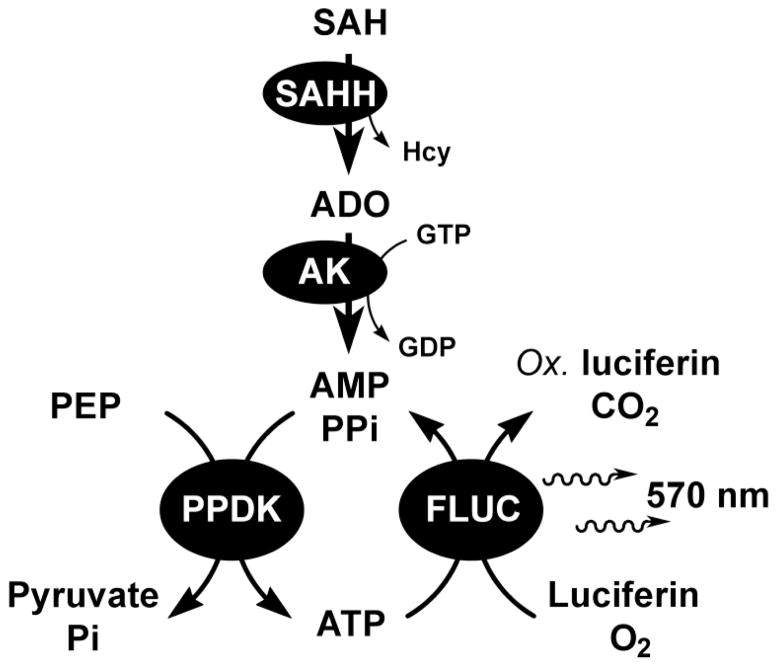
In this study we introduce a firefly luciferase-based assay that can detect picomole levels of ADO generated during the SAH hydrolysis catalyzed by SAHH. The product ADO is converted to adenosine monophosphate (AMP) by the highly efficient AK from Anopheles gambiae (KmADO = 230 nM; kcat = 2.7 × 10⁶ M−1 s−1) in presence of the phosphate donor guanosine triphosphate (GTP).33 AMP is converted to ATP by pyruvate phosphate dikinase and firefly luciferase (PPDK and FLUC, respectively) to give a sustained light output (λ = 570 nm). This is distinct from, but shares some common elements with the assays we have previously reported for the detection of ricin and methyltransferases activity.34,35 This assay, illustrated in Figure 2, is a dramatic improvement compared to former methods. This procedure is compatible with a 96 well plate screening format, is 4000-fold more sensitive than current methodologies and permits the detection of ultra low SAHH activity (10−7 unit) without the use of radioactive substrates. SAH hydrolysis can be monitored continuously over an extended period of time (60 min), hence the assay is appropriate to reveal the unprecedented kinetic resolution of slow-onset inhibition with SAHH inhibitors. This assay is also superior to the use of thio-detecting chromophores as DTNB rapidly reacts with cysteine residues from SAHH and inactivates the hydrolase.36 Procedures measuring Hcy with DTNB cannot detect low concentrations of SAHH or monitor the enzymatic reaction for more than five minutes.31
Figure 2.
The coupled luciferase-based assay for detection of ADO released during hydrolysis of SAH as catalyzed by SAHH.
EXPERIMENTAL SECTION
Reagents
Common reagents (Sigma-Aldrich) were used without further purification; GTP and SAH were purified by HPLC (Luna2-C18; phenomenex), desalted, concentrated and stored at −0 °C.37 Reducing agent Tris(hydroxypropyl)-phosphine (THP) was from Novagen. The SAHH inhibitors, D-eritadenine was from Santa Cruz Biotechnology (No. sc-207632) and neplanocin A was from Cayman Chemicals (No. 10584). ATP detection was achieved with “ATPLite™ 1step” (Perkin-Elmer); molecular biology grade water was used for all assays (Fisher Scientific; No. BP2819-1). Enzymatic activities were determined by HPLC and one unit (1 U) is defined as the amount of enzyme which converts 1 μmol of substrate to product per min at 25 °C.
5′-deoxy-5′-amino-β-D-adenosine (INH-1)
This compound was synthesized and purified following a reported procedure; 1H NMR and mass spectroscopy data were in agreement with that reported in the literature.38
Enzymes
The full length human S-adenosyl-L-homocysteine hydrolase (HsSAHH) was from Abcam (No. ab99326). The N-terminal 6× His-Tag adenosine kinase from Anopheles gambiae (AgAK) was expressed and purified as reported previously.33 The Clostridium symbiosum pyruvate phosphate dikinase (CsPPDK) was expressed according to a published protocol (generous gift provided by Dr. Debra Dunaway-Mariano; University of New Mexico).39
Coupled assay buffer
The formation of ADO as a product of the SAHH reaction (2–40 mU L−1) was monitored using the coupling enzymes AgAK (6 U L−1) and CsPPDK (100 U L−1). The 4× concentrated buffer B1 (200 mM TRIS-acetate pH 7.7, 1 mM PEP, 1 mM PPi and 4 mM ammonium chloride; treated with charcoal and filtered sterilized) was supplemented with MgCl2 (10 mM), GTP (0.5 mM), THP (1 mM), ATPlite (following supplier protocol), AK and PPDK. Then, SAHH was added to prepare the final buffer B2 (2× concentrated). Each experiment uses only 25 μL of B2.
Enzymatic assays
Kinetic constants were measured at 25 °C by monitoring luminescence at 570 nm using a SpectraMax L instrument configured with two photo-multipliers (Molecular Devices) in 96 well half-area flat bottom plates (Corning; No. 3992). Luminescence is measured in RLU (Relative Light Units). Briefly, 25 μL of buffer B2 (containing 6.4 nM of HsSAHH; i.e. 4 mU L−1) was mixed with an equal volume of SAH standard solutions (10 to 40 μM). Initial rates were plotted against substrate concentrations and fitted to the Michaelis-Menten equation to yield corresponding Km and kcat values. Typical inhibition assays consisted of several samples containing SAH (40 μM) and various inhibitor concentrations with one control sample (40 μM SAH, without inhibitor). To initiate the reaction, 25 μL of buffer B2 was added and luminescence was recorded for 20–60 min. The slow-onset inhibition phase characterized by its inhibition constant (Ki*) was analyzed using the equation 1:
| (Eq. 1) |
where and are the steady state rates with and without inhibitor, respectively; Km is the Michaelis constant for SAH; [SAH] and [I] are the concentrations of SAH and inhibitor, respectively. If the concentration of inhibitor is less than ten times the concentration of enzyme (e.g. D-eritadenine), the following equation is used to correct for inhibitor depletion by the enzyme:
| (Eq. 2) |
with [I]* the effective inhibitor concentration, and the initial rates with and without inhibitor, respectively; and [E]T is total SAHH concentration.
Z′ factor
The screening window coefficient was determined as previously described using SAHH at 10−7 unit and 20 μM substrate.40 Each experiment consisted of 16 sample replicates (s; enzyme with SAH) and 16 control replicates (c; with SAH but without SAHH). Statistical analysis of the initial rates using the following equation yields the corresponding factor Z′:
| (Eq. 3) |
where μs is the mean value of the initial rates for samples s and σs is the standard deviation of the initial rates for samples s (3σs corresponds to a 99.73% confidence interval).
RESULTS AND DISCUSSION
The quantitation of ATP by luciferase is a sensitive analytical method, which can be generalized to detect any metabolite that can be converted to AMP. Phosphoenol pyruvate dikinase is used to convert AMP to ATP. The luciferase reaction generates light, oxyluciferin and AMP, and cycling of AMP to ATP sustains the luminescent signal (Fig. 2). Recent developments in this field include product detection from ricin and related ribosome inactivating proteins, protein methyltransferases and DNA methyltransferases.34,35
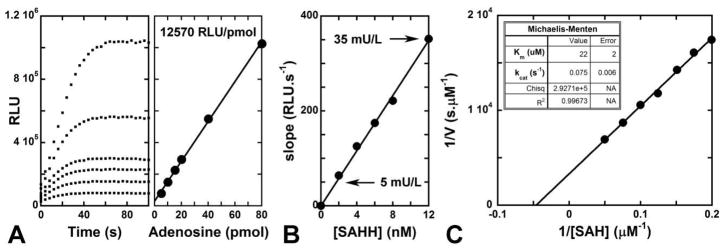
Here we use a highly efficient AK to extend the use of the FLUC system to the detection of ADO produced during the reaction catalyzed by SAHH. Under typical conditions (cf. Experimental Section), ADO is converted to ATP and chemiluminescence (Fig. 3A). The method displays a dynamic range of ADO detection as low as one picomole (Fig. 3A). The rates of the coupling reactions do not limit the observed rates of the assay. Initial velocities for adenosine formation were measured with increasing SAHH concentrations at 20 μM substrate. A linear relationship between luminescence output and enzyme activity was observed (Fig. 3B). AgAK is highly efficient at phosphorylating ADO to AMP and SAH hydrolysis is readily quantitated even at elevated SAHH concentrations (Fig. 3B). Using this assay we determined the kinetic profile as a function of SAH concentration (5–20 μM, at 3.2 nM SAHH). The data fit to the Michaelis-Menten equation gives a kcat of 0.075 ± 0.006 s−1 and a Km of 22 ± 2μM, consistent with reported values (Fig. 3C).7,31,32
Figure 3.
Adenosine detection and analysis of SAHH activity using the coupled assay. (A) ADO calibration. Using PPDK (100 U L−1) and AgAK (6 U L−1), ADO is rapidly converted to light. This assay displays a broad dynamic range for ADO (1–80 pmol). (B) Detection limits for the luciferase-coupled assay. The procedure allows ultra-sensitive detection of SAHH activity (10−7 unit per well). (C) Application of the luciferase assay to the determination of human SAHH kinetic parameters. The enzyme displays a Km of 22 ± 2 μM and a kcat of 0.075 ± 0.006 s−1.
The inhibition constants (Ki) for three known inhibitors of SAHH, D-eritadenine, 5′-deoxy-5′-amino-β-D-adenosine (INH-1) and neplonocin A were determined to demonstrate the applicability of this assay (INH; Fig. 1). These inhibitors include ‘suicide’ and ‘reversible’ inhibitors, to permit analysis of both constant rate and inactivation kinetic parameters.
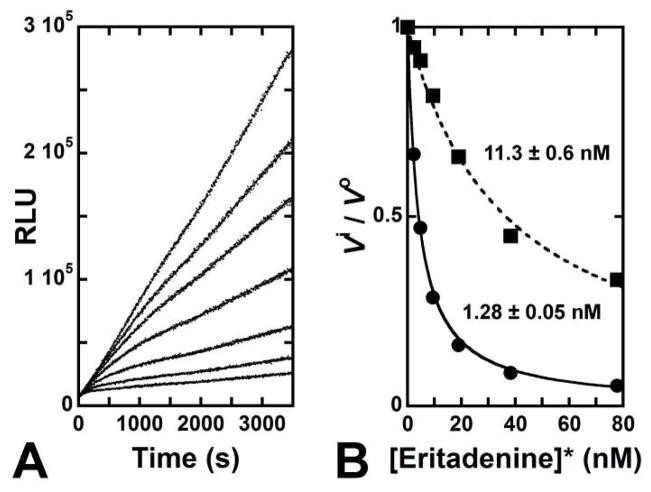
With varied D-eritadenine concentrations (0–80 nM), 3.2 nM SAHH and 20 μM SAH, the inhibition profile for SAHH was established. A two-phase, slow-onset inhibition is observed. Inhibition with a linear rate of ADO formation was observed during the first fifteen minutes of the assay (Fig. 4A). Analysis of this portion of the steady-state kinetic data gave a Ki of 11.3 ± 0.6 nM for D-eritadenine (Fig. 4B, dashed trace). This value is consistent with the literature values of 10–30 nM.5,18 At longer time periods, the light output from ADO production identified a second phase of inhibition associated with slow-onset inhibition (40–60 min; Fig. 4A). Slow-onset inhibition occurs when the initial [Enz•I] complex undergoes a slow conformational change that stabilizes its overall structure, leading to tighter inhibitor binding.41 For D-eritadenine, slow-onset increased inhibitor binding by 10-fold relative to the Ki value (Ki* = 1.28 ± 0.05 nM; Fig. 4B, solid trace).
Figure 4.
Ki evaluation for D-eritadenine. (A) Light output profile monitored for 60 minutes at 80, 40, 20, 10, 5 and 2.5 nM of inhibitor (cf. Experimental Section). (B) D-eritadenine displays slow-onset inhibition with a Ki* of 1.28 ± 0.05 nM (solid trace).
A comparison of the X-ray structures for SAHH with bound D-eritadenine, ADO and SAH readily demonstrate that D-eritadenine causes the enzyme to adopt a more ‘closed conformation’ and interacts more tightly with the enzyme backbone than ADO or SAH.5 Specifically, hydrogen bonds between His352 and N6 and N7 of these inhibitors are significantly shorter when D-eritadenine is bound. The slow-onset inhibition observation provided here is in good agreement with the reported crystallographic analysis. However, there are no previous reports of slow-onset inhibition for this molecule.
The luciferase assay was also used to determine the inhibitory effect of INH-1. Although INH-1 also gives kinetic plots consistent with slow-onset inhibition (Fig. S1A, Supporting Information), it is a relatively poor inhibitor of the SAH hydrolysis reaction (Ki* = 2.17 ± 0.08 μM; Fig. S1B, Supporting Information).25 Detailed evaluation of slow-onset inhibition for weak inhibitors requires high amounts of these molecules (e.g. up to 25 μM for INH-1) and raises a technical problem if the coupling enzymes are inhibited. With the luciferase assay, it is simple and important to perform controls to ensure the inhibitors solely target SAHH. We can easily identify ‘false positives’ from this assay. Addition of an ADO standard at the completion of the assay in the presence of inhibitor will give a light emission pattern equivalent to that without inhibitor to preclude inhibition of coupling enzymes. When this control is done in the presence of INH-1, no inhibition of the AK, PPDK, and FLUC coupling system is observed (Fig. S1C, Supporting Information). Despite its relatively weak binding, the results here establish INH-1 as a slow-onset inhibitor. Although slow-onset inhibitors are most commonly associated with tight binding, SAHH contains protein domains known to reorganize on a slow time scale.42 The observed slow-onset kinetics are likely associated with these changes.
The utility of the luciferase assay was explored with an adenosine nucleoside analogue, neplanocin A (INH). Although this suicide inhibitor is expected to display strong affinity for SAHH (low nanomolar Ki), a 2 μM concentration of INH did not affect the hydrolase activity under the standard assay conditions (cf. Supplementary Methods, Supporting Information).43 We anticipated that INH and related adenosine analogues might be phosphorylated by the AgAK using GTP as the phosphoryl donor during the assay since all coupling enzymes, including AgAK are present in large excess relative to SAHH. Upon addition of AgAK, INH and GTP were consumed and GDP is formed, according to HPLC analysis (Fig. S2A, Supporting Information).
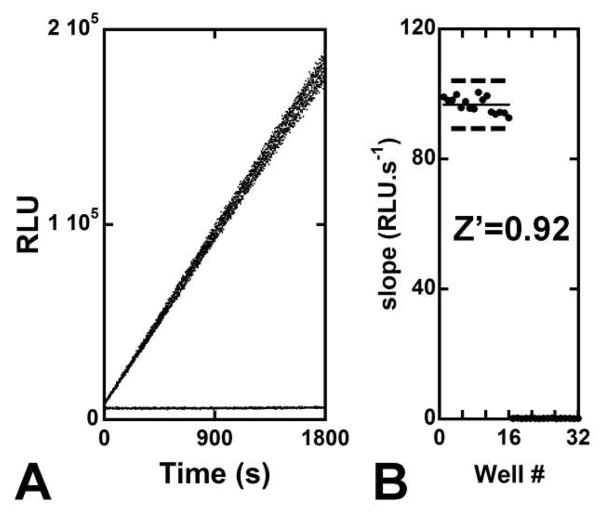
INH inhibition of SAHH was also monitored by ADO formation directly (HPLC analysis) during the SAHH-catalyzed reaction without coupling enzymes (Fig. S2B, Supporting Information). Under these conditions (cf. Supplementary Methods, Supporting Information), INH totally inhibits SAHH. When AgAK and GTP are added to the reaction mixture, inhibition by INH is weak (Fig. S2B, Supporting Information). In vivo, cytotoxicity for INH and similar suicide inhibitors has been due to their reactivity with AK.22,23,43 The use of AgAK in the assay precludes its use for inhibitors acting as substrates for the AgAK-GTP pair. The luciferase assay for ADO quantitation provides a powerful tool in analytical chemistry for the identification of new SAHH inhibitors. Under our experimental conditions, SAH decomposition is insignificant and the formation of ADO is monitored efficiently (Fig. 5A). Published assays for SAHH exhibit low sensitivity or require radioactive substrates. We proposed that the luciferase assay may be suitable for the inhibitory evaluation of compounds, therefore, the suitability of our assay for high-throughput screening (HTS) was estimated. The screening window coefficient (Z′ factor) for this coupled assay was 0.92 (Fig. 5B). This high value (maximum of 1.00 for a perfect assay) reflects the overall quality of this assay.40
Figure 5.
Evaluation and validation of the SAHH coupled assay for high throughput screening. (A) Luminescence recording for samples (s; 20 μM SAH and buffer B2 supplied with 3.2 nM hydrolase) and controls (c; same as s but without HsSAHH); 16 repeats for each ‘samples’ and ‘controls’ sets were run. The assay displays an extremely low background. (B) Determination of the screening window coefficient Z′. Representation of the mean for s and c (plain lines) and their corresponding data variability band (dashed lines); Z′ = 0.92 (cf. Experimental Section).
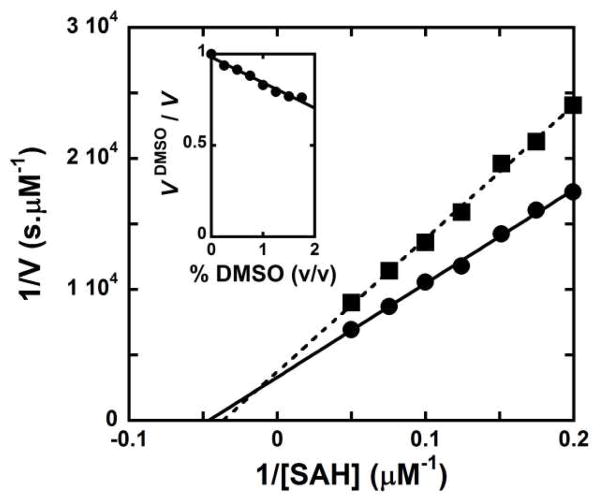
As many compounds from commercial libraries are supplied in DMSO and we determined the compatibility of DMSO with the assay. DMSO causes modest interference with chemiluminescence (inset, Fig. 6). However, the reduction of light output is not the result of interferences with the coupling enzymes since our calibration curve is unchanged (Fig. S3, Supporting Information). DMSO interferes with SAHH catalytic activity (Fig. 6). This solute effect of DMSO is independent of the procedure and solely due to interactions between the solvent and SAHH. With appropriate controls, the screening of libraries supplied in DMSO is appropriate for the luciferase assay.
Figure 6.
Effect of DMSO on the reaction catalyzed by SAHH and on the luciferase assay components.
The luciferase-based quantitation of adenosine has implications beyond its use in enzymatic assays, as characterized here. Adenosine is also a critical metabolite in human metabolism through its interaction with adenosine receptors.44 Adenosine receptors have been identified as therapeutic targets in human conditions as diverse as hypertension, brain and heart ischemia, sleep disorders, inflammatory disorders and cancer. Detection of adenosine in biological samples is therefore important in research and diagnosis of disorders related to its receptor function. A direct extension of the methods described here, together with appropriate controls, can be readily applied to the detection of adenosine in samples of blood and other biological materials.
CONCLUSIONS
We have developed a new assay to monitor ADO and have characterized it with SAH hydrolysis catalyzed by SAHH. Detection of ADO is robust, continuous and can be achieved in the presence of a low quantity of enzyme. The present assay is expected to accommodate a broad range of inhibitors (e.g. low nanomolar to high micromolar Ki). Adenosine analogues phosphorylated by AgAK and GTP are precluded from the assay. Finally, the high Z′ factor highlights the wide applications of this tool and the possible impact of our assay for identification of new SAHH inhibitors using high-throughput screening.
Supplementary Material
Acknowledgments
This work was supported by National Institutes of Health (NIH) Research Grants CA135405 and GM41916.
Footnotes
SUPPORTING INFORMATON AVAILABLE
Experimental procedure for the neplanocin A assay by HPLC. Additional figures as noted in the text. This material is available free of charge via the Internet at http://pubs.acs.org.
References
- 1.Palmer JL, Abeles RH. J Biol Chem. 1979;254:1217–1226. [PubMed] [Google Scholar]
- 2.Turner MA, Yang X, Yin D, Kuczera K, Borchardt RT, Howell PL. Cell Biochem Biophys. 2000;33:101–125. doi: 10.1385/CBB:33:2:101. [DOI] [PubMed] [Google Scholar]
- 3.Ueland PM. Pharmacol Rev. 1982;34:223–253. [PubMed] [Google Scholar]
- 4.Yuan CS, Saso Y, Lazarides E, Borchardt RT, Robins MJ. Exp Opin Ther Patents. 1999;9:1197–1206. [Google Scholar]
- 5.Huang Y, Komoto J, Takana Y, Powell DR, Gomi T, Ogawa H, Fujioka M, Takusagawa F. J Biol Chem. 2002;277:7477–7482. doi: 10.1074/jbc.M109187200. [DOI] [PubMed] [Google Scholar]
- 6.Li QS, Cai S, Borchardt RT, Fang J, Kuczera K, Middaugh CR, Schowen RL. Biochemistry. 2007;46:5798–5809. doi: 10.1021/bi700170m. [DOI] [PubMed] [Google Scholar]
- 7.Li QS, Cai S, Fang J, Borchardt RT, Kuczera K, Middaugh CR, Schowen RL. Biochemistry. 2008;47:4983–4991. doi: 10.1021/bi800175g. [DOI] [PubMed] [Google Scholar]
- 8.Reddy MC, Kuppan G, Shetty ND, Owen JL, Ioerger TR, Sacchettini JC. Protein Sci. 2008;17:2134–2144. doi: 10.1110/ps.038125.108. [DOI] [PMC free article] [PubMed] [Google Scholar]
- 9.Lee KM, Choi WJ, Lee Y, Lee HJ, Zhao LX, Lee HW, Park JG, Kim HO, Hwang KY, Heo YS, Choi S, Jeong LS. J Med Chem. 2011;54:930–938. doi: 10.1021/jm1010836. [DOI] [PubMed] [Google Scholar]
- 10.Gordon RK, Ginalski K, Rudnicki WR, Rychlewski L, Pankaskie MC, Bujnicki JM, Chiang PK. Eur J Biochem. 2003;270:3507–3517. doi: 10.1046/j.1432-1033.2003.03726.x. [DOI] [PubMed] [Google Scholar]
- 11.Fu YF, Zhu YN, Ni J, Zhong XG, Tang W, Re YD, Shi LP, Wan J, Yang YF, Yuan C, Nan FJ, Lawson BR, Zuo JP. J Pharmacol Exp Ther. 2006;319:799–808. doi: 10.1124/jpet.106.107185. [DOI] [PubMed] [Google Scholar]
- 12.Zhang YM, Ding Y, Tang W, Luo W, Gu M, Lu W, Tang J, Zuo JP, Nan FJ. Bioorg Med Chem. 2008;16:9212–9216. doi: 10.1016/j.bmc.2008.09.017. [DOI] [PubMed] [Google Scholar]
- 13.Hermes M, Osswald H, Kloor D. Exp Cell Res. 2007;313:264–283. doi: 10.1016/j.yexcr.2006.10.003. [DOI] [PubMed] [Google Scholar]
- 14.Chiba T, Suzuki E, Negishi M, Saraya A, Miyagi S, Konuma T, Tanaka S, Tada M, Kanai F, Imazeki F, Iwama A, Yokosuka O. Int J Cancer. 2011 doi: 10.1002/ijc.26264. [DOI] [PubMed] [Google Scholar]
- 15.Hayden A, Johnson PW, Packham G, Crabb SJ. Breast Cancer Res Treat. 2011;127:109–119. doi: 10.1007/s10549-010-0982-0. [DOI] [PubMed] [Google Scholar]
- 16.Sugiyama K, Akachi T, Yamakawa A. J Nutr. 1995;125:2134–2144. doi: 10.1093/jn/125.8.2134. [DOI] [PubMed] [Google Scholar]
- 17.Boger RH, Sydow K, Borlak J, Thum T, Lenzen H, Schubert B, Tsikas D, Bode-Boger SM. Circ Res. 2000;87:99–105. doi: 10.1161/01.res.87.2.99. [DOI] [PubMed] [Google Scholar]
- 18.Yamada T, Komoto J, Lou K, Ueki A, Hua DH, Sugiyama K, Takata Y, Ogawa H, Takusagawa F. Biochem Pharmacol. 2007;73:981–989. doi: 10.1016/j.bcp.2006.12.014. [DOI] [PubMed] [Google Scholar]
- 19.Cai S, Li QS, Fang J, Borchardt RT, Kuczera K, Middaugh CR, Schowen RL. Nucleosides Nucleotides Nucleic Acids. 2009;28:485–503. doi: 10.1080/15257770903051031. [DOI] [PMC free article] [PubMed] [Google Scholar]
- 20.Ctrnacta V, Fritzler JM, Surinova M, Hrdy I, Zhu G, Stejskal F. Exp Parasitol. 2010;126:113–116. doi: 10.1016/j.exppara.2010.04.007. [DOI] [PMC free article] [PubMed] [Google Scholar]
- 21.Crowther GJ, Napuli AJ, Gilligan JH, Gagaring K, Borboa R, Francek C, Chen Z, Dagostino EF, Stockmyer JB, Wang Y, Rodenbough PP, Castaneda LJ, Leibly DJ, Bhandari J, Gelb MH, Brinker A, Engels IH, Taylor J, Chatterjee AK, Fantauzzi P, Glynne RJ, Van Voorhis WC, Kuhen KL. Mol Biochem Parasitol. 2011;175:21–29. doi: 10.1016/j.molbiopara.2010.08.005. [DOI] [PMC free article] [PubMed] [Google Scholar]
- 22.Inaba M, Nagashima K, Tsukagoshi S, Sakurai Y. Cancer Res. 1986;46:1063–1067. [PubMed] [Google Scholar]
- 23.Hasobe M, McKee JG, Borcherding DR, Keller BT, Borchardt RT. Mol Pharmacol. 1988;33:713–720. [PubMed] [Google Scholar]
- 24.Shuto S, Obara T, Toriya M, Hosoya M, Snoeck R, Andrei G, Balzarini J, De Clercq E. J Med Chem. 1992;35:324–331. doi: 10.1021/jm00080a018. [DOI] [PubMed] [Google Scholar]
- 25.Wang T, Lee HJ, Tosh DK, Kim HO, Pal S, Choi S, Lee Y, Moon HR, Zhao LX, Lee KM, Jeong LS. Bioorg Med Chem Lett. 2007;17:4456–4459. doi: 10.1016/j.bmcl.2007.06.013. [DOI] [PubMed] [Google Scholar]
- 26.Kumamoto H, Deguchi K, Takahashi N, Tanaka H, Kitade Y. Nucleosides Nucleotides Nucleic Acids. 2007;26:733–736. doi: 10.1080/15257770701493617. [DOI] [PubMed] [Google Scholar]
- 27.Kim BG, Chun TG, Lee HY, Snapper ML. Bioorg Med Chem. 2009;17:6707–6714. doi: 10.1016/j.bmc.2009.07.061. [DOI] [PubMed] [Google Scholar]
- 28.Park YH, Choi WJ, Tipnis AS, Lee KM, Jeong LS. Nucleosides Nucleotides Nucleic Acids. 2009;28:601–613. doi: 10.1080/15257770903054316. [DOI] [PubMed] [Google Scholar]
- 29.Chiang PK, Richards HH, Cantoni GL. Mol Pharmacol. 1977;13:939–947. [PubMed] [Google Scholar]
- 30.Shimizu S, Shiozaki S, Ohshiro T, Yamada H. Eur J Biochem. 1984;141:385–392. doi: 10.1111/j.1432-1033.1984.tb08203.x. [DOI] [PubMed] [Google Scholar]
- 31.Lozada-Ramirez JD, Martinez-Martinez I, Sanchez-Ferrer A, Garcia-Carmona F. J Biochem Biophys Methods. 2006;67:131–140. doi: 10.1016/j.jbbm.2006.01.008. [DOI] [PubMed] [Google Scholar]
- 32.Lin JH, Chang CW, Wu ZH, Tseng WL. Anal Chem. 2010 doi: 10.1021/ac102020n. [DOI] [PubMed] [Google Scholar]
- 33.Cassera MB, Ho MC, Merino EF, Burgos ES, Rinaldo-Matthis A, Almo SC, Schramm VL. Biochemistry. 2011;50:1885–1893. doi: 10.1021/bi101921w. [DOI] [PMC free article] [PubMed] [Google Scholar]
- 34.Hemeon I, Gutierrez JA, Ho MC, Schramm VL. Anal Chem. 2011;83:4996–5004. doi: 10.1021/ac200816m. [DOI] [PMC free article] [PubMed] [Google Scholar]
- 35.Sturm MB, Schramm VL. Anal Chem. 2009;81:2847–2853. doi: 10.1021/ac8026433. [DOI] [PMC free article] [PubMed] [Google Scholar]
- 36.Yuan CS, Ault-Riche DB, Borchardt RT. J Biol Chem. 1996;271:28009–28016. doi: 10.1074/jbc.271.45.28009. [DOI] [PubMed] [Google Scholar]
- 37.Burgos ES, Schramm VL. Biochemistry. 2008;47:11086–11096. doi: 10.1021/bi801198m. [DOI] [PMC free article] [PubMed] [Google Scholar]
- 38.Kolb M, Danzin C, Barth J, Claverie N. J Med Chem. 1982;25:550–556. doi: 10.1021/jm00347a014. [DOI] [PubMed] [Google Scholar]
- 39.Wang HC, Ciskanik L, Dunaway-Mariano D, von der Saal W, Villafranca JJ. Biochemistry. 1988;27:625–633. doi: 10.1021/bi00402a020. [DOI] [PubMed] [Google Scholar]
- 40.Zhang JH, Chung TD, Oldenburg KR. J Biomol Screen. 1999;4:67–73. doi: 10.1177/108705719900400206. [DOI] [PubMed] [Google Scholar]
- 41.Merkler DJ, Brenowitz M, Schramm VL. Biochemistry. 1990;29:8358–8364. doi: 10.1021/bi00488a023. [DOI] [PubMed] [Google Scholar]
- 42.Wang M, Borchardt RT, Schowen RL, Kuczera K. Biochemistry. 2005;44:7228–7239. doi: 10.1021/bi047524m. [DOI] [PubMed] [Google Scholar]
- 43.Keller BT, Borchardt RT. In: Biological Methylation and Drug Design. Borchardt RT, Creveling PM, Ueland PM, editors. Humana Press; Clifton, NJ: 1986. pp. 385–396. [Google Scholar]
- 44.Jacobson KA, Gao ZG. Nat Rev Drug Discov. 2006;5:247–264. doi: 10.1038/nrd1983. [DOI] [PMC free article] [PubMed] [Google Scholar]
Associated Data
This section collects any data citations, data availability statements, or supplementary materials included in this article.


