

Abstract
Reaction directionality is a key constraint in the modeling of genome-scale metabolic networks. We thermodynamically constrained reaction directionality in a multicompartmental genome-scale model of human metabolism, Recon 1, by calculating, in vivo, standard transformed reaction Gibbs energy as a function of compartment-specific pH, electrical potential, and ionic strength. We show that compartmental pH is an important determinant of thermodynamically determined reaction directionality. The effects of pH on transport reaction thermodynamics are only seen to their full extent when metabolites are represented as pseudoisomer groups of multiple protonated species. We accurately predict the irreversibility of 387 reactions, with detailed propagation of uncertainty in input data, and manually curate the literature to resolve conflicting directionality assignments. In at least half of all cases, a prediction of a reversible reaction directionality is due to the paucity of compartment-specific quantitative metabolomic data, with remaining cases due to uncertainty in estimation of standard reaction Gibbs energy. This study points to the pressing need for 1), quantitative metabolomic data, and 2), experimental measurement of thermochemical properties for human metabolites.
Introduction
Genome-scale metabolic reconstructions have found widespread applications in systems biology and biotechnology, including contextualization of high-throughput data, guidance of metabolic engineering, directing hypothesis-driven discovery, interrogation of multispecies relationships, and network property discovery (1,2). Given a stoichiometrically accurate representation of experimental biochemical and molecular biological literature, one may use constraint-based reconstruction (3) and analysis (4) methods for in silico phenotype prediction. The predictive fidelity of a constraint-based model is dependent on the accuracy of the constraints used to eliminate physicochemically and biochemically infeasible network states. When modeling metabolic networks with flux balance analysis (5), in general, the most important constraints are derived from the steady-state mass balance assumption, bounds on rates of exchange of metabolites with the surrounding medium, and constraints on the direction of net flux for otherwise reversible reactions.
The constraint equations for a metabolic model define an underdetermined feasible set of reaction fluxes. In unicellular organisms, a biological objective (6), such as maximization of biomass yield per unit of glucose uptake, can be used to predict a single flux vector within this feasible set (5). With flux balance analysis of a metabolic network (5), it is critical to realize that the optimal value of the objective is often strongly modulated by reaction directionality (7). There are two forms of thermodynamic constraints on reaction directionality. Local thermodynamic constraints apply on a reaction-by-reaction basis, where a negative reaction Gibbs energy dictates a net forward reaction flux (8). Nonlocal thermodynamic constraints apply to sets of reactions and arise due to the necessity to satisfy energy conservation, in addition to the second law of thermodynamics (9–11).
Quantitative assignment of reaction directionality can be achieved empirically by integration of thermodynamic constants (12–14) with quantitative metabolomic data (15–20). Unfortunately, thermodynamic constants have not yet been measured for most metabolites, but semiempirical methods for estimating standard metabolite species Gibbs energy (13) or standard reaction Gibbs energy (14) are constantly improving. Ludwig von Bertalanffy (1901–1972) was a pioneer in systems theory who advocated that biochemical thermodynamics would be central to systems approaches to biology (21). We recently published an algorithmic pipeline, von Bertalanffy 1.0 (22), for quantitative assignment of reaction directionality in multicompartmental (multiphase) genome-scale metabolic models. This open-source extension to the Constraint-Based Reconstruction and Analysis (COBRA) toolbox (23) utilizes experimental (24) or computationally estimated (13) standard metabolite species Gibbs energy, transformed to in vivo pH, temperature, ionic strength, and electrical potential, to predict upper and lower bounds on standard transformed reaction Gibbs energy. In models where pH, electrical potential, and ionic strength vary between compartments, each standard metabolite species Gibbs energy must be transformed to a compartment-specific standard transformed Gibbs energy.
Here, we describe quantitative assignment of reaction directionality in Recon 1 (25), based on biochemical thermodynamics (12,20) and implemented with von Bertalanffy 1.1, where enumeration of metabolite structural groups is used to reduce uncertainty in thermodynamic estimates (13). Recon 1 is a genome-scale model of human metabolism with 2784 metabolites across eight cell compartments, with 2125 nontransport reactions and 1236 transport reactions. Reaction directionality in Recon 1 had been assigned based on biochemical data, if available, otherwise reaction direction was obtained from biochemical studies of identical reactions in other organisms or mechanistically similar reactions. In the absence of such information, Recon 1 reactions were assumed to be reversible. Previously, thermodynamic constraints on reaction directionality were imposed on a reconstruction of human liver metabolism, HepatoNet1 (26). That approach did not explicitly account for variation in pH and electrostatic potential between compartments and assumed that a single ionic species is representative of each metabolite, which does not always hold (20,27,28). Here we thermodynamically constrain Recon 1 by representing each metabolite with a pseudoisomer group of ionic species that are calculated to be significantly present in vivo. All metabolite species are assigned distinct thermodynamic properties for each compartment using literature-derived pH, electrostatic potential, and quantitative metabolomic data, where available. Alberty (12,24,29) and more recently Jol et al. (28) have derived relations that indicate how pH and electrostatic potential should be treated in multicompartmental models. Here we provide a complementary derivation, arriving at the same result. However, we believe our method sheds new light on the criterion for directionality of intercompartmental transport reactions, when pH and electrostatic potential are taken into account. We compare quantitative assignment of reaction directionality to qualitatively assigned Recon 1 directionality and resolve discrepancies by detailed comparison with experimental literature. Furthermore, we estimate bounds on in vivo concentration for a subset of metabolites, which upon further research, agree well with experimental literature.
Methods
Standard transformed metabolite Gibbs energy of formation
In deriving the thermodynamic potential of each metabolite, one must make careful consideration of in vivo conditions (12). We previously summarized the relevant theory (20) and further theoretical explanation may be found in Cell Compartment pH in the Supporting Material. In short, many metabolites contain weakly acidic and/or basic functional groups that have a tendency to lose or gain protons in aqueous solution. At timescales typical for biochemical reactions, one may represent each metabolite as an equilibrated mixture of differently charged ions, termed “metabolite species”. This assumption is often indicated by referring to each metabolite as representing a pseudoisomer group of metabolite species at equilibrium (12). For a given metabolite, the relative abundance of each species in the pseudoisomer group depends on the pKa for deprotonation of that species and the pH (see Fig. S1 in the Supporting Material). The thermodynamic potential of a metabolite at in vivo conditions is a function of metabolite concentration and standard transformed metabolite Gibbs energy of formation, , given by
| (1) |
where the summation is over standard transformed Gibbs energy of each metabolite species j, within the pseudoisomer group i. At specified in vivo temperature T, ionic strength I, and pH, the standard transformed Gibbs energy of a metabolite species with Nj(H) hydrogen atoms and electrical charge Qj is given by
| (2) |
where ΔfG0j and ΔfH0j are the species standard Gibbs energy and standard enthalpy of formation, respectively. Standard conditions are defined as T = 298.15 K and I = 0 M. The quantity R in Eq. 2 is the universal gas constant. The term α is a function of temperature and pressure; at 310.15 K and atmospheric pressure, it is approximated as . We take B to be constant at (12). The transformation in Eq. 2 includes a van 't Hoff approximate temperature adjustment and a Legendre transformation for fixed hydrogen ion chemical potential as well as an extended Debye-Hückel theory adjustment to incorporate ionic strength. Incorporation of ionic strength into ΔfG′0j allows subsequent metabolomic data integration to be in terms of metabolite concentration rather than metabolite activity. This is useful as it is generally metabolite concentration that is reported in experimental studies.
Thermodynamic data
To calculate , first we used tables of ΔfG0j that were backcalculated from experimentally determined equilibrium constants and pKa by Alberty (24). Second, we complemented this approach by estimating ΔfG0j using a biochemically tailored group contribution method developed in a series of articles by Henry et al. (15), Jankowski et al. (13), and Finley et al. (30). Hereafter, we distinguish experimentally derived and estimated thermodynamic quantities with the subscripts obs and est, respectively.
The software implementing the group contribution method requires, as input, a concatenation of MDL mol files. We obtained IUPAC International Chemical Identifiers (InChIs) from the databases HMDB (31), KEGG (32), and ChEBI (33), then converted them to “mol” files with OpenBabel (version 2.3.0) (34). The majority of InChIs were retrieved from the three databases automatically by cross-referencing metabolite data in Recon 1 with the data in each database (see Fig. S2). Accurate matching of Recon 1 metabolites with database entries was verified manually. If no InChI was automatically retrieved we attempted to retrieve it manually from the aforementioned databases. Where possible, InChIs were created manually with MarvinSketch (v5.3.7; ChemAxon, Budapest, Hungary) for metabolites where no InChI was available in any of the three databases.
Pseudoisomer groups
Alberty (12) gives ΔfG0j,obs for all metabolite species of interest in the pH range 5–9, whereas the group contribution method that we used returns ΔfG0j,est for the single most abundant metabolite species at pH 7 (13). Approximating ΔfG′0i,est away from pH 7, with ΔfG′0j,est for the most abundant species at pH 7, can lead to erroneous results for reactions involving metabolites with significant mole fractions present as nonpredominant species (20,28). To better account for the effects of pH on ΔfG′0i,est, we calculated ΔfG0j,est for each metabolite species that is thermodynamically stable in the pH range 5–9. To calculate ΔfG0j+1,est for a conjugate acid of the most abundant species at pH 7 we used the group contribution estimate (ΔfG0j,est) and the equation from Alberty (12),
| (3) |
where pKj,est is the acid dissociation constant for the weak acid at 0 M ionic strength. Acid dissociation constants were estimated with a pKa calculator plugin (v5.3.7) from ChemAxon.
Body temperature adjustment
Metabolite species ΔfH0j are required to accurately adjust ΔfG′0i for temperature. The ΔfH0j,obs values are only available for a subset of metabolites with ΔfG0j,obs in Alberty's tables, and to the authors' knowledge, there is no method for group contribution estimates of biochemical species standard enthalpies. Alberty provides both ΔfG0j,obs and ΔfH0j,obs for 235 Recon 1 metabolites. Only 150 Recon 1 reactions involved just these 235 metabolites. Due to this dearth of standard enthalpy data, we assumed ΔfH0j = ΔfG0j for all metabolite species. We account for this assumption by adding uncertainty to calculated ΔfG′0j (see Uncertainty in Standard Transformed Metabolite Gibbs Energy of Formation in the Supporting Material). Assuming ΔfH0j = ΔfG0j is equivalent to rewriting Eq. 2 without a temperature adjustment to ΔfH0j. However, in Eq. 2, α is a function of temperature so ΔfG′0j is not invariant with respect to temperature change.
Data on compartment-specific conditions
For the eight compartments in Recon 1, pH and ϕ were obtained from the literature (Table 1) and used to calculate compartment-specific ΔfG′0j according to Eq. 2. Short reviews of the relevant literature for each compartment are given in the sections Cell Compartment pH and Cell Compartment Electrical Potential in the Supporting Material. Temperature was set to 310.15 K for all compartments. To our knowledge, in vivo ionic strength has not been measured at compartmental resolution but it is generally assumed to lie between 0.05 M and 0.25 M (12). Uncertainty in ionic strength was factored into uncertainty in calculated in vivo standard transformed Gibbs energies of formation (see Uncertainty in Standard Transformed Metabolite Gibbs Energy of Formation in the Supporting Material).
Table 1.
pH and electrical potential relative to cytosol (Δϕ) in each of the eight cellular compartments included in Recon 1
| Compartment | pH | Δϕ (mV) |
|---|---|---|
| Cytosol and nucleus | 7.20 | 0 |
| Extracellular fluid | 7.40 | 30 |
| Golgi apparatus | 6.35 | 0 |
| Lysosomes | 5.50 | 19 |
| Mitochondria | 8.00 | −155 |
| Endoplasmic reticulum | 7.20 | 0 |
| Peroxisomes∗ | 7.00 ± 1.2 | 12 ± 74 |
See Table S1 for the corresponding literature references.
Variability in peroxisomal pH and Δϕ was accounted for by adding uncertainty to standard transformed Gibbs energy estimates for peroxisomal metabolites and reactions (see sections Uncertainty in Standard Transformed Metabolite Gibbs Energy of Formation and Uncertainty in Standard Transformed Reaction Gibbs Energy in the Supporting Material).
Standard transformed reaction Gibbs energy
Standard transformed reaction Gibbs energy ΔrG′0 for reactions in Recon 1 was calculated using von Bertalanffy 1.1 (22), the latest version of which is freely available as part of the openCOBRA project (23). The inputs to von Bertalanffy 1.1 include a stoichiometric matrix of mass balanced chemical reactions, elemental formulae, ΔfG0j from heterogeneous sources as well as compartment specific pH, ionic strength, and electrical potential. This data are integrated to provide ΔrG′0k for the kth biochemical reaction
| (4) |
where Sk ∈ ℤm,1 denotes the corresponding column from the stoichiometric matrix and ΔfG′0 ∈ ℝm,1 contains ΔfG′0i for all metabolites. Where a reaction involves metabolites with thermodynamic estimates from different standard states, we adjusted them all to have the same baseline as described in our previous article on Escherichia coli (20).
As described in detail in Uncertainty in Standard Transformed Gibbs Energy in the Supporting Material, the uncertainty in standard transformed reaction Gibbs energy, denoted ur,k, was calculated as the Euclidean norm of three independent sources of uncertainty: 1), uncertainty associated with the standard Gibbs energy of metabolite structural groups that are either created or destroyed during a chemical reaction; 2), uncertainty associated with the limited availability of experimental data on standard enthalpy of formation; and 3), uncertainty associated with the dearth of experimental literature on ionic strength. An additional source of uncertainty for peroxisomal reactions was variability in peroxisomal pH and membrane potential (see Table 1). The 95% confidence interval that we use to define minimum and maximum standard transformed reaction Gibbs energy are ΔrG′0k,min ≡ ΔrG′0k − ur,k and ΔrG′0k,max ≡ ΔrG′0k + ur,k, respectively.
As discussed in the previous subsection, due to limited availability of experimental data on standard enthalpy, we assumed that ΔfH0j = ΔfG0j for all metabolite species to calculate Gibbs energies at body temperature. Metabolite species standard Gibbs energy of formation can be defined as ΔfG0j = ΔfH0j − TΔfS0j, where ΔfS0j is standard entropy of formation (12). This definition of ΔfG0j shows that the error resulting from the assumption that ΔfH0j = ΔfG0j depends on the magnitude of the contribution of entropy to ΔfG0j. Errors in standard transformed reaction Gibbs energies, calculated based on this assumption, likewise depend on the magnitude of the entropic contribution. The contribution of entropy to standard transformed reaction Gibbs energy was <1 kJ/mol in magnitude for 145 of the 150 Recon 1 reactions that only involved metabolites with known ΔfH0j (see Fig. S3). Maximum entropic contribution to ΔrG′0k was 3.65 kJ/mol for hydrolysis of D-fructose-1,6-bisphosphate by fructose-bisphosphatase (E.C. 3.1.3.11).
Transport reaction thermodynamics
Equation 4 is only valid for reactions taking place within a single compartment. When a reaction involves transport of metabolite species between different compartments with different hydrogen ion activity or electrical potential, the standard transformed reaction Gibbs energy is
| (5) |
where N(H) is the net number of hydrogen ions transported from initial to final compartment, ΔΔfG(H) is the difference between initial and final compartment hydrogen ion Gibbs energy of formation, F is Faraday's constant, Q is the net number of charges transported from initial to final compartment, and Δϕ is the difference between the electrical potential of the initial and final compartments. A swift derivation of Eq. 5 is provided in Thermodynamic Treatment of Hydrogen Ions and Charge in Multicompartmental Metabolic Reactions in the Supporting Material. It is important to note that the stoichiometry of each transport reaction must accurately reflect the mechanism of intercompartmental transport, down to the details of the charged species transported.
Metabolite concentrations
Compartment-specific concentration ranges for the most highly connected Recon 1 metabolites, typically cofactors, were obtained from the Human Metabolome Database (HMDB) (31) and directly from literature (see Table S2 in the Supporting Material). Noncompartment-specific concentrations were listed in HMDB for other compartment-specific metabolites. From HMDB we obtained both plasma and cytosolic concentrations for certain metabolites (Fig. 1). However, due to the significant fraction of these metabolites with differences in plasma versus cytosolic concentration, of over an order of magnitude or more in some cases, we did not use noncompartment-specific concentrations. Where compartment-specific concentrations could not be obtained, we constrained concentrations between xmin = 10−7 M and xmax = 10−2 M. These bounds were based on lower and upper limits on all experimentally determined cytosolic metabolite concentrations listed in the HMDB. There are exceptions for water and dissolved gases (see Concentrations of Water and Dissolved Gases in the Supporting Material).
Figure 1.

Both cytosolic and plasma concentrations, x, were listed in HMDB for 33 metabolites. For many metabolites the correlation between cytosol and plasma was good (open circles), but for some metabolites the concentration can differ between cytosol and plasma by more than an order of magnitude (solid circles). We conservatively conclude that plasma concentration data cannot generally be assumed to represent cytosolic concentration.
Quantitative assignment of reaction directionality
The minimum and maximum transformed reaction Gibbs energy are given by
where inf denotes the infimum and sup denotes the supremum with respect to the bounds on metabolite concentrations described above. By the second law of thermodynamics, we say that a reaction may be assigned to be quantitatively forward, if ΔrG′k,max < 0, or quantitatively reverse if ΔrG′k,min > 0. A reaction is quantitatively reversible if the physiological range of biochemical reaction transformed Gibbs energy spans the zero line, i.e., ΔrG′k,min < 0 < ΔrG′k,max. Computed reaction Gibbs energies, uncertainty, and quantitative directionalities are provided in the Supporting Material.
Concentration variability
Given concentration bounds and thermodynamic data, the previous subsection describes a method for quantitatively assigning reaction directionality. Quantitative assignments can be used to compute more constrained bounds on metabolite concentrations (16,19,35). Such calculation of (logarithmic) concentration zi ≡ ln(xi) variability is an established facet of network-embedded thermodynamic analysis (16,36). The calculation of (logarithmic) concentration variability is a set of 2 × m linear optimization problems
| (6) |
| (7) |
| (8) |
| (9) |
| (10) |
where, for each ith metabolite, the objective is minimized and maximized with di = 1 and zero otherwise. Equation 7 is default bounds on logarithmic concentration (see Metabolite Concentrations, above). Equation 8 relates logarithmic concentration to change in transformed reaction Gibbs energy. Equation 9 represents the bounds on standard transformed reaction Gibbs energy, as described above. In Eq. 10, vk > 0 denotes a net forward flux direction through an essential metabolic pathway ((25), and I. Thiele, N. Swainston, R. M. T. Fleming, A. Hoppe, S. Gudmunsson, H. S. Haraldsdóttir, M. L. Mo, O. Rolfsson, M. Stobbe, S. G. Thorleifsson, R. Agren, M. K. Aurich, C. Bölling, S. Bordel, A. Chavali, P. Dobson, W. B. Dunn, L. Endler, I. Goryanin, D. Hala, M. Hucka, D. Hull, D. Jameson, N. Jamshidi, J. Jones, J. J. Jonsson, N. Juty, S. Keating, H. Ma, I. Nookaew, N. L. Novère, N. Malys, A. Mazein, J. Papin, Y. Patel, N. D. Price, S. E. Selkov, M. I. Sigurdsson, E. Simeonidis, N. Sonnenschein, K. Smallbone, A. Sorokin, H. V. Beek, D. Weichart, H. V. Westerhoff, D. B. Kell, P. Mendes, and B. Ø. Palsson, unpublished) and the corresponding inequality ΔrG′k < 0 is implied by the second law of thermodynamics.
Results and Discussion
Standard transformed Gibbs energy of formation
By integrating experimentally observed and computationally estimated thermodynamic data with human compartment-specific physiological variables (Eq. 1 and 2), we calculated standard transformed Gibbs energy of formation ΔfG′0i for two-thirds (1891/2784) of all metabolites in Recon 1. Just over one-fifth (413/1891) of these metabolites, ΔfG′0i, were calculated using ΔfG0j,obs from Alberty's textbooks (12,24). For the remaining metabolites (1478/1891) ΔfG0j,est values were estimated using a group contribution method (13,15,30). The majority (784/893) of metabolites for which no ΔfG0j,est could be obtained were macromolecules of variable structure whose InChI strings could not be unambiguously generated. Examples included heparan sulfates, which are of variable length and composition. The remaining metabolites (109/893) contained structural groups, such as nitro (-NO2) or sulfinyl (>S=O) groups, which were not covered by the group contribution method.
The pH affects ΔfG′0i for weakly acidic or basic metabolites by altering the equilibrium distribution of metabolite species within their respective pseudoisomer groups (see Fig. S1). To accurately account for this effect, ΔfG0j for each metabolite species must be known. The group contribution method returns ΔfG0j,est for the single most predominant species at pH 7 for each metabolite (13). Using this single output as a starting point, we computed ΔfG0j,est for all other metabolite species present at a significant mole fraction (≥0.05), at some point in the pH range 5–9. We found that nearly one-fifth (341/1891) of metabolites had more than one species present at a significant mole fraction at compartmental pH. Combined, these metabolites participate in close to half (1484/3361) of all reactions. Standard error in ΔfG′0i,est for 402 metabolites where both ΔfG′0i,obs and ΔfG′0i,est were available was 10.60 kJ/mol when they were represented as pseudoisomer groups of multiple ionic species, and 14.17 kJ/mol when they were represented by the predominant species at pH 7 only.
An illustrative example of a highly connected metabolite that consists of an equilibrium mixture of multiple ionic species at physiological pH is the phosphate ion. The predominant phosphate species at 298 K, 0 M ionic strength, and pH 7 is . The group contribution method returned an estimate of ΔfG0j for this species. The species equilibrium shifts with temperature, ionic strength, and pH so that, in a human lysosome, is the predominant phosphate species (see Fig. S1). By computing ΔfG0j for , we captured the effects that this shift in species equilibrium has on ΔfG′0i (see Table S3 and Fig. S4).
Standard transformed reaction Gibbs energy
Sufficient data were available to calculate standard transformed reaction Gibbs energy (ΔrG′0k) and transformed reaction Gibbs energy (ΔrG′k) for nearly two-thirds (2129/3361) of reactions in Recon 1 (see Fig. S5). When available, experimental data ΔfG0j,obs were used in preference to group contribution estimates ΔfG0j,est, but a minority of reactions was calculated using experimental data alone and most ΔrG′0k were calculated using at least one ΔfG0j,est (see Fig. S6). A large majority (1955/2129) of reactions had ΔrG′0k between −100 and 50 kJ/mol, but a significant number (100/2129) had a large negative ΔrG′0k of ∼−400 kJ/mol (see Fig. S7). These reactions all involved oxidation by O2 or reduction by H2O2, NADH, or NADPH.
Varying the pH affects ΔrG′0k for both nontransport and transport reactions to a similar extent (see Fig. S8). The difference in ΔrG′0k between pH 5 and pH 9 was up to 95.87 kJ/mol for nontransport reactions, and up to 95.00 kJ/mol for transport reactions. The fact that ΔrG′0k for a single reaction can vary to this degree within the range of physiological pH has implications for compartmentalization of reactions in metabolic reconstructions. A reaction mechanism that has been well characterized in one compartment (or between a pair of compartments) cannot be assumed to represent the mechanism for another compartment without careful consideration of differences in compartmental conditions. Nontransport reactions that were affected the most by changes in pH were mainly hydrolysis reactions, where the difference in number of bound hydrogen atoms between reactants and products was greatest. The extent to which pH affected transport reactions was in proportion to the number of translocated protons, so that proton antiport or symport reactions were affected the most.
To capture the full extent of the effects of pH on ΔrG′0k, acidic and basic metabolites must be represented as pseudoisomer groups of multiple ionic species. This is particularly important for transport reactions (see Fig. S8). Compartmental differences in pH affect ΔrG′0k for transport reactions by two mechanisms: 1), by altering the distribution of species within the pseudoisomer groups of transported metabolites (Eqs. 2 and 3), and 2), by altering the chemical potential of transported hydrogen ions (Eq. 5). Only the second effect is captured when metabolites are represented by the single most predominant species at pH 7 (see Fig. S9). Standard error in ΔrG′0k,est for 212 transport reactions involving only metabolites for which both ΔfG′0i,obs and ΔfG′0i,est were known was 1.41 kJ/mol when metabolites were represented as pseudoisomer groups in calculations of ΔfG′0i,est, but 7.23 kJ/mol when they were represented by single species. Standard error in ΔrG′0k,est for 155 nontransport reactions was 10.85 kJ/mol when metabolites were represented as pseudoisomer groups, and 11.02 kJ/mol when they were represented by single species. The distribution of species within the pseudoisomer groups of metabolites therefore appears to be more of a factor in determining ΔrG′0k for transport reactions.
Quantitative assignment of reaction directionality
We say that reaction directions in Recon 1 are qualitative assignments, as they are typically based on qualitative biochemical data from enzyme characterization studies. Some Recon 1 reaction directions were qualitatively assigned based on indirect evidence, e.g., identical reactions in other organisms or mechanistically similar reactions (3). We say that a reaction is quantitatively forward, if ΔrG′k,max < 0, and quantitatively reverse if ΔrG′k,min > 0. A reaction is quantitatively reversible if the physiological range of biochemical reaction transformed Gibbs energy spans the zero line, i.e., ΔrG′k,min < 0 and 0 < ΔrG′k,max.
Table 2 compares qualitative and quantitative assignment of reaction directionality for 2129 reactions in Recon 1. Results for each reaction are given in the Supporting Material. A total of 332 nontransport reactions and 28 transport reactions were both qualitatively and quantitatively forward. This set of reactions mainly consisted of redox reactions involving O2, H2O2, NAD, or NADP phosphate group transfer reactions and hydrolysis reactions.
Table 2.
Comparison of qualitative and quantitative directionality assignments
| Qualitative directionality | Quantitative directionality |
|||
|---|---|---|---|---|
| Forward | Reversible | Reverse | ||
| Nontransport Reactions | Forward | 332∗ | 638 | 2 |
| Reversible | 19 | 328 | 3 | |
| Transport Reactions | Forward | 28∗ | 243 | 1 |
| Reversible | 4 | 528 | 3 | |
Qualitative directionality assignments were made manually when Recon 1 was reconstructed, while quantitative assignments were made based on minimum and maximum transformed Gibbs energy (ΔrG′k) achievable within the specified bounds on metabolite concentrations.
Qualitative and quantitative directionality agreed for 360 reactions.
The majority (881/1244) of qualitatively forward reactions were quantitatively reversible. There are two reasons for this: 1), lack of metabolite concentration data and 2), uncertainty in standard transformed reaction Gibbs energy. Fig. 2 demonstrates that at least a thousand reactions could potentially be assigned thermodynamically forward (or reverse) if sufficient metabolite concentration data became available in the future. Remaining reactions could only be assigned thermodynamically forward (or reverse) if more precise standard Gibbs energies also become available in future. This is especially important for reactions involving metabolites where many structural groups are not invariant with respect to the reaction. Moreover, from the perspective of an analytical chemist or experimental thermochemist, Fig. 2 points to those metabolites that would benefit most from quantitative intracellular compartmentally resolved metabolomic experiments, and those reactions that would benefit most from a measurement of their equilibrium constant.
Figure 2.
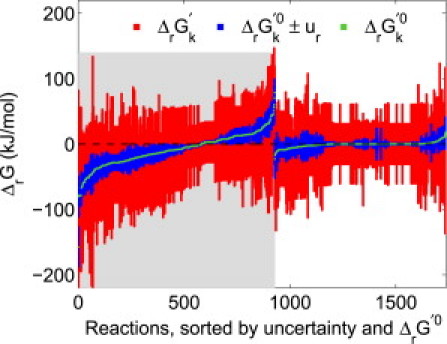
Standard transformed reaction Gibbs energy (ΔrG k′0, green) with uncertainty (ur, blue), as well as feasible ranges of transformed reaction Gibbs energy (ΔrGk′, red), for all quantitatively reversible reactions in Recon 1. Approximately half of the reactions were reversible due to the broad, generic metabolite concentration range (10−7–10−2 M) used in our analysis (shaded region). A more precise prediction of the directionality of these reactions could be made upon increased availability of compartmentally resolved quantitative metabolomic data. The other half of quantitatively reversible reactions were reversible because the range ΔrG k′0 ± ur included 0 kJ/mol (unshaded region). Availability of more precise thermodynamic data would further aid prediction of the directionality of these reactions.
A small number (29/2129) of reactions were qualitatively reversible but quantitatively irreversible in either the forward (23/30) or the reverse (6/30) direction. Flux variability analysis (38) on Recon 1 revealed that 11 of the quantitatively forward reactions and one of the quantitatively reverse reactions could only ever proceed in the direction that was consistent with their quantitative directionality. An example is the mitochondrial glutathione peroxidase (E.C. 1.11.1.9) reaction
which was qualitatively reversible but quantitatively forward. Flux variability analysis revealed that, if the cell represented by Recon 1 is constrained to produce nonzero biomass, this reaction can never carry negative flux. Its effective qualitative directionality therefore agrees with its quantitative directionality.
Only 19 reactions had inconsistent qualitative and quantitative directionality, i.e., were qualitatively reversible but quantitatively irreversible, or qualitatively forward but quantitatively reverse. From a literature review, we found that five of these reactions had incorrect quantitative directionality assignments, nine had incorrect qualitative assignments, and five had potentially incorrect stoichiometries in Recon 1 (see Reactions with Inconsistent Qualitative and Quantitative Directionality Assignments in the Supporting Material). All five reactions with incorrect quantitative directionality assignments involved complex structural transformations such as ring openings. The group contribution method we used does not appear to be well suited for estimation of ΔrG′0k for such reactions. Based on our results for the five reactions with incorrect quantitative directionality, our confidence in estimated 0 for other similarly complex structural transformations is low.
Concentration variability
We sought to test the accuracy of our calculations of standard reaction Gibbs energy by predicting compartment-specific concentration ranges that are also consistent with net flux through reactions in directions known to be essential for normal function of human metabolism. Recon 1 was validated by flux-balance-based simulation of 288 known metabolic functions found in a variety of cell and tissue types (25). We determined essential flux directions by repeating these 288 simulations, with only those reactions set to irreversible that were both qualitatively and quantitatively irreversible in the same direction. Flux directions that were consistent across all 288 simulations were taken to be essential. A total of 455 reactions had consistent flux directions in all simulations. Given standard reaction Gibbs energies and default bounds on metabolite concentrations, the directionality constraints on these 455 reactions (Eq. 10) act to further narrow the range of metabolite concentration. This narrowed range can be found by linear optimization as described in Concentration Variability, above.
Compared with default concentration ranges, 11 metabolites had their range narrowed by an order of magnitude or more (Fig. 3). In the output from the linear optimization solver, the nonzero dual variables indicate the constraint(s) that bound metabolite concentration. We used this to identify the reaction directionality constraints (Eq. 10) that actively narrow a bound on a metabolite's concentration range (see the Supporting Material). A narrower concentration range was always the result of a directionality constraint on a single reaction. In some cases, a directionality constraint on a single reaction could impose bounds on multiple metabolite concentrations. An example of this was the mitochondrial folypolyglutamate synthase (E.C. 6.3.2.17) reaction
which was constrained to be irreversible in the forward direction. The directionality constraint on this reaction, combined with bounds on mitochondrial concentrations of ATP and ADP (see Table S2), imposed narrowed bounds on mitochondrial concentrations of 7,8-dihydrofolate, L-glutamate, pentaglutamyl folate and inorganic phosphate (Fig. 3). Measurements of mitochondrial concentrations of L-glutamate have ranged from 2 × 10⁻⁴ M (39) to 1.7 × 10⁻² M (40) that agrees well with our prediction. Mitochondrial concentrations of 7,8-dihydrofolate, pentaglutamyl folate and inorganic phosphate have not to our knowledge been measured.
Figure 3.
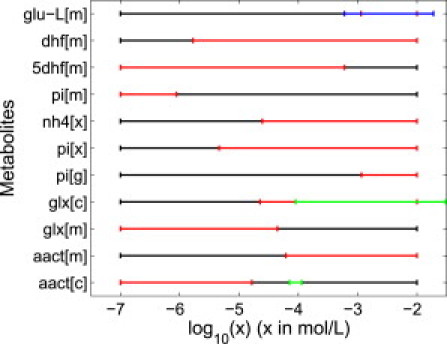
Default (black) and predicted variability (red) in logarithmic concentration ranges, where the predicted concentration range was narrower by an order of magnitude or more. As described in the Concentration Variability section, we predicted concentration variability by combining the thermodynamic data computed in this study with knowledge of reaction directions required for metabolically essential functions. We observed that predicted concentration agrees well with available literature on experimentally observed concentration ranges (blue) or Michaelis constants (green) of compartment-specific enzymes consuming the corresponding metabolite. Metabolite names corresponding to the abbreviations in the figure are given in the Supporting Material.
Concentration ranges of seven additional metabolites were narrowed by an order of magnitude of more (Fig. 3). The narrower concentration bounds were in all seven cases due to constraints on the directionality of passive diffusion reactions that transported the metabolites between two cell compartments. The concentration of ammonia in peroxisomes was further constrained by bounds on cytosolic ammonia concentration, and the concentrations of phosphate in peroxisomes and the Golgi apparatus were constrained by bounds on cytosolic phosphate concentration (see Table S2). As literature reports of compartment specific concentrations were not found for any of the seven metabolites, we searched instead for Michaelis constants of compartment specific enzymes that consume each of them (41–43). In a quantitative metabolomic study of E. coli, it was observed that most metabolite concentrations are between two orders of magnitude above the Michaelis constant KM and one order of magnitude below it (44). Our literature search returned Michaelis constants of one cytosolic enzyme for aminoacetone (41) and two for glyoxylate (45). Predicted concentrations were always within one order of magnitude below measured Michaelis constants (Fig. 3).
The aim of this analysis was to predict generic bounds on metabolite concentrations. We therefore constrained only a small subset of Recon 1 reaction directions that were essential for multiple metabolic functions. Even with such loose constraints we were able to predict compartment specific concentration ranges for 11 metabolites. Simulation of a single metabolic objective could be used to constrain a larger set of reaction directions. With tighter constraints we expect that condition specific concentration ranges could be predicted for an increased number of metabolites.
Conclusions
We have calculated in vivo standard transformed Gibbs energy estimates for 1891 metabolites, 807 transport reactions, and 1322 nontransport reactions in Recon 1, a multicompartmental reconstruction of human metabolism (25). This was accomplished through use of von Bertalanffy 1.1 (22), an open source software package for thermodynamic calculations and reaction directionality assignment in multicompartmental genome-scale models. The resulting thermodynamically constrained model can be used in various thermodynamics-based analysis of genome-scale metabolic networks, most of which depend on availability of standard transformed Gibbs energies at in vivo conditions. Examples include methods to constrain reaction directionality (17,19,20), determine potential regulatory sites (16,19), and evaluate thermodynamic feasibility of individual reactions (15), flux distributions (18,19), metabolic pathways (30), and metabolomic data (16,36).
Recon 1 consists of eight cellular compartments that can have different values of pH, electrical potential, and ionic strength. This feature poses certain challenges for calculations of standard transformed Gibbs energies for metabolites and reactions. To accurately account for the effects of the environmental variables on Gibbs energy, weakly acidic or basic metabolites must be represented as pseudoisomer groups of multiple ionic species. Differences in compartmental conditions must be taken into account in calculations of standard transformed Gibbs energies for transport reactions. We accounted for all metabolite species present at physiological pH and adjusted all Gibbs energies to cell compartment-specific conditions. A thorough treatment of transport reaction thermodynamics enabled us to estimate standard transformed reaction Gibbs energies for transport reactions with high confidence. We showed that compartmental pH is an important determinant of thermodynamic feasibility of reactions, and should be viewed as such in compartmentalization of reactions.
We demonstrated the utility of estimated standard transformed Gibbs energies by quantitatively assigning reaction directionality. A large majority of the 392 thermodynamically irreversible reactions were also irreversible in Recon 1, providing thermodynamic confirmation of the directionality of these reactions. Using the combination of estimated standard transformed reaction Gibbs energies and quantitative directionality assignments, we were able to predict compartment-specific concentration ranges for 11 Recon 1 metabolites. Our predictions were in good agreement with available literature. Manual identification of irreversible reactions in novel metabolic reconstructions is a time-consuming and labor-intensive process. Automating this process for multicompartmental models is of significant value to the systems biology community. Kümmel et al. (17) developed an algorithm to automatically identify and eliminate thermodynamically infeasible reaction directionalities from metabolic reconstructions. They identified 130 irreversible reactions in a genome-scale reconstruction of E. coli metabolism. The number of irreversible reactions identified with von Bertalanffy 1.1 compares favorably with these results.
The calculation of standard transformed Gibbs energies for biochemical reactions is of immediate use in the assignment of reaction directionality. Ultimately, our results will be applied to thermodynamically constrain the feasible set of kinetic parameters (46,47) for a mass conserved elementary kinetic model of human metabolism (R. M. T. Fleming and I. Thiele, unpublished). Establishing quantitatively correct thermodynamic constraints on elementary kinetic parameters, in the form of Haldane relations for composite reactions (49), would solve a large part of the kinetic parameter estimation problem.
Thermodynamically constraining composite metabolic reactions is based on established thermodynamic theory (12). The accuracy of estimated thermodynamic variables is limited by the quality of input data. We have attempted to compile all thermodynamically relevant data for humans in our calculations, and found it lacking in some aspects. Due mainly to the dearth of quantitative metabolomic data, and to a lesser extent uncertainty in standard Gibbs energies of formation, the majority of biochemical reactions in Recon 1 were estimated to be quantitatively reversible. Greater precision in quantitative directionality assignments depend primarily on the availability of compartmentally resolved metabolomic data and secondarily on improvement in semiempirical (13,14) or ab initio (50–52) computational methods for estimating thermodynamic parameters.
Acknowledgments
We thank Elad Noor for his feedback on our results. We also thank the anonymous reviewers for helpful comments that significantly improved the manuscript.
This work was supported by the Icelandic Research Fund grant No. 100406022, and by European Research Council grant No. 232816-SYSTEM_Us.
Supporting Material
References
- 1.Feist A.M., Palsson B.Ø. The growing scope of applications of genome-scale metabolic reconstructions using Escherichia coli. Nat. Biotechnol. 2008;26:659–667. doi: 10.1038/nbt1401. [DOI] [PMC free article] [PubMed] [Google Scholar]
- 2.Oberhardt M.A., Palsson B.Ø., Papin J.A. Applications of genome-scale metabolic reconstructions. Mol. Syst. Biol. 2009;5:320. doi: 10.1038/msb.2009.77. [DOI] [PMC free article] [PubMed] [Google Scholar]
- 3.Thiele I., Palsson B.Ø. A protocol for generating a high-quality genome-scale metabolic reconstruction. Nat. Protoc. 2010;5:93–121. doi: 10.1038/nprot.2009.203. [DOI] [PMC free article] [PubMed] [Google Scholar]
- 4.Palsson B.Ø. Cambridge University Press; Cambridge, UK: 2006. Systems Biology: Properties of Reconstructed Networks. [Google Scholar]
- 5.Savinell J.M., Palsson B.Ø. Network analysis of intermediary metabolism using linear optimization. I. Development of mathematical formalism. J. Theor. Biol. 1992;154:421–454. doi: 10.1016/s0022-5193(05)80161-4. [DOI] [PubMed] [Google Scholar]
- 6.Schuetz R., Kuepfer L., Sauer U. Systematic evaluation of objective functions for predicting intracellular fluxes in Escherichia coli. Mol. Syst. Biol. 2007;3:119. doi: 10.1038/msb4100162. [DOI] [PMC free article] [PubMed] [Google Scholar]
- 7.Varma A., Boesch B.W., Palsson B.Ø. Stoichiometric interpretation of Escherichia coli glucose catabolism under various oxygenation rates. Appl. Environ. Microbiol. 1993;59:2465–2473. doi: 10.1128/aem.59.8.2465-2473.1993. [DOI] [PMC free article] [PubMed] [Google Scholar]
- 8.Burton K., Krebs H., Kornberg H. Springer-Verlag; Berlin, Germany: 1957. Energy Transformations in Living Matter. [PubMed] [Google Scholar]
- 9.Beard D.A., Liang S.D., Qian H. Energy balance for analysis of complex metabolic networks. Biophys. J. 2002;83:79–86. doi: 10.1016/S0006-3495(02)75150-3. [DOI] [PMC free article] [PubMed] [Google Scholar]
- 10.Price N.D., Thiele I., Palsson B.Ø. Candidate states of Helicobacter pylori's genome-scale metabolic network upon application of “loop law” thermodynamic constraints. Biophys. J. 2006;90:3919–3928. doi: 10.1529/biophysj.105.072645. [DOI] [PMC free article] [PubMed] [Google Scholar]
- 11.Fleming R.M.T., Maes C.M., Palsson B.Ø. A variational principle for computing nonequilibrium fluxes and potentials in genome-scale biochemical networks. J. Theor. Biol. 2012;292:71–77. doi: 10.1016/j.jtbi.2011.09.029. [DOI] [PubMed] [Google Scholar]
- 12.Alberty R.A. Wiley-Interscience; Hoboken, NJ: 2003. Thermodynamics of Biochemical Reactions. [Google Scholar]
- 13.Jankowski M.D., Henry C.S., Hatzimanikatis V. Group contribution method for thermodynamic analysis of complex metabolic networks. Biophys. J. 2008;95:1487–1499. doi: 10.1529/biophysj.107.124784. [DOI] [PMC free article] [PubMed] [Google Scholar]
- 14.Rother K., Hoffmann S., Holzhütter H.G. IGERS: inferring Gibbs energy changes of biochemical reactions from reaction similarities. Biophys. J. 2010;98:2478–2486. doi: 10.1016/j.bpj.2010.02.052. [DOI] [PMC free article] [PubMed] [Google Scholar]
- 15.Henry C.S., Jankowski M.D., Hatzimanikatis V. Genome-scale thermodynamic analysis of Escherichia coli metabolism. Biophys. J. 2006;90:1453–1461. doi: 10.1529/biophysj.105.071720. [DOI] [PMC free article] [PubMed] [Google Scholar]
- 16.Kümmel A., Panke S., Heinemann M. Putative regulatory sites unraveled by network-embedded thermodynamic analysis of metabolome data. Mol. Syst. Biol. 2006;2 doi: 10.1038/msb4100074. 2006.0034. [DOI] [PMC free article] [PubMed] [Google Scholar]
- 17.Kümmel A., Panke S., Heinemann M. Systematic assignment of thermodynamic constraints in metabolic network models. BMC. Bioinf. 2006;7:512. doi: 10.1186/1471-2105-7-512. [DOI] [PMC free article] [PubMed] [Google Scholar]
- 18.Hoppe A., Hoffmann S., Holzhütter H.G. Including metabolite concentrations into flux balance analysis: thermodynamic realizability as a constraint on flux distributions in metabolic networks. BMC Syst. Biol. 2007;1:23. doi: 10.1186/1752-0509-1-23. [DOI] [PMC free article] [PubMed] [Google Scholar]
- 19.Henry C.S., Broadbelt L.J., Hatzimanikatis V. Thermodynamics-based metabolic flux analysis. Biophys. J. 2007;92:1792–1805. doi: 10.1529/biophysj.106.093138. [DOI] [PMC free article] [PubMed] [Google Scholar]
- 20.Fleming R.M.T., Thiele I., Nasheuer H.P. Quantitative assignment of reaction directionality in constraint-based models of metabolism: application to Escherichia coli. Biophys. Chem. 2009;145:47–56. doi: 10.1016/j.bpc.2009.08.007. [DOI] [PMC free article] [PubMed] [Google Scholar]
- 21.von Bertalanffy L. G. Braziller; New York: 1973. General System Theory: Foundations, Development, Applications. [Google Scholar]
- 22.Fleming R.M.T., Thiele I. von Bertalanffy 1.0: a COBRA toolbox extension to thermodynamically constrain metabolic models. Bioinformatics. 2011;27:142–143. doi: 10.1093/bioinformatics/btq607. [DOI] [PMC free article] [PubMed] [Google Scholar]
- 23.Schellenberger J., Que R., Palsson B.Ø. Quantitative prediction of cellular metabolism with constraint-based models: the COBRA Toolbox v2.0. Nat. Protoc. 2011;6:1290–1307. doi: 10.1038/nprot.2011.308. [DOI] [PMC free article] [PubMed] [Google Scholar]
- 24.Alberty R.A. Wiley-Interscience; Hoboken, NJ: 2006. Biochemical Thermodynamics: Applications of Mathematica. [PubMed] [Google Scholar]
- 25.Duarte N.C., Becker S.A., Palsson B.Ø. Global reconstruction of the human metabolic network based on genomic and bibliomic data. Proc. Natl. Acad. Sci. USA. 2007;104:1777–1782. doi: 10.1073/pnas.0610772104. [DOI] [PMC free article] [PubMed] [Google Scholar]
- 26.Gille C., Bölling C., Holzhütter H.G. HepatoNet1: a comprehensive metabolic reconstruction of the human hepatocyte for the analysis of liver physiology. Mol. Syst. Biol. 2010;6:411. doi: 10.1038/msb.2010.62. [DOI] [PMC free article] [PubMed] [Google Scholar]
- 27.Qi F., Chen X., Beard D.A. Detailed kinetics and regulation of mammalian NAD-linked isocitrate dehydrogenase. Biochim. Biophys. Acta. 2008;1784:1641–1651. doi: 10.1016/j.bbapap.2008.07.001. [DOI] [PMC free article] [PubMed] [Google Scholar]
- 28.Jol S.J., Kümmel A., Heinemann M. Thermodynamic calculations for biochemical transport and reaction processes in metabolic networks. Biophys. J. 2010;99:3139–3144. doi: 10.1016/j.bpj.2010.09.043. [DOI] [PMC free article] [PubMed] [Google Scholar]
- 29.Alberty R.A. Legendre transforms in chemical thermodynamics. J. Chem. Thermodyn. 1997;29:501–516. [Google Scholar]
- 30.Finley S.D., Broadbelt L.J., Hatzimanikatis V. Thermodynamic analysis of biodegradation pathways. Biotechnol. Bioeng. 2009;103:532–541. doi: 10.1002/bit.22285. [DOI] [PMC free article] [PubMed] [Google Scholar]
- 31.Wishart D.S., Knox C., Forsythe I. HMDB: a knowledgebase for the human metabolome. Nucleic Acids Res. 2009;37(Database issue):D603–D610. doi: 10.1093/nar/gkn810. [DOI] [PMC free article] [PubMed] [Google Scholar]
- 32.Kanehisa M., Goto S., Hirakawa M. KEGG for representation and analysis of molecular networks involving diseases and drugs. Nucleic Acids Res. 2010;38(Database issue):D355–D360. doi: 10.1093/nar/gkp896. [DOI] [PMC free article] [PubMed] [Google Scholar]
- 33.de Matos P., Alcántara R., Steinbeck C. Chemical entities of biological interest: an update. Nucleic Acids Res. 2010;38(Database issue):D249–D254. doi: 10.1093/nar/gkp886. [DOI] [PMC free article] [PubMed] [Google Scholar]
- 34.Guha R., Howard M.T., Willighagen E.L. The Blue Obelisk—interoperability in chemical informatics. J. Chem. Inf. Model. 2006;46:991–998. doi: 10.1021/ci050400b. [DOI] [PMC free article] [PubMed] [Google Scholar]
- 35.Zamboni N., Fendt S.M., Sauer U. 13C-based metabolic flux analysis. Nat. Protoc. 2009;4:878–892. doi: 10.1038/nprot.2009.58. [DOI] [PubMed] [Google Scholar]
- 36.Zamboni N., Kümmel A., Heinemann M. anNET: a tool for network-embedded thermodynamic analysis of quantitative metabolome data. BMC Bioinformatics. 2008;9:199. doi: 10.1186/1471-2105-9-199. [DOI] [PMC free article] [PubMed] [Google Scholar]
- 37.Reference deleted in proof.
- 38.Gudmundsson S., Thiele I. Computationally efficient flux variability analysis. BMC Bioinformatics. 2010;11:489. doi: 10.1186/1471-2105-11-489. [DOI] [PMC free article] [PubMed] [Google Scholar]
- 39.Zollner H. Regulation of urea synthesis. The effect of ammonia on the N-acetylglutamate content of isolated rat liver cells. Biochim. Biophys. Acta. 1981;676:170–176. doi: 10.1016/0304-4165(81)90184-7. [DOI] [PubMed] [Google Scholar]
- 40.Roberg B., Torgner I.A., Kvamme E. Properties and submitochondrial localization of pig and rat renal phosphate-activated glutaminase. Am. J. Physiol. Cell Physiol. 2000;279:C648–C657. doi: 10.1152/ajpcell.2000.279.3.C648. [DOI] [PubMed] [Google Scholar]
- 41.Lyles G.A., Chalmers J. The metabolism of aminoacetone to methylglyoxal by semicarbazide-sensitive amine oxidase in human umbilical artery. Biochem. Pharmacol. 1992;43:1409–1414. doi: 10.1016/0006-2952(92)90196-p. [DOI] [PubMed] [Google Scholar]
- 42.Abelson H.T., Spector R., Fosburg M. Kinetics of tetrahydrobiopterin synthesis by rabbit brain dihydrofolate reductase. Biochem. J. 1978;171:267–268. doi: 10.1042/bj1710267. [DOI] [PMC free article] [PubMed] [Google Scholar]
- 43.Zhang J.W., Ge G.B., Yang L. Taxane's substituents at C3′ affect its regioselective metabolism: different in vitro metabolism of cephalomannine and paclitaxel. Drug Metab. Dispos. 2008;36:418–426. doi: 10.1124/dmd.107.018242. [DOI] [PubMed] [Google Scholar]
- 44.Bennett B.D., Kimball E.H., Rabinowitz J.D. Absolute metabolite concentrations and implied enzyme active site occupancy in Escherichia coli. Nat. Chem. Biol. 2009;5:593–599. doi: 10.1038/nchembio.186. [DOI] [PMC free article] [PubMed] [Google Scholar]
- 45.Mdluli K., Booth M.P.S., Rumsby G. A preliminary account of the properties of recombinant human glyoxylate reductase (GRHPR), LDHA and LDHB with glyoxylate, and their potential roles in its metabolism. Biochim. Biophys. Acta. 2005;1753:209–216. doi: 10.1016/j.bbapap.2005.08.004. [DOI] [PubMed] [Google Scholar]
- 46.Ederer M., Gilles E.D. Thermodynamically feasible kinetic models of reaction networks. Biophys. J. 2007;92:1846–1857. doi: 10.1529/biophysj.106.094094. [DOI] [PMC free article] [PubMed] [Google Scholar]
- 47.Liebermeister W., Uhlendorf J., Klipp E. Modular rate laws for enzymatic reactions: thermodynamics, elasticities and implementation. Bioinformatics. 2010;26:1528–1534. doi: 10.1093/bioinformatics/btq141. [DOI] [PubMed] [Google Scholar]
- 48.Reference deleted in proof.
- 49.Cook P.F., Cleland W.W. Taylor & Francis Group; London, UK: 2007. Enzyme Kinetics and Mechanism. [Google Scholar]
- 50.Cannon W.R., Pettitt B.M., McCammon J.A. Sulfate anion in water: model structural, thermodynamic, and dynamic properties. J. Phys. Chem. 1994;98:6225–6230. [Google Scholar]
- 51.Kast P., Tewari Y.B., Goldberg R.N. Thermodynamics of the conversion of chorismate to prephenate: experimental results and theoretical predictions. J. Phys. Chem. B. 1997;101:10976–10982. [Google Scholar]
- 52.Tewari Y.B., Chen J., Goldberg R.N. Thermodynamic and quantum chemical study of the conversion of chorismate to (pyruvate + 4-hydroxybenzoate) J. Phys. Chem. B. 1998;102:8634–8639. [Google Scholar]
Associated Data
This section collects any data citations, data availability statements, or supplementary materials included in this article.