

Abstract
We have developed a multianalyte fluid-phase protein array technology termed high-throughput immunophenotyping using transcription (HIT). This method employs a panel of monoclonal antibodies, each tagged with a unique oligonucleotide sequence that serves as a molecular bar code. After staining a sample, T7 polymerase amplifies the tags, which are then hybridized to a DNA microarray for indirect measurement of each analyte. Although there are many potential applications for this technology, here we report its suitability for profiling cytokines, intracellular molecules and cell surface markers. Using HIT, we profiled 90 surface markers on human naive T helper cells activated in vitro. The markers identified in this screen are consistent with previously described activation markers and were validated by flow cytometry. Additionally, a HIT screen of surface markers expressed on T helper cells activated in the presence of transforming growth factor-β identified downregulation of CD26 in these cells. HIT arrays are an ideal platform for rapidly identifying markers for further characterization and therapeutic intervention.
Proteomics and genomics technologies offer tremendous promise for generating and testing new hypotheses related to disease and basic cell biology1. In the field of proteomics, there is still a need for improved methods of analyzing specific proteins in a high-throughput manner2. One rapidly evolving branch of biased proteomics screening technologies is the protein array platform. There are many varieties of protein arrays designed to target different proteomes. Arrays of antigens or cell lysates have been used to investigate multiple disease processes3-5, and arrays of antibodies have been described for profiling cytokines6, intracellular targets7 and surface markers8. Although these assays are used successfully in a variety of settings, each application requires considerably different solid supports, unique reagents and specialized protocols.
As an alternative to planar or bead-based antibody arrays, here we describe a new, versatile, antibody-based protein array platform termed HIT, in which we use a panel of fluid-phase antibodies to probe small aliquots of biological samples (Fig. 1). Instead of identifying each antibody by an address on a planar or bead-based array, we couple each antibody in the cocktail to a unique DNA sequence that serves as a molecular bar code. These bar codes can then be amplified and profiled with DNA microarrays. There has been extensive work in the area of nucleic acid bar code immunoassays, including immuno-PCR9-11, immuno–rolling circle amplification6,12, immunodetection amplified by T7 RNA polymerase13, fluorescent amplification catalyzed by T7 polymerase technique14, proximity ligation15,16 and nanoparticle bar code assays17; however, there have been no reports of highly multiplexed versions of these assays owing to the expense and labor involved in directly modifying primary antibodies with unique DNA tags. We have addressed this problem by conjugating DNA tags to secondary monovalent Fab fragments, or monovalent streptavidin (mSA)18, as a convenient method of indirectly labeling microgram quantities of immunoglobulin19,20. These simple labeling reagents allow us to perform 48-plex HIT reactions with microgram aliquots of monoclonal antibodies. We demonstrate that the HIT platform can be used to profile cytokines and intracellular signaling molecules, but we have focused on cell surface profiling as a major application of HIT, as cell surface molecules are intimately involved in disease pathogenesis, aid in identification of cell populations and constitute a major class of therapeutic targets5.
Figure 1.
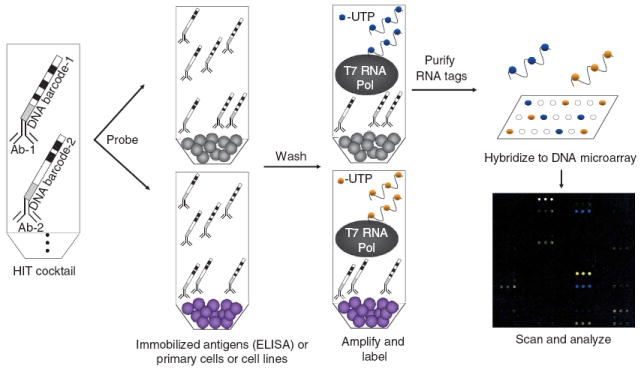
Schematic depicting the general format of HIT. Monoclonal antibodies coupled to unique oligonucleotide sequences are pooled to create a cocktail. This mixture is used to probe samples, such as cells in a microcentrifuge tube or in wells of a 96-well plate containing captured antigens. After washing, T7 RNA polymerase (T7 RNA Pol) amplifies the remaining tags and incorporates a label. The labeled RNA tags are then purified and hybridized to a custom DNA microarray. After scanning, the relative fluorescent intensity of each tag serves as an indirect measurement of the amount of each antigen in the original samples.
RESULTS
Antigen detection by T7-amplified oligonucleotide bar codes
To develop the multiplex HIT arrays depicted in Figure 1, we identified a simple and inexpensive strategy for coupling unique oligonucleotide tags to small aliquots of commercially available monoclonal antibodies. Attempts at directly modifying many monoclonal antibodies directly with DNA tags13,21 proved labor intensive and expensive. We explored an alternative, indirect labeling strategy using monovalent secondary Fab fragments19,20 conjugated to DNA tags (Supplementary Fig. 1 online). To make Fab-oligonucleotide conjugates, we mixed benzaldehyde-modified oligonucleotide bar code templates (Supplementary Tables 1 and 2 online) with hydrazine-modified Fab fragments (Supplementary Fig. 1). Absorbance spectroscopy and gel electrophoresis verified the formation of a stable hydrazone bond covalently linking the Fab fragment to the oligonucleotide (Supplementary Fig. 1). A preincubation step allowed these Fab-oligonucleotide reagents to indirectly label each antibody (Supplementary Fig. 1). To prevent cross-labeling, we added excess polyclonal mouse γ-globulin to bind free Fab fragments as previously described20. Oligonucleotide tags were generated with an in silico approach that minimized cross-hybridization and selected for similar melting temperatures (Supplementary Tables 1 and 2).
We then tested the overall HIT strategy with a single antigen-antibody pair. Wells of a 96-well plate coated with heat shock protein 70 (HSP70) had a strong signal when probed with an Fab-oligonucleotide–modified antibody specific for HSP70 (Fig. 2a). Mock-coated wells and wells probed with an IgG1 isotype negative control antibody showed minimal signal (Fig. 2a). We observed weak signal when we added the Fab-oligonucleotide tag and the antibody to HSP70 directly into the HIT cocktail without preincubation (Fig. 2a), which verified that cross-labeling due to free Fab fragments binding to sites on a different primary antibody was minimal. These data show that it is possible to modify small aliquots of monoclonal antibody with a unique DNA tag, amplify and label the tag with T7 polymerase and hybridize the transcribed tag to a DNA microarray.
Figure 2.
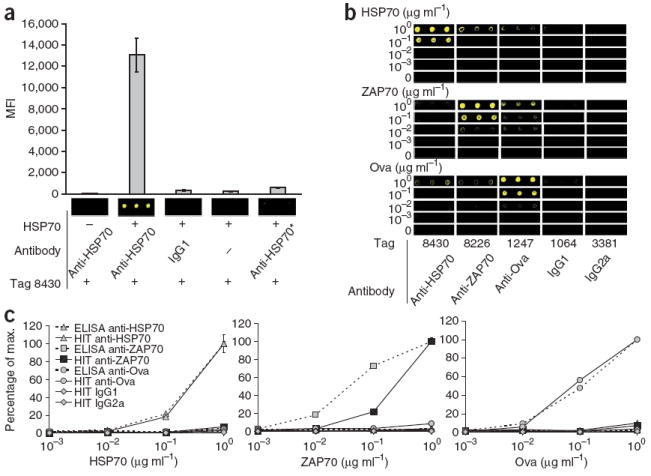
ELISA format HIT. (a) Scanned images and median fluorescent intensity (MFI) of a single-analyte reaction. We coated wells with buffer (−) or 1 μg ml−1 HSP70 (+). We then coupled an isotype control (IgG1) antibody or monoclonal antibody to HSP70 (anti-HSP70) to Fab-oligonucleotide tag 8430. *, anti-HSP70 was not preincubated with the Fab-oligonucleotide tag in this reaction. (b,c) Serial dilutions of HSP70, ZAP70 or ovalbumin (Ova) ranging from 1 μg ml−1 to 1 ng ml−1 probed by conventional single-analyte ELISA or with the multiplex HIT cocktail. Scanned images of 635-nm intensity (pseudocolored yellow; b) and percentage of maximum intensity of ELISA wells (c) and tags 8430, 8226, 1247, 1064 and 3381, which we used to label anti-HSP70, anti-ZAP70, anti-Ova and isotype controls IgG1 and IgG2a, respectively. For this experiment, we added biotin-UTP for incorporation during tag amplification, and then we probed the arrays with Alexa-647–streptavidin for visualization of hybridized tags. We calculated the percentage of maximum and s.d. (n = 3) from absorbance at 450 nm for the ELISA samples and from MFI for the HIT samples.
Multiplex ELISA format HIT
To extend the HIT platform to a multiplex format, we coupled five Fab-oligonucleotide tags to three monoclonal antibodies specific for HSP70, ζ-chain-associated protein kinase 70 (ZAP70) and ovalbumin, as well as two isotype controls (IgG1 and IgG2a), to create a fiveplex HIT cocktail. We then probed serial dilutions of HSP70, ZAP70 or ovalbumin proteins by conventional single-analyte ELISA or with the multiplex HIT cocktail (Fig. 2b,c). The scanned images qualitatively show that the correct tags were amplified when each antibody recognized its cognate antigen (Fig. 2b). With respect to sensitivity and dynamic range, the HIT approach was comparable to ELISA with antibodies to HSP70 or ovalbumin (Fig. 2c). The antibody to ZAP70 was less sensitive by HIT than by ELISA (Fig. 2c). This could be due in part to the fact that the antibody to ZAP70 was an IgG2a antibody, whereas the antibodies to HSP70 and ovalbumin were IgG1, and thus the batch of secondary Fab fragments may have more efficiently labeled IgG1 than it did IgG2a. Subsequent batches of Fab-oligonucleotide conjugates did not show a bias for IgG1 or IgG2a antibodies, and the assay was sufficiently sensitive to detect ZAP70 in primary human CD4+ T cells (data not shown).
In addition to the Fab-oligonucleotide labeling reagents, we developed an alternative approach by preincubating mSA-oligonucleotide conjugates with biotinylated antibodies to measure secreted cytokines. Multiplex HIT measurement of interleukin-1β (IL-1β), IL-6, IL-12 p40 and tumor necrosis factor was comparable to ELISA and Luminex bead–based cytokine arrays (Supplementary Fig. 2 online). Furthermore, mean concentrations measured by HIT were both reproducible and accurate (Supplementary Fig. 3 online).
Surface markers and intracellular proteins detected by HIT
As a model system for developing cell surface marker and intracellular protein analyses, we analyzed a CD3+CD4+ Jurkat T cell line and a CD19+CD20+ OCI B cell line22 (Fig. 3). The Jurkat T cell line expressed high amounts of CD3 but expressed CD4 heterogeneously and in low amounts (Fig. 3a). We probed 1 × 10⁶ cells with a 48-plex HIT cocktail in which 44 of the Fab-oligonucleotide tags were coupled to aliquots of an IgG1 isotype negative control antibody, and the four remaining Fab oligonucleotide tags were coupled to antibodies specific for CD3, CD4, CD19 and CD20. The scanned images of array features qualitatively showed that the expected markers were detected (Fig. 3c). Swapping the dyes between samples and self-self comparisons also showed the expected patterns of fluorescence intensity (Fig. 3c), confirming that surface markers could be detected using HIT. Using fixed and permeabilized Jurkat T cells, we were also able to detect ZAP70 and β-actin (Supplementary Fig. 4 online), broadening the applications of HIT to include not only surface molecules but also intracellular proteins.
Figure 3.
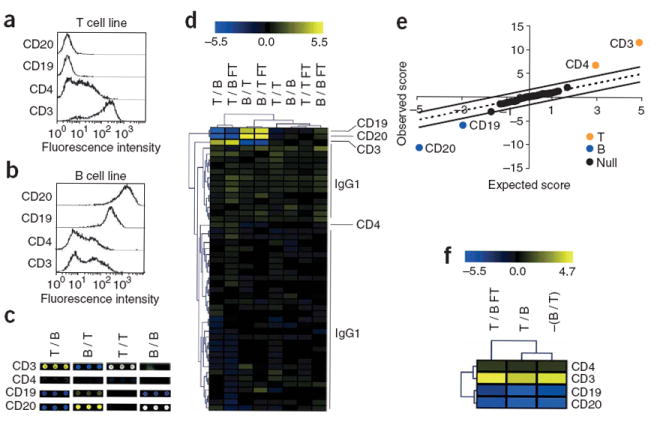
Surface marker profiling format of HIT. (a,b) Histogram plots of fluorescent intensity by flow cytometry after staining a T cell line (a) and a B cell line (b) for the indicated markers. (c–f) We coupled 44 of the Fab-oligonucleotide tags to aliquots of an IgG1 isotype negative control antibody, and we coupled the four remaining tags to anti-CD3, anti-CD4, anti-CD19 and anti-CD20 to create a 48-plex HIT cocktail. We then used this cocktail to stain 1 × 10⁶ T or B cells, and during amplification we incorporated either Cy3-UTP or Cy5-UTP. Additionally, we snap-froze and thawed an aliquot of the cocktail (FT). (c) Scanned images of array features corresponding to tags linked to each specific antibody. Columns correspond to four different arrays notated with the Cy5 reaction listed first, followed by the Cy3 reaction (for example, a Cy5 T cell reaction versus a Cy3 B cell reaction is notated as T / B). Cy5 is pseudocolored yellow, Cy3 is pseudocolored blue and equivalent intensity is pseudocolored white. (d) Unsupervised hierarchical clustering of tags and samples from each array. The heat map shows log2 (Cy5 / Cy3) fold changes for each tag. (e) SAM output plot for each tag highlighting markers associated with the T cell line (T), B cell line (B) or neither (Null). (f) Hierarchical clustering of markers identified by SAM as having a statistically significant association (q value = 0) with either the T (pseudocolored yellow) or B (pseudocolored blue) cells from three representative comparisons. For the dye swap column −(B / T), the parity of each log2 fold change was reversed.
We then calculated a log2 fold change for each tag from the surface marker profiling experiments and performed unsupervised hierarchical clustering of tags and samples (Fig. 3d). Of note, data generated from a frozen and thawed cocktail clustered together with the data from a freshly prepared cocktail (Fig. 3d), indicating that HIT cocktails can be prepared in advance and stored at −20 °C for future use. The tag coupled to a CD4-specific antibody clustered with tags coupled to isotype control antibodies, which is consistent with its lower staining relative to the other markers (Fig. 3a). Using three arrays we then applied a one-class significance analysis of microarrays (SAM) algorithm that highlighted markers associated with the T cell line, B cell line or neither (Fig. 3e). We successfully identified CD3 and CD4 on Jurkat T cells and CD19 and CD20 on OCI B cells (Fig. 3e,f). Although we used 1 × 10⁶ cells for this series of experiments, as few as 1 × 10⁵ cells were sufficient for detection of CD4, CD3, CD19 and CD20 (Supplementary Fig. 5 online). Collectively, these data confirm that HIT can be used for surface marker profiling with low false-positive rates on as few as 1 × 10⁵ cells using either freshly prepared or frozen HIT cocktails.
Surface marker profiling of activated human T cells
To develop high-throughput surface marker phenotyping, we cultured naive CD4+CD45RO−CD25− T cells from three healthy human donors in vitro in the presence or absence of polyclonal stimulation for 48 h. We profiled 90 markers and four isotype controls on resting and activated cells with two 48-plex HIT reactions. For donors 1 and 2, markers that were upregulated upon activation appeared yellow, and markers that were downregulated appeared blue (Fig. 4a,b). Swapping the dyes reversed this pattern in donor 3 (Fig. 4a,b). A comparison between activated cells from donors 1 and 3 yielded log2 fold changes near zero (pseudocolored black), as expected (Fig. 4a,b). One-class SAM identified the expected surface marker changes on activated T cells (for example, upregulation of CD25, CD69 and CD95 and downregulation of CD3 and CD62 ligand; Fig. 4c). Our screen failed to identify some of the anticipated markers of T cell activation, such as upregulation of inducible T cell costimulator and CD154 and downregulation of CXCR4 and CD45RA. These false negatives could potentially have resulted from the amount of antibody used, the presence of high amounts of competing immunoglobulins, the amplification efficiency of the individual DNA tag or the time point analyzed. We then validated SAM-identified markers by conventional flow cytometry (Supplementary Fig. 6 online) and observed a qualitative correlation with the HIT data (Fig. 4c). HIT log2 fold changes from the three random donors also showed a high correlation (Pearson r = 84% ± 2%) with log2 fold changes for a representative donor analyzed by flow cytometry (Fig. 4d).
Figure 4.
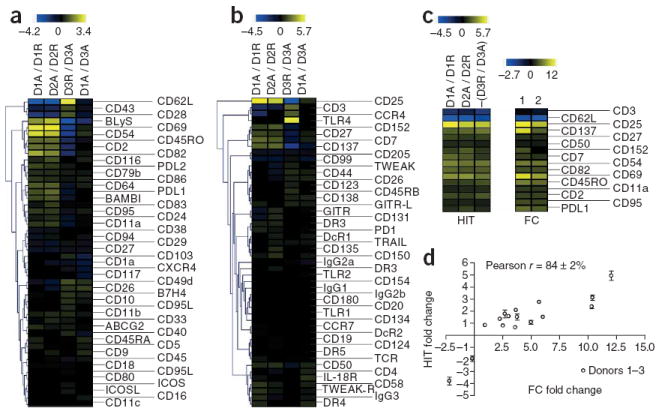
Surface marker phenotype of activated versus resting primary human naive T helper cells. We purified CD4+CD45RO−CD25− naive human T helper cells from three donors and either rested or activated them for 48 h with anti-CD3 and anti-CD28 coated magnetic beads. We then stained 1 × 10⁶ resting or activated cells with 48 Fab-oligonucleotide–coupled monoclonal antibodies directed against a panel of surface markers. (a,b) Unsupervised hierarchical clustering of tags and samples from each array for markers 1–48 (a) and markers 49–96 (b). The heat map shows log2 (Cy5 / Cy3) fold changes for each tag. The columns correspond to different arrays notated with the Cy5 reaction listed first followed by the Cy3 reaction (for example, Cy5 donor 1 activated versus Cy3 donor 1 resting is notated as D1A / D1R). (c) Markers identified by SAM as having a statistically significant association (q value = 0) with either activated T cells (pseudocolored yellow) or resting T cells (pseudocolored blue) from three comparisons. For the dye swap column −(D3R / D3A), the parity of each log2 fold change was reversed. Log2 fold change values for HIT (left) and for flow cytometry (FC) (right) are shown for comparison. (d) Plot of HIT versus FC log2 fold changes for SAM-identified markers. Data represent mean values ± s.d. from the three donors analyzed by HIT versus flow cytometry data from a representative donor.
We next characterized the surface marker phenotype of T helper cells activated in the presence or absence of transforming growth factor-β (TGF-β). TGF-β induces upregulation of Foxp3, a transcription factor thought to drive the differentiation of regulatory T cells (Treg cells), in naive CD4+CD25− cells when added in combination with T cell receptor cross-linking23. In contrast to naturally occurring Treg cells, which develop in the thymus, these TGF-β–induced FOXP3+ cells represent an inducible Treg cell type generated in the periphery from naive T helper cell precursors, although the in vivo significance of the inducible Treg cell pathway is still controversial24,25. Consistent with previous reports23, TGF-β promoted increased expression of FOXP3 in activated CD4+CD25− cells (P = 0.0013; Fig. 5a). Surface marker phenotyping with HIT showed that T helper cells activated in the presence of TGF-β maintain aspects of a naive surface marker phenotype (CD62LhiCD9hiCD11aloCD38loCD45ROlo), even in the presence of a strong polyclonal stimulus (Fig. 5b). Notably, TGF-β treatment markedly downregulated CD26 (Fig. 5b,c). CD26, or dipeptidyl peptidase IV, is a membrane-bound serine peptidase with co-stimulatory activity26. In contrast to the low CD26 expression that we observed, T cell clones isolated from individuals with multiple sclerosis reportedly express high amounts of CD26 (ref. 27), and the number of CD4+CD26hi cells correlates with disease severity in multiple sclerosis28. The downregulation of CD26 that we observed in vitro by treatment with TGF-β led us to investigate the in vivo state of CD26 expression on FOXP3+CD25hi cells (Fig. 5d). A subset of naturally occurring FOXP3+CD25hi Treg cells showed a marked down-regulation of CD26 (Fig. 5e). Although high CD26 expression is associated with increased disease severity and pathogenic effector T helper cell lineages, our data suggest that low CD26 expression is associated with both inducible and naturally occurring regulatory T helper cell subsets.
Figure 5.
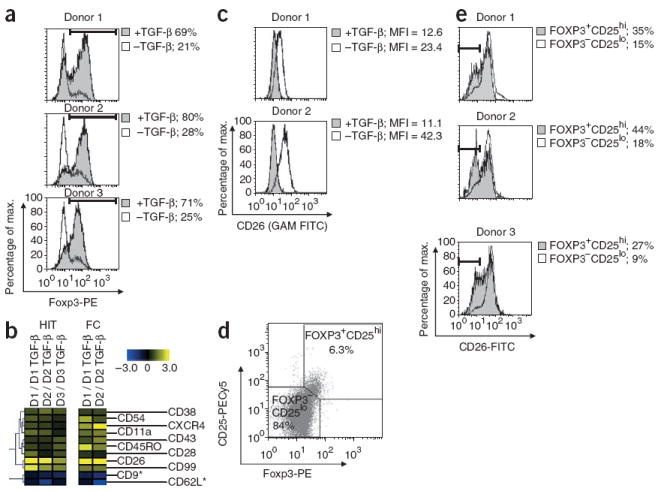
HIT identifies downregulation of CD26 on TGF-β–treated human T helper cells and a subset of circulating FOXP3+ cells. (a) Histogram plots of FOXP3 staining in CD4+CD25− T cells isolated from three donors and activated in the presence or absence of TGF-β for 5 d. Percentages indicate FOXP3+ gate. (b) Unsupervised hierarchical clustering of SAM-identified markers by HIT (left) and validation by FC (right). The heat map shows log2 (Cy5 / Cy3) fold changes for each tag. The columns correspond to different arrays notated with the Cy5 reaction listed first followed by the Cy3 reaction (for example, Cy5 donor 1 without TGF-β versus Cy3 donor 1 with TGF-β is notated D1 / D1 TGF-β). (c) Histogram plots of CD26 staining on CD4+CD25− T cells activated in the presence or absence of TGF-β for 5 d. (d) Dot plot of CD25 and FOXP3 staining in freshly isolated peripheral blood mononuclear cells, gating on CD4+ cells from a representative donor. Percentages in the FOXP3+CD25hi and FOXP3−CD25lo gates are shown. (e) Histogram plots of CD26 staining in FOXP3+CD25hi and FOXP3−CD25lo gates.
* indicates a nonsignificant q value = 0.26.
DISCUSSION
The multiplex HIT platform is ideally suited for screening panels of monoclonal antibodies. HIT retains the antibodies in fluid-phase, provides extensive multiplexing capacity, and permits staining of different types of biological samples. Labeling microgram quantities of antibody with oligonucleotide-modified secondary monovalent Fab fragments, or with mSA, circumvents the expense and labor that have previously precluded the development of this type of multiplex assay.
One limitation of HIT is that the method absolutely requires a panel of highly specific antibodies. Recent developments in rapid hybridoma screening29 and whole-proteome characterization of antibody specificity30, however, could accelerate the identification of improved reagents. Another limitation is that the HIT method requires pure populations of cells. Despite this requirement, HIT profiling has several advantages over multicolor flow cytometry. The oligonucleotide tags have minimal cross-hybridization, which obviates the need for spectral compensation and streamlines data analysis. Furthermore, HIT reagents are more straightforward to design and conjugate than multicolor antibody panels. Given these advantages, we envision that researchers could use HIT to initially screen antibody panels on a small purified population of cells and then validate and extend the significant markers with focused multicolor flow cytometry studies.
There are a number of noteworthy possible extensions of this technology. Moving to the bar code DNA microarray platforms that are already commercially available would allow for higher-throughput HIT studies. Additionally, HIT could theoretically be extended to the analysis of tissue sections or microdissected cells. With these improvements and extensions, HIT would be situated as an ideal platform for rapidly identifying protein markers for further characterization.
METHODS
Preparation of Fab- and mSA-oligonucleotide labeling reagents
We concentrated monovalent goat antibody to mouse Fab fragments (Jackson ImmunoResearch Laboratories) to 10 mg ml−1 on Vivaspin 6 3,000 molecular weight cutoff spin columns (Sartorius) and modified them with succinimidyl 6-hydrazinonicotinate acetone hydrazone (SANH) (Solulink) according to the manufacturer’s protocol. We removed unbound SANH on three successive Zeba desalt spin columns (Pierce). Similarly, we expressed and purified mSA from expression vectors (a kind gift from A. Ting) as previously described18 and then conjugated it to SANH. We obtained an oligonucleotide containing the T7 promoter sequence 5′-ATGGAATTCCTAATACGACTCACTATAGGG-3′ with a 5′ benzaldehyde from Trilink Biotechnologies. To generate double-stranded oligonucleotides, we mixed 70-mer template strands containing bar code sequences embedded between a T7 promoter and a poly-adenine tail (Supplementary Table 1) with the benzaldehyde-modified T7 promoter and a reverse complementary 40-mer sequence in equimolar ratios. We then annealed the samples in annealing buffer (10 mM sodium phosphate pH 7.5, 100 mM sodium chloride) in an iCycler PCR machine (BioRad) by cooling the samples from 95 °C down to 4 °C, decreasing 0.5 °C every 30 s. We then mixed aliquots of the desalted hydrazine-modified Fab fragments with the annealed benzaldehyde-modified DNA oligonucleotide tags at a molar ratio of 1:2 Fab to oligonucleotide in conjugation buffer (100 mM sodium citrate pH 5.75, 150 mM sodium chloride). We incubated the reactions for 12 h at 21–23 °C and then for 12 h at 4 °C before storing them in 50% glycerol (Invitrogen), PBS without calcium or magnesium (Invitrogen), 5 mM EDTA (Invitrogen) and 0.05% sodium azide (Sigma-Aldrich) at −20 °C. We performed absorbance spectroscopy with the NanoDrop ND-1000 Spectrophotometer (NanoDrop). For purification by ion-exchange chromatography, we applied the Fab-oligonucleotide conjugates to Vivapure Q Mini H (Sartorius) columns, washed twice with conjugation buffer and finally eluted in PBS containing 1 M sodium chloride. For PAGE analysis, we separated samples on 12% Tris-HCl precast gels (BioRad) in native running buffer (25 mM Tris base, 192 mM glycine, pH 8.3). We then rinsed the gel three times for 5 min with double-distilled water (ddH2O) before staining for 25 min in SYBR stain (Invitrogen) to visualize nucleic acids. We imaged the gel using an AlphaImager with a SYBR green filter (Alpha Innotech). After nucleic acid staining, we destained the gel for 5 min in ddH2O, stained it for 1 h with Bio-Safe Coomassie stain (BioRad) and finally destained it in ddH2O for 1 h.
HIT cocktail preparation, probing, and amplification
To prepare the HIT cocktail, we placed 2.5 μg of each antibody (Supplementary Table 3 online) and 3.4 μg of each Fab-oligonucleotide conjugate (4:1 Fab-oligonucleotide to antibody molar ratio) in a 96-well V-bottom polypropylene plate (Corning) and incubated it at 4 °C for 2 h. Alternatively, we preincubated 2.5 μg of biotinylated antibody with 3.4 μg of mSA-oligonucleotide conjugate at 4 °C for 2 h. We then added 5 μl of HIT cocktail dilution buffer (1.5% BSA (Sigma Aldrich), 15 mM EDTA, 2.2 mg ml−1 mouse γ-globulin (Jackson ImmunoResearch Laboratories), 150 μg ml−1 salmon sperm DNA (Invitrogen) and PBS) to each well and incubated for 10 min. For mSA-oligonucleotide experiments (Supplementary Figs. 1 and 3), we used 2 μM biotin (Sigma-Aldrich) to quench the labeling reaction instead of γ-globulin. We then quickly pooled the wells and transferred the solution to a single microcentrifuge tube. We either snap-froze the cocktail for 2 min in a dry-ice ethanol bath and transferred it to a −20 °C freezer, or we used the cocktail immediately. For cell surface staining, we preblocked 1.5-ml microcentrifuge tubes or PCR tubes for 1 h in blocking buffer (1.5% BSA, 15 mM EDTA, 150 μg ml−1 salmon sperm DNA and PBS), washed them twice with PBS and then added the cells in a volume of 25 μl. We then added 50 μl of the HIT cocktail to the samples and incubated the mixture for 30 min at 4 °C. We washed the samples three times with wash buffer (1.5% BSA, 15 mM EDTA and PBS), fixed them for 15 min at 21–23 °C in fixation buffer (1.6% paraformaldehyde (Polysciences) in wash buffer) and then washed them twice in PBS. After washing, we aspirated the remaining PBS and brought the reaction to a final volume of 50 μl in amplification mix (250 U T7 RNA Polymerase-Plus (Ambion), 1x transcription buffer (Ambion), 0.5 mM ATP, 0.5 mM CTP, 0.5 mM GTP, 0.33 mM UTP and 0.17 mM Cy3-UTP or 0.17 mM Cy5-UTP (PerkinElmer)). We incubated the in vitro transcription reactions at 37 °C for 4–6 h on a shaking platform. Alternatively, we fixed the cells before staining, washed them twice with wash buffer, and then processed them as above without further fixation (Supplementary Fig. 5). To prepare cells for intracellular staining, we fixed the cells for 15 min at 21–23 °C, washed them once with wash buffer, permeabilized them with 250 μl 100% molecular biology grade ethanol (Sigma-Aldrich) for 10 min on ice and washed them three times with wash buffer before staining with the HIT cocktail and processing as above without further fixation. For indirect labeling experiments (Supplementary Figs. 2 and 3), we added biotin-16-UTP and digoxigenin-11-UTP (Roche Applied Science) in place of Cy3- or Cy5-UTP. We purified the RNA tags with either the mirVana miRNA Isolation Kit (Ambion) or the RNeasy MinElute Cleanup Kit (Qiagen) according to the manufacturer’s instructions. We hybridized the purified RNA tags immediately or stored them at −80 °C.
Statistical analyses and hierarchical clustering
For microarray analysis, we averaged the median of 635 nm / 532 nm ratios from replicate tags. The fold change for each tag was calculated by taking the log2 of the ratios. We applied a low-intensity cut-off filter during analysis such that spots with pixel intensities less than two standard deviations above background in both 635 nm and 532 nm channels were set to a fold change of zero. The arrays were median-centered by subtracting the median log value and analyzed by one-class significance analysis of microarrays31 to identify markers with statistically significant differences. We selected markers were selected on the basis of criteria that included false discovery rate = 0 and q value = 0 unless otherwise indicated. We generated heat-map and Euclidean complete linkage hierarchical clustering images with Tigr Multiexperiment viewer (TM4:MeV)32. For the flow cytometry data, we calculated the mean fluorescent intensity (MFI) of each marker minus the MFI of an IgG1 isotype negative control for activated cells and divided by the value for resting cells. We then calculated the log2 of this value to obtain a log2 fold change for the flow cytometry samples. For resting cell markers with values less than one, the fold change is undefined, so these values were arbitrarily set to one to generate a heat map. We calculated the Pearson correlation coefficients of fold changes from three donors analyzed by HIT and a single donor analyzed by flow cytometry with GraphPad Prism 4 software. We performed linear regression and statistical analyses with GraphPad Prism 4 software.
Supplementary Material
Acknowledgments
We thank S. Chan, D. Thibault, J. Mollick, P. Teo, A. Venteicher, S. Wrenn, R. Tibshirani, M. Schaner, J. Chi and other members of our laboratory for helpful discussion and technical assistance. We thank A. Ting (Massachusetts Institute of Technology) for kindly providing mSA plasmids. We also thank the Stanford University Human Immune Monitoring Center for assistance with Luminex cytokine data acquisition. M.G.K. was funded by the Stanford Medical Scientist Training Program and the Floren Family Trust. N.O. was funded by the Center for Clinical Immunology at Stanford Summer Research Program and the Northern California Chapter of the Arthritis Foundation. R.K.C. was funded by the Stanford Program in Immunology training grant 5 T32 AI07290. P.J.U. is the recipient of a Donald E. and Delia B. Baxter Foundation Career Development Award and was supported by the Dana Foundation, the Floren Family Trust, the Northern California Chapter of the Arthritis Foundation, US National Institutes of Health Grants DK61934, AI50854, AI50865 and AR49328 and National Heart, Lung, and Blood Institute Proteomics Contract N01-HV-28183.
Footnotes
Note: Supplementary information is available on the Nature Medicine website.
COMPETING INTERESTS STATEMENT
The authors declare competing financial interests: details accompany the full-text HTML version of the paper at http://www.nature.com/naturemedicine/.
References
- 1.Fathman CG, Soares L, Chan SM, Utz PJ. An array of possibilities for the study of autoimmunity. Nature. 2005;435:605–611. doi: 10.1038/nature03726. [DOI] [PubMed] [Google Scholar]
- 2.Chan SM, Utz PJ. The challenge of analyzing the proteome in humans with autoimmune diseases. Ann NY Acad Sci. 2005;1062:61–68. doi: 10.1196/annals.1358.009. [DOI] [PubMed] [Google Scholar]
- 3.Chan SM, Ermann J, Su L, Fathman CG, Utz PJ. Protein microarrays for multiplex analysis of signal transduction pathways. Nat Med. 2004;10:1390–1396. doi: 10.1038/nm1139. [DOI] [PubMed] [Google Scholar]
- 4.Robinson WH, et al. Autoantigen microarrays for multiplex characterization of autoantibody responses. Nat Med. 2002;8:295–301. doi: 10.1038/nm0302-295. [DOI] [PubMed] [Google Scholar]
- 5.Balboni I, et al. Multiplexed protein array platforms for analysis of autoimmune diseases. Annu Rev Immunol. 2006;24:391–418. doi: 10.1146/annurev.immunol.24.021605.090709. [DOI] [PubMed] [Google Scholar]
- 6.Schweitzer B, et al. Multiplexed protein profiling on microarrays by rolling-circle amplification. Nat Biotechnol. 2002;20:359–365. doi: 10.1038/nbt0402-359. [DOI] [PMC free article] [PubMed] [Google Scholar]
- 7.Nielsen UB, Cardone MH, Sinskey AJ, MacBeath G, Sorger PK. Profiling receptor tyrosine kinase activation by using Ab microarrays. Proc Natl Acad Sci USA. 2003;100:9330–9335. doi: 10.1073/pnas.1633513100. [DOI] [PMC free article] [PubMed] [Google Scholar]
- 8.Belov L, et al. Analysis of human leukaemias and lymphomas using extensive immunophenotypes from an antibody microarray. Br J Haematol. 2006;135:184–197. doi: 10.1111/j.1365-2141.2006.06266.x. [DOI] [PubMed] [Google Scholar]
- 9.Hendrickson ER, Truby TM, Joerger RD, Majarian WR, Ebersole RC. High sensitivity multianalyte immunoassay using covalent DNA-labeled antibodies and polymerase chain reaction. Nucleic Acids Res. 1995;23:522–529. doi: 10.1093/nar/23.3.522. [DOI] [PMC free article] [PubMed] [Google Scholar]
- 10.Niemeyer CM, Adler M, Wacker R. Immuno-PCR: high sensitivity detection of proteins by nucleic acid amplification. Trends Biotechnol. 2005;23:208–216. doi: 10.1016/j.tibtech.2005.02.006. [DOI] [PubMed] [Google Scholar]
- 11.Sano T, Smith CL, Cantor CR. Immuno-PCR: very sensitive antigen detection by means of specific antibody-DNA conjugates. Science. 1992;258:120–122. doi: 10.1126/science.1439758. [DOI] [PubMed] [Google Scholar]
- 12.Zhou H, et al. Two-color, rolling-circle amplification on antibody microarrays for sensitive, multiplexed serum-protein measurements. Genome Biol. 2004;5:R28. doi: 10.1186/gb-2004-5-4-r28. [DOI] [PMC free article] [PubMed] [Google Scholar]
- 13.Zhang HT, Kacharmina JE, Miyashiro K, Greene MI, Eberwine J. Protein quantification from complex protein mixtures using a proteomics methodology with single-cell resolution. Proc Natl Acad Sci USA. 2001;98:5497–5502. doi: 10.1073/pnas.101124598. [DOI] [PMC free article] [PubMed] [Google Scholar]
- 14.Zhang H, Cheng X, Richter M, Greene MI. A sensitive and high-throughput assay to detect low-abundance proteins in serum. Nat Med. 2006;12:473–477. doi: 10.1038/nm1378. [DOI] [PubMed] [Google Scholar]
- 15.Fredriksson S, et al. Multiplexed protein detection by proximity ligation for cancer biomarker validation. Nat Methods. 2007;4:327–329. doi: 10.1038/nmeth1020. [DOI] [PubMed] [Google Scholar]
- 16.Gullberg M et al. Cytokine detection by antibody-based proximity ligation. Proc Natl Acad Sci USA. 2004;101:8420–8424. doi: 10.1073/pnas.0400552101. [DOI] [PMC free article] [PubMed] [Google Scholar]
- 17.Nam JM, Thaxton CS, Mirkin CA. Nanoparticle-based bio–bar codes for the ultrasensitive detection of proteins. Science. 2003;301:1884–1886. doi: 10.1126/science.1088755. [DOI] [PubMed] [Google Scholar]
- 18.Howarth M, et al. A monovalent streptavidin with a single femtomolar biotin binding site. Nat Methods. 2006;3:267–273. doi: 10.1038/NMETHXXX. [DOI] [PMC free article] [PubMed] [Google Scholar]
- 19.Kattah MG, Alemi GR, Thibault DL, Balboni I, Utz PJ. A new two-color Fab labeling method for autoantigen protein microarrays. Nat Methods. 2006;3:745–751. doi: 10.1038/nmeth910. [DOI] [PubMed] [Google Scholar]
- 20.Brown JK, Pemberton AD, Wright SH, Miller HR. Primary antibody-Fab fragment complexes: a flexible alternative to traditional direct and indirect immuno-labeling techniques. J Histochem Cytochem. 2004;52:1219–1230. doi: 10.1369/jhc.3A6200.2004. [DOI] [PubMed] [Google Scholar]
- 21.Kozlov IA, et al. Efficient strategies for the conjugation of oligonucleotides to antibodies enabling highly sensitive protein detection. Biopolymers. 2004;73:621–630. doi: 10.1002/bip.20009. [DOI] [PubMed] [Google Scholar]
- 22.Tweeddale ME, et al. The presence of clonogenic cells in high-grade malignant lymphoma: a prognostic factor. Blood. 1987;69:1307–1314. [PubMed] [Google Scholar]
- 23.Fantini MC, et al. Cutting edge: TGF-β induces a regulatory phenotype in CD4+CD25− T cells through Foxp3 induction and down-regulation of Smad7. J Immunol. 2004;172:5149–5153. doi: 10.4049/jimmunol.172.9.5149. [DOI] [PubMed] [Google Scholar]
- 24.Bettelli E, Oukka M, Kuchroo VK. TH17 cells in the circle of immunity and autoimmunity. Nat Immunol. 2007;8:345–350. doi: 10.1038/ni0407-345. [DOI] [PubMed] [Google Scholar]
- 25.Wong J, Mathis D, Benoist C. TCR-based lineage tracing: no evidence for conversion of conventional into regulatory T cells in response to a natural self-antigen in pancreatic islets. J Exp Med. 2007;204:2039–2045. doi: 10.1084/jem.20070822. [DOI] [PMC free article] [PubMed] [Google Scholar]
- 26.Morimoto C, Schlossman SF. The structure and function of CD26 in the T-cell immune response. Immunol Rev. 1998;161:55–70. doi: 10.1111/j.1600-065x.1998.tb01571.x. [DOI] [PubMed] [Google Scholar]
- 27.Reinhold D, et al. Inhibitors of dipeptidyl peptidase IV/CD26 suppress activation of human MBP-specific CD4+ T cell clones. J Neuroimmunol. 1998;87:203–209. doi: 10.1016/s0165-5728(98)00100-3. [DOI] [PubMed] [Google Scholar]
- 28.Krakauer M, Sorensen PS, Sellebjerg F. CD4+ memory T cells with high CD26 surface expression are enriched for TH1 markers and correlate with clinical severity of multiple sclerosis. J Neuroimmunol. 2006;181:157–164. doi: 10.1016/j.jneuroim.2006.09.006. [DOI] [PubMed] [Google Scholar]
- 29.Love JC, Ronan JL, Grotenbreg GM, van der Veen AG, Ploegh HL. A microengraving method for rapid selection of single cells producing antigen-specific antibodies. Nat Biotechnol. 2006;24:703–707. doi: 10.1038/nbt1210. [DOI] [PubMed] [Google Scholar]
- 30.Michaud GA, et al. Analyzing antibody specificity with whole proteome microarrays. Nat Biotechnol. 2003;21:1509–1512. doi: 10.1038/nbt910. [DOI] [PubMed] [Google Scholar]
- 31.Tusher VG, Tibshirani R, Chu G. Significance analysis of microarrays applied to the ionizing radiation response. Proc Natl Acad Sci USA. 2001;98:5116–5121. doi: 10.1073/pnas.091062498. [DOI] [PMC free article] [PubMed] [Google Scholar]
- 32.Saeed AI, et al. TM4: a free, open-source system for microarray data management and analysis. Biotechniques. 2003;34:374–378. doi: 10.2144/03342mt01. [DOI] [PubMed] [Google Scholar]
Associated Data
This section collects any data citations, data availability statements, or supplementary materials included in this article.