

Abstract
The Search Engine Processor (SEPro) is a tool for filtering, organizing, sharing, and displaying peptide spectrum matches. It employs a novel three-tier Bayesian approach that uses layers of spectrum, peptide, and protein logic to lead the data to converge to a single list of reliable protein identifications. SEPro is integrated into the PatternLab for proteomics environment, where an arsenal of tools for analyzing shotgun proteomic data is provided. By using the semi-labeled decoy approach for benchmarking, we show that SEPro significantly outperforms a commercially available competitor.
Keywords: quality, filtering, semi-labeled decoy approach, sharing, shotgun proteomics
Shotgun proteomics comprises a large-scale approach for analyzing complex peptide mixtures (e.g., biological fluids, cell lysates, etc.). Briefly, the strategy employs protein digestion followed by peptide chromatographic separation online with tandem mass spectrometry (MS/MS) for protein identification [1]. A typical procedure generates tens or hundreds of thousands of mass spectra to be identified by a search engine such as SEQUEST [2], ProLuCID [3], or MyriMatch [4]. As it turns out, however, MS/MS may not originate from peptide ions or carry enough information to provide a reliable peptide spectrum match (PSM). Most search engines will attempt to statistically filter out these “bad quality spectra,” but many of them are not eliminated and eventually produce PSMs. In this regard, a post-search-engine filtration tool for pinpointing reliable PSMs and organizing the results becomes necessary. Several tools for this purpose have been described in the literature; some examples are: DTASelect [5], Percolator [6], IDPicker [7], and Scaffold (Proteome Software), among others [8]. These tools can attribute probability scores to identifications [9] or perform the so-called labeled decoy approach [10]. The latter relies on searching a database containing target and labeled decoy sequences; the search scores are used to compute a discriminating function to rank PSMs and ultimately converge to a subset satisfying an acceptable false-discovery rate (FDR).
As far as we know, there are no tools that carry a powerful graphical user interface (GUI), are freely available for academic use, and are natively integrated into a potent data analysis environment. Here we describe a new tool, called the Search Engine Processor (SEPro), which can filter, organize, display annotated PSMs, and facilitate the sharing of mass spectral data. SEPro carries a GUI and is natively integrated into the PatternLab for proteomics environment [11]. PatternLab is a one-stop-shop graphical environment for analyzing shotgun proteomic data; some examples of its modules are: spectral deconvolution [12], Gene Ontology analysis [13], generation of statistical area-proportional Venn Diagrams [14], and differential expression comparisons [15]. SEPro comes accompanied by two additional modules, the FastaDBXtractor and the Regrouper. The former enables the creation of searchable databases and the latter is necessary for compiling SEPro results into PatternLab. SEPro’s current version was tailored for analyzing SEQUEST or ProLuCID results.
Briefly, SEPro filtration consists of a pre-processing step, then the Bayesian automatic filters that constitute our novel three-tier approach, and finally a post-processing step. Examples of pre-processing filters are PPM tolerance and a minimum primary score or secondary score (e.g., XCorr, ZScore, etc.). The automatic filtering step is the gist of SEPro and is explained below. Examples of post-processing filters are: PPM tolerance, establishing a minimum spectral count or a minimum number of sequence matches per protein, or even accepting only spectra that have at least a certain number of b-ions, y-ions, complementary b-y ions, among others. We note that there are two PPM tolerance filters. This is because an initial filtering with very stringent parameters could purge too many decoy identifications that might be important for the subsequent Bayesian filters to properly perform their statistical analyses.
SEPro’s three-tier Bayesian algorithm automatically filters PSMs by consecutively using automatic filters of increasing stringency and specialized logic (viz. spectrum, peptide, and protein logic, in this order). Each filter consists of two Bayesian discriminant functions, one modeling target PSMs, the other modeling labeled-decoy PSMs. This enables the system to attribute a Bayesian score, henceforth called BayesS and given by gtarget(x̀) − glabeledDecoy(x̀), to each PSM’s belonging to the target class, and to ultimately converge to a subset of PSMs satisfying an acceptable FDR. Formally, the Bayesian discriminant function for PSM x̀ is
where, for class i, Pi is the prior probability (assumed to be 0.5 for the problem at hand), is the mean vector of the training matrix, Σi is the covariance matrix, |Σi| its determinant, and its inverse.
The automatic filters work as follows. First, PSMs can be subdivided into up to nine groups, corresponding to the combinations of charges +1, +2, or ≥+3, and fully tryptic, semi-tryptic, or non-tryptic. For cases presenting a limited number of spectra or of labeled decoys, SEPro will automatically suggest subdividing the data into fewer groups (e.g., only according to the tryptic status). The first tier works at the spectral level. For each group, the algorithm maps each PSM onto a 6-dimensional feature space according to the search engine’s primary score, secondary score, Delta CN, Delta Mass, number of peaks matched, and secondary rank. Each dimension is normalized to have values range from 0 to 1. Then BayesS scores are attributed to each PSM and used to sort PSMs in nondecreasing order, after which a cutoff score is determined so that the FDR established for the spectral level is satisfied. The second tier, at the peptide level, operates on the set of reliably identified PSMs obtained from the first filter. The peptide filter groups the PSMs that share the same peptide sequence (a peptide group). Each peptide group is then mapped onto the feature space based on features from the group’s highest-BayesS PSM and an extra feature, namely its spectral count, so that the problem is now 7-dimensional. The filtration for this level proceeds as for the first level. Finally, the last filtration tier works at the protein level by grouping all peptide groups into protein groups. Each protein group is mapped onto the feature space according to the features of its best peptide group (i.e., the one with the highest BayesS), which now include the group’s sequence count (i.e., number of peptides with different sequences) and coverage (therefore two additional dimensions). Filtration is then carried out as for the previous two levels. The SEPro GUI allows one to follow the details regarding how many spectra are purged at each step of the process. This is illustrated in Figure 1.
Figure 1.
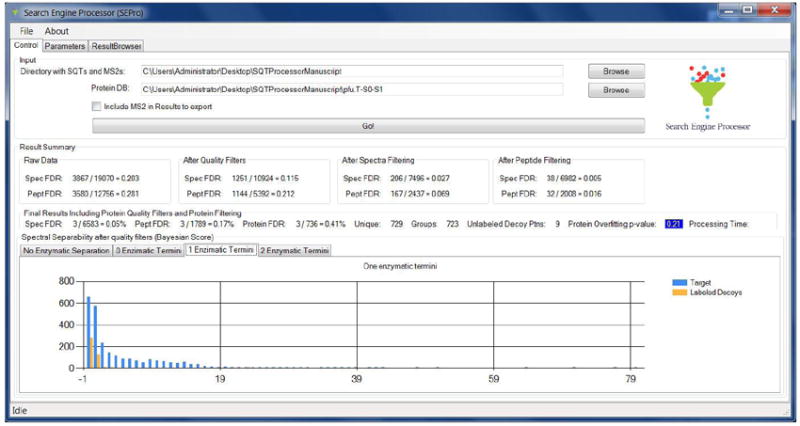
SEPro’s GUI contains three main tabs: Control, Parameters, and Results Browser. The Control tab is shown here and displays a summary of the FDR values after each filtration step. Spec FDR and Pept FDR stand for spectral and peptide FDR, respectively. The histogram at the bottom shows the distribution of BayesS for semi-tryptic peptides. The protein overfitting p-value is highlighted in blue, indicating that the solution is acceptable and thus no further post-processing filters need to be applied.
Among existing filtration tools, Scaffold is probably one of the most widely adopted, maybe because of its outstanding GUI. This makes it simple to use and offers several advantages, such as enabling spectral-annotation views. It is also Gene-Ontology-analysis capable [16] and designed to perform other simple analyses (e.g., Venn Diagrams). Moreover, in our evaluation Scaffold has performed robustly in the sense of not producing overfitting (results not shown), so we have chosen it as the standard against which to benchmark our approach.
We benchmarked SEPro in comparison to Scaffold (v. 3.1.4.1) on a Pyrococcus furiosus (PFU) lysate dataset and on a mouse embryonic fibroblast dataset, both acquired using an Orbitrap XL (Thermo, San Jose, CA) under conditions as described in the literature [1]. These datasets are available for download [17,18]. Briefly, they were generated using two-dimensional liquid chromatography separation and tandem mass spectrometry using an Orbitrap XL set to the data-dependent acquisition mode with dynamic exclusion turned on. The XCalibur data system was used to control the mass spectrometer scan functions and HPLC solvent gradients; 12 salt steps were performed. We used ProLuCID to search these spectra against sequence databases prepared using SEPro’s FastaDBXtractor. Briefly, the search was limited to fully and semi-tryptic peptide candidates, imposed carbamidomethylation as a fixed modification, and accepted peptide candidates within a 100-ppm range; the primary search engine score was the XCorr. The sequence databases for searching are available for download with the accompanying files as described at the end of this manuscript; briefly, they include the target sequences of the respective organisms, plus 127 common contaminants, and two further decoy sequences added by FastaDBXtractor for each target sequence, one tagged as MiddleReversed (labeled decoy) and the other as PairReversed (unlabeled decoy).
We note that the use of what we have called labeled and unlabeled decoys comes from a previous study in which we demonstrated that it can be easy to obtain boosted numbers of identifications under a given FDR [17]. Such numbers, however, do not necessarily represent the underlying truth and could wrongly favor a given filtration tool. In the same study we created the semi-labeled decoy approach as a means to help avoid this potential drawback and properly benchmark filtration tools such as for the task at hand. It relies on introducing decoys that are unknown to the discriminating function (the unlabeled decoys) and thereby allows a classification model to be statistically evaluated with regard to overfitting [17]. The labeled decoys are used for generating the discriminating function.
Following the use of ProLuCID, we then filtered the search results using both SEPro and Scaffold. For the PFU dataset, we report the results for both tools by accepting one peptide per protein. As the mouse dataset is much more complex, we also report the results as follows: for Scaffold, only proteins with two or more peptides, and for SEPro, only proteins identified by two evidences (i.e., the same peptide in different charge states; two spectral counts of the same peptide in the same charge state were not considered). The remaining SEPro filtering parameters were set to default values. We remark that SEPro allows the spectrum, peptide, and protein FDRs to be set beforehand, in contrast with other tools that adopt the guessing of parameters to obtain the desired FDR. Further details on the SEPro filtration parameters are provided in its filtration results file, which is made available as described at the end of this manuscript. The Scaffold analysis was performed using the high mass accuracy scoring and the MudPIT setup; its probability filters imposed a protein and peptide confidence level of 99 and 95%, respectively. The identification benchmarks are found in Table I. According to the semi-labeled decoy approach the results from either tool were not overfit. SEPro was significantly faster than Scaffold when benchmarked on our server featuring two Intel Xeon “Nehalem” processors running at 2.8 GHz; while Scaffold took some 30 minutes, SEPro took less than 7 minutes on both datasets. The protein counting reported by SEPro comes from using the maximum parsimony strategy as previously described [7].
Table I. Comparison of SEPro and Scaffold results.
Scaffold parameters were a 99% confidence level for proteins, 95% for peptides, and considering the high mass accuracy in the score. The Spectra, Peptides and Proteins columns indicate the numbers of spectra, peptide, and proteins identified after filtration, respectively. The numbers in parentheses in the Peptides and Proteins columns stand, respectively, for the number of peptides mapping to labeled decoys and the protein FDR according to the labeled decoys. LD and UD stand for labeled and unlabeled decoys, respectively. The corresponding columns inform how many of the proteins identified after filtration contain decoys in each category. S1, S2, P1, and P2 stand for the post processing filters applied to the final result: S1 for proteins supported by one or more evidences, S2 by two or more, P1 by one or more peptides, and P2 by two or more. S1 and P1 are equivalent.
| Spectra | Peptides | Proteins | LD | UD | |
|---|---|---|---|---|---|
| SEPro PFU (S1) | 103,823 | 17,919 (22) | 1,342 (0.98%) | 13 | 15 |
| Scaffold PFU (P1) | 88,375 | 15,504 (37) | 1,051 (2%) | 25 | 20 |
| SEPro Mouse (S1) | 29,280 | 12,845 (41) | 3,338 (1.9%) | 64 | 67 |
| Scaffold Mouse (P1) | 29,592 | 12,389 (246) | 2,569 (5%) | 125 | 141 |
| SEPro Mouse (S2) | 28,790 | 11,993 (7) | 2,255 (0.2%) | 6 | 5 |
| Scaffold Mouse (P2) | 29,085 | 11,944 (174) | 2,125 (2%) | 42 | 33 |
Figure 2 shows SEPro’s Results Browser, which presents a table that can be sorted by scores according to user preference and offers a search tool as well as many visualization options. Examples are the Protein View, the Peptide View, and the Spectral View. The first of these lists the proteins and double-clicking on a protein result allows one to view the FASTA sequence with the corresponding identified peptides highlighted in blue (Figure 2, top panel). It is also possible to detail the information on the identified peptides according to each scan. By double-clicking on a PSM line one can see the automatically annotated spectrum (Figure 2, bottom panel). The results can be saved in SEPro format, making all this information instantly available to any collaborator as SEPro is freely available to academics. Peptide View and Spectral View group results by peptides and spectra, respectively. The results can also be exported to the DTASelect-filtered text format, copied and pasted into some spreadsheet software, or made available to the PatternLab for proteomics software using SEPro’s Regrouper module.
Figure 2.
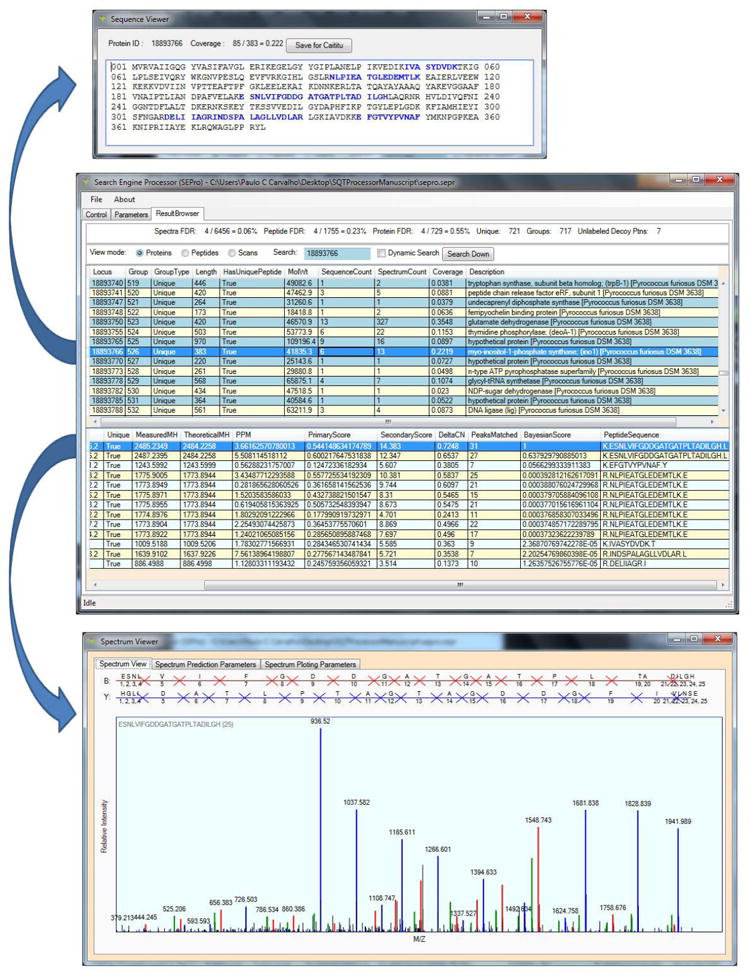
SEPro’s Results Browser. The Results Browser (middle panel) provides the flexibility and tools to maximize the experience in exploring and sharing the results. For example, by double-clicking on a protein identification one can view its FASTA sequence and the identified peptides highlighted in blue (top panel). By double-clicking on a PSM the annotated spectra will pop up (bottom panel); blue, red, and green peaks indicate y, b, and neutral loss ions, respectively.
SEPro provides a powerful algorithm for pinpointing reliable spectral identifications and is tailored to work using a semi-labeled decoy approach to ensure trustworthy FDRs. That is, by informing the label of the unlabeled decoys, SEPro can statistically estimate whether a result is overfit [17]. That said, including unlabeled decoys in the search database can help ensure a reliable result while negligibly compromising sensitivity. We recommend always using this procedure; however, if computational resources are limited, it can be used only when testing new parameters or searching a new sequence database for the first time. We also recommend using a post-processing filter; examples are only accepting proteins with two or more spectral counts, peptides, or states. The latter, used by SEPro in the mouse dataset, is a sophisticated post-processing filter that works as follows: if set to two states, SEPro will only accept proteins identified with two peptides, or the same peptide but identified with two different charge states, or a modified and unmodified peptide (e.g., oxidation of Methionine) or a combination of these options. Some proteomic tools take advantage of this feature [9,19].
In all, SEPro is simple to use and proved to be able to identify more spectra under a lower FDR in significantly less time when compared to a competing algorithm under the semi-labeled decoy approach. Instructions for downloading SEPro and its accompanying modules are available from http://pcarvalho.com/patternlab/sepro.shtml. The ProLuCID search results (i.e., the .sqt files), search parameters (i.e., search.xml), search database, and SEPro and Scaffold results are available from http://max.ioc.fiocruz.br/pcarvalho/sepromanuscript. The raw mass spectra are available from http://fields.scripps.edu/published/fdroverfitting2011 and http://fields.scripps.edu/published/chemistry_biology_2011/, as in previous works [17,18].
Acknowledgments
Support for this work was provided by grants from Coordenação de Aperfeiçoamento de Pessoal de Nível Superior (CAPES-Fiocruz 30/2006), The Fiocruz Center for Technological Development in Health (CDTS), Programa de Desenvolvimento Tecnológico em Insumos para Saúde (PDTIS-Fiocruz), Conselho Nacional de Desenvolvimento Científico e Tecnológico (CNPq), BBP grants from Fundação Carlos Chagas Filho de Amparo à Pesquisa do Estado do Rio de Janeiro, National Institutes of Health (NIH R01 MH067880 and P41 RR011823). We thank Toni Koller from the Stony Brook University Proteomics Center and Gabriel Araujo from the Laboratory for Protein Chemistry of the Federal University of Rio de Janeiro for helping test the software and providing valuable suggestions.
Footnotes
The authors declare no conflicts of interest.
Publisher's Disclaimer: This article has been accepted for publication and undergone full peer review but has not been through the copyediting, typesetting, pagination and proofreading process which may lead to differences between this version and the Version of Record.
Reference List
- 1.Washburn MP, Ulaszek R, Deciu C, Schieltz DM, Yates JR., III Analysis of quantitative proteomic data generated via multidimensional protein identification technology. Anal Chem. 2002;74:1650–1657. doi: 10.1021/ac015704l. [DOI] [PubMed] [Google Scholar]
- 2.Eng JK, L McCormack A, Yates Yates JR., III An Approach to Correlate Tandem Mass Spectral Data of Peptides with Amino Acid Sequences in a Protein Database. J Am Soc Mass Spectrom. 1994;5:976–989. doi: 10.1016/1044-0305(94)80016-2. [DOI] [PubMed] [Google Scholar]
- 3.Xu T, Venable JD, Park SK, Cociorva D, Lu B, Liao L, et al. ProLuCID, a fast and sensitive tandem mass spectra-based protein identification program. Mol Cell Proteomics. 2006;5:S 174. [Google Scholar]
- 4.Tabb DL, Fernando CG, Chambers MC. MyriMatch: highly accurate tandem mass spectral peptide identification by multivariate hypergeometric analysis. J Proteome Res. 2007;6:654–661. doi: 10.1021/pr0604054. [DOI] [PMC free article] [PubMed] [Google Scholar]
- 5.Cociorva D, Tabb L, Yates JR. Validation of tandem mass spectrometry database search results using DTASelect. Curr Protoc Bioinformatics. 2007;Chapter 13 doi: 10.1002/0471250953.bi1304s16. Unit. [DOI] [PubMed] [Google Scholar]
- 6.Kall L, Canterbury JD, Weston J, Noble WS, MacCoss MJ. Semi-supervised learning for peptide identification from shotgun proteomics datasets. Nat Methods. 2007;4:923–925. doi: 10.1038/nmeth1113. [DOI] [PubMed] [Google Scholar]
- 7.Ma ZQ, Dasari S, Chambers MC, Litton MD, Sobecki SM, Zimmerman LJ, et al. IDPicker 2.0: Improved protein assembly with high discrimination peptide identification filtering. J Proteome Res. 2009;8:3872–3881. doi: 10.1021/pr900360j. [DOI] [PMC free article] [PubMed] [Google Scholar]
- 8.Deutsch EW, Lam H, Aebersold R. Data analysis and bioinformatics tools for tandem mass spectrometry in proteomics. Physiol Genomics. 2008;33:18–25. doi: 10.1152/physiolgenomics.00298.2007. [DOI] [PubMed] [Google Scholar]
- 9.Keller A, Nesvizhskii AI, Kolker E, Aebersold R. Empirical statistical model to estimate the accuracy of peptide identifications made by MS/MS and database search. Anal Chem. 2002;74:5383–5392. doi: 10.1021/ac025747h. [DOI] [PubMed] [Google Scholar]
- 10.Peng J, Elias JE, Thoreen CC, Licklider LJ, Gygi SP. Evaluation of multidimensional chromatography coupled with tandem mass spectrometry (LC/LC-MS/MS) for large-scale protein analysis: the yeast proteome. J Proteome Res. 2003;2:43–50. doi: 10.1021/pr025556v. [DOI] [PubMed] [Google Scholar]
- 11.Carvalho PC, Fischer JS, Chen EI, Yates JR, III, Barbosa VC. PatternLab for proteomics: a tool for differential shotgun proteomics. BMC Bioinformatics. 2008;9:316. doi: 10.1186/1471-2105-9-316. [DOI] [PMC free article] [PubMed] [Google Scholar]
- 12.Carvalho PC, Xu T, Han X, Cociorva D, Barbosa VC, Yates JR., III YADA: A tool for taking the most out of high-resolution spectra. Bioinformatics. 2009 doi: 10.1093/bioinformatics/btp489. [DOI] [PMC free article] [PubMed] [Google Scholar]
- 13.Carvalho PC, Fischer JS, Chen EI, Domont GB, Carvalho MG, Degrave WM, et al. GO Explorer: A gene-ontology tool to aid in the interpretation of shotgun proteomics data. Proteome Sci. 2009;7:6. doi: 10.1186/1477-5956-7-6. [DOI] [PMC free article] [PubMed] [Google Scholar]
- 14.Carvalho PC, Fischer JS, Perales J, Yates JR, Barbosa VC, Bareinboim E. Analyzing marginal cases in differential shotgun proteomics. Bioinformatics. 2011;27:275–276. doi: 10.1093/bioinformatics/btq632. [DOI] [PMC free article] [PubMed] [Google Scholar]
- 15.Carvalho PC, Yates I, Jr, Barbosa VC. Analyzing shotgun proteomic data with PatternLab for proteomics. Curr Protoc Bioinformatics. 2010;Chapter 13:Unit-15. doi: 10.1002/0471250953.bi1313s30. [DOI] [PMC free article] [PubMed] [Google Scholar]
- 16.Ashburner M, Ball CA, Blake JA, Botstein D, Butler H, Cherry JM, et al. Gene ontology: tool for the unification of biology. The Gene Ontology Consortium. Nat Genet. 2000;25:25–29. doi: 10.1038/75556. [DOI] [PMC free article] [PubMed] [Google Scholar]
- 17.Barboza R, Cociorva D, Xu T, Barbosa VC, Perales J, Valente RH, et al. Can the false-discovery rate be misleading? Proteomics. 2011;11:4105–4108. doi: 10.1002/pmic.201100297. [DOI] [PMC free article] [PubMed] [Google Scholar]
- 18.Saha S, Wong CC, Xu T, Namgoong S, Zebroski H, Yates JR, III, et al. Arginylation and Methylation Double Up to Regulate Nuclear Proteins and Nuclear Architecture In Vivo. Chemistry & Biology. 2011;18:1369–1378. doi: 10.1016/j.chembiol.2011.08.019. [DOI] [PMC free article] [PubMed] [Google Scholar]
- 19.Nesvizhskii AI, Keller A, Kolker E, Aebersold R. A statistical model for identifying proteins by tandem mass spectrometry. Anal Chem. 2003;75:4646–4658. doi: 10.1021/ac0341261. [DOI] [PubMed] [Google Scholar]