

Abstract
It is well established that leptin regulates energy balance largely through isoform B leptin receptor-expressing neurons (LepR neurons) in the brain and that leptin activates one subset of LepR neurons (leptin-excited neurons) while inhibiting the other (leptin-inhibited neurons). However, the neurotransmitters released from LepR neurons that mediate leptin action in the brain are not well understood. Previous results demonstrate that leptin mainly acts on γ-aminobutyric acid (GABA)ergic neurons to reduce body weight, and that leptin activates proopiomelanocortin neuron activity by reducing GABA release onto these neurons, suggesting a body weight-promoting role for GABA released from leptin-inhibited neurons. To directly examine the role of GABA release from LepR neurons in body weight regulation, mice with disruption of GABA release specifically from LepR neurons were generated by deletion of vesicular GABA transporter in LepR neurons. Interestingly, these mice developed mild obesity on chow diet and were sensitive to diet-induced obesity, which were associated with higher food intake and lower energy expenditure. Moreover, these mice showed blunted responses in both food intake and body weight to acute leptin administration. These results demonstrate that GABA plays an important role in mediating leptin action. In combination with the previous studies that leptin reduces GABA release onto proopiomelanocortin neurons through leptin-inhibited neurons and that disruption of GABA release from agouti gene-related protein neurons, one subset of LepR-inhibited neurons, leads to a lean phenotype, our results suggest that, under our experimental conditions, GABA release from leptin-excited neuron dominates over leptin-inhibited ones.
The current obesity epidemic and lack of effective therapeutic strategies to treat and cure obesity signify the urgent need to understand the mechanisms underlying obesity development. Body weight homeostasis is maintained by balanced energy intake and energy expenditure, and obesity arises when energy intake exceeds energy expenditure (1). Leptin, secreted in proportion to the mass of adipose tissues, is critical for energy balance (2–4). Leptin action is primarily mediated by isoform B leptin receptor (LepR) expressed in the brain (5). The brain neurons that express LepR (LepR neurons) reside predominantly in the hypothalamus (6) but also in other brain regions such as brain stem nuclei, ventral tegmental area, and dorsal raphe (7–11). Within the hypothalamus, LepR are particularly abundant in the arcuate nucleus (Arc) but are also expressed in the ventromedial hypothalamus (VMH), dorsomedial hypothalamus (DMH), ventral premammillary, preoptic area, and lateral hypothalamus (LH) (7, 8). Thus, leptin action is mediated by multiple groups of both hypothalamic and extrahypothalamic neurons (8–9). Interestingly, leptin directly activates groups of LepR neurons such as proopiomelanocortin (POMC) neurons in the Arc and a subset of neurons in the VMH while inhibiting other groups of LepR neurons such as agouti gene-related protein (AgRP) neurons in the Arc (12).
Despite the proven importance of leptin in body weight regulation, the neural pathways that mediate leptin action remain elusive. Extensive studies were focused on selected groups of LepR neurons with known transcription markers, including POMC, AgRP, neuropeptide Y (NPY), and steroidogenic factor 1 (12–16). However, evolving studies suggest that these neurons only account for a small fraction of total LepR neurons and mediate limited leptin action on body weight regulation (15–17), indicating the importance of those LepR neurons with unknown transcription markers. Within the leptin neural pathways, the neurotransmission between the first-order (LepR neurons) and second-order neurons is less understood. Research has been focused on the role of neuropeptides, including α-MSH, AgRP, and NPY, from selected subsets of LepR neurons that express these neuropeptides (12, 18–20). However, the identity and function of neurotransmitter released from LepR neurons with unknown transcription markers remain unclear. LepR in γ-aminobutyric acid (GABA)ergic neurons mediate a major part of leptin role on body weight regulation (17), suggesting an important role for GABA release in mediating leptin action. However, the extent to which GABA released from GABAergic LepR neurons mediates leptin action on body weight regulation is unknown.
This study was designed to specifically examine the role of GABA release from GABAergic LepR neurons by generating mice with disruption of GABA release from LepR neurons.
Materials and Methods
Experimental animals
Generation of LepR-Ires-Cre mice and floxed vesicular GABA transporter (Vgatflox/flox) mice was described previously (21, 22). Study subjects were generated by mating LepR-Ires-Cre:Vgatflox/+ mice with Vgatflox/flox mice, from which LepR-Ires-Cre:Vgatflox/flox mice and both of their littermate control groups, Vgatflox/flox and LepR-Ires-Cre:Vgatflox/+ mice, were generated. Because mice heterozygous for Vgat exhibit a normal phenotype (23), LepR-Ires-Cre:Vgatflox/+ mice were used as a separate control group to eliminate potential metabolic defects from Cre expression alone in LepR-Ires-Cre mice. Because study subjects are littermates, potential genetic variation will be equally distributed to study groups. To visualize Leptin-Ires-Cre expression, Leptin-Ires-Cre mice were crossed with B6.Cg-Gt(ROSA)26Sortm9(CAG-tdTomato)Hze/J mice (Ai9 mice; The Jackson Laboratory, Bar Harbor, ME) to generate LepR-Ires-Cre:Ai9 mice, in which Cre expression can be directly visualized by tdTomato, a variant red fluorescence protein, under fluorescent microscopes (24). Mice were housed at 22 C–24 C with a 12-h light, 12-h dark cycle with food and water provided ad libitum. For glucose tolerance tests (GTT), glucose (2 g/kg) was injected ip in overnight fasted body weight-matched genotypes, and tail vein glucose levels were measured at time points 0, 15, 30, 60, and 120 min after injection. All animals and procedures were approved by the animal welfare committee of the University of Texas Health Science Center at Houston.
Body weight studies
Weekly body weight was monitored in controls and LepR-Ires-Cre:Vgatflox/flox mice fed standard mouse chow (Teklad F6 Rodent Diet 8664; Harlan Teklad, Madison, WI) from 4 to 20 wk of age. For the high-fat diet (HFD) study, a separate cohort of these mice were switched from chow diet to high-fat, high-sucrose diet (D12331 from Research Diets, New Brunswick, NJ) from 6 wk of age and maintained on HFD for 20 wk. Body weight was monitored weekly. Body composition was measured at indicated times using an Echo-MRI machine.
Energy expenditure and food intake measurements
Energy expenditure was measured by oxygen consumption by indirect calorimetry. Individual housed mice maintained on chow diet at 8 wk of age were placed at room temperature (22 C–24 C) in chambers of a Comprehensive Lab Animal Monitoring System (CLAMS; Columbus Instruments, Columbus, OH). Because no body weight/composition difference was found between genotypes, we normalized oxygen consumption to total body weight. Food and water were provided ad libitum. Mice were acclimated in the chambers for 48 h before data collection. Daily food intake was measured for 1 wk for mice that had been individually housed for at least 1 wk on either chow or HFD. Accumulated food intake was calculated from averaged daily food intake.
Immunohistochemistry assays
For vesicular GABA transporter protein (VGAT) and GABA immunohistochemistry, free-floating sections were rinsed with PBS (pH 7.4) containing 0.1% Triton X-100 for 30 min, followed by the blocking in PBS containing 5% normal goat serum (Thermo Scientific, Rockford, IL) and 0.3% Triton X-100 for 1 h at room temperature. The sections were then incubated with polyclonal rabbit anti-VGAT (1:200; Frontier Institute, Hokkaido, Japan), and polyclonal rabbit anti-GABA (1:500; Immunostar, Hudson, WI) in PBS containing 2% normal goat serum and 0.2% Triton X-100 overnight at 4 C, respectively. For p-STAT3 (signal transducer and activator of transcription 3) detection, mice were ip injected with leptin (A.F. Parlow, National Hormone and Peptide Program, Torrance, CA; 2 μg/g body weight) after 24 h fasting and were perfused 45 min later. Brain sections were pretreated with 1% NaOH and 1% H2O2 (20 min), 0.3% glycine (10 min), and 0.03% sodium dodecyl sulfate (10 min). The sections were then incubated with phosphor-specific-(Tyr705) STAT3 rabbit antiserum in PBS (1:1000; Cell Signaling Technology, Danvers, MA) containing 2% normal goat serum and 0.2% Triton X-100 overnight at 4 C. Alexa fluor 488 conjugated donkey antirabbit IgG (1:100; Invitrogen, Carlsbad, CA) was used to detect the primary antibodies. Sections were visualized and photographed with a TCS SP5 confocal microscope (Leica, Nussloch, Germany). The pictures were then converted to grayscale in Photoshop. To quantify cell numbers, in each mouse (n = 3), three sections at corresponding rostrocaudal levels (Bregma −1.46, −1.94, and −2.30) were chosen. All immunoreactive cells with clear profile were counted, and the numbers from all animals were summed and then averaged as the number per section.
In situ hybridization studies
The digoxigenin-labeled cRNA probes were prepared, and the in situ hybridizations were performed as previously described with modification (25). Briefly, free-floating brain sections were rinsed with diethylpyrocarbonate-treated PBS, pH 7.0, for 30 min before being fixed with 4% paraformaldehyde (Sigma, St. Louis, MO) in diethylpyrocarbonate-PBS for 30 min. Tissues were then incubated with 3% H2O2 and then treated with proteinase K (2 μg/ml; Roche Applied Bioscience, Indianapolis, IN). After the fixation in 4% paraformaldehyde, the sections were briefly rinsed in 0.1 m triethanolamine-HCl, pH 8.0. Then cRNA probes were diluted to 500 ng/ml with the hybridization buffer and applied to the tissues for overnight at 60 C. Sections were then treated with 0.3% Triton X-100, 0.15 m NaCl, 100 mm Tris-HCl, pH 7.5 (TNT buffer) for 10 min. After 1 h blocking in 5% normal sheep serum in TNT buffer, tissues were incubated with antidigoxigenin antibody (1:200, Fab fragment; Roche Applied Bioscience) conjugated with horseradish peroxidase overnight at 4 C. Probes were visualized with tyramide signal amplification kit (PerkinElmer, Inc., Wellesley, MA) after three thorough washes in TNT buffer.
Quantitative PCR assay
RNA was extracted from hypothalamic tissues, micro-punched from mice, using the Trizol Reagent (Invitrogen) and was reverse transcribed with RETROscript (Ambion, Inc., Austin, TX) and amplified using SYBR green technology (Bio-Rad Laboratories, Inc., Hercules, CA). The primers for POMC are as follows: 5′-AGAACGCCATCATCAAGAAC-3′and 5′-AAGAGGCTAGAGGTCATCAG-3′; for AgRP, 5′-GCGGAGGTGCTAGATCCACAGAA-3′ and 5′-AGGACTCGTGCAGCCTTACAC-3′; for NPY, 5′-GTGGATCTCTTCTCTCACAGAGG-3′ and 5′-GCCCAAACACACGAGCAGAG-3′. Assays were linear over 5 orders of magnitude.
Leptin effects on body weight and food intake
A protocol similar to the previously described was used for this study (26). Briefly, male Vgatflox/flox mice and LepR-Ires-Cre:Vgatflox/flox mice (n = 6–8 each, 10 wk old) were individually housed and acclimated by handling for 1 wk. These mice were then administered saline ip (PBS, pH 7.9) or leptin (2 μg/g/injection, 0700 h and 1900 h) every 12 h for 3 d. Body weight and food intake at baseline and those on each day with saline or leptin injections were measured. Body weight and food intake at baseline were averaged and used to calculate percent changes.
Statistical analyses
Data sets were presented at mean ± sem and analyzed for statistical significance using PRISM (GraphPad Software, Inc., San Diego, CA) for two-tailed unpaired Student's t tests, or for ANOVA tests using Tukey's multiple comparison test.. A P value of <0.05 was required for significance.
Results
Consistent with previous results, LepR-Ires-Cre mice exhibited Cre activity that mirrors the expression of LepR (8, 27). The majority of the expression was observed in the hypothalamus, including the Arc, VMH, DMH, and LH (Fig. 1A), but also in the ventral premammillary (data not shown). In control Vgatflox/flox mice, Vgat expression was abundant in the Arc, DMH, and LH (Fig. 1B, arrows). However, in LepR-Ires-Cre:Vgatflox/flox mice, Vgat mRNA signal was dramatically reduced in the Arc, DMH, and LH (Fig. 1C). Notably Vgat mRNA remains in the junctional region between DMH and LH (arrow in Fig. 1C), which is consistent with absence of LepR-Ires-Cre expression in this region (Fig. 1A). In micrographs with higher magnification, numerous neurons in the Arc showed strong in situ hybridization signal in controls (arrows in Fig. 1D). However, in LepR-Ires-Cre:Vgatflox/flox mice, the in situ signal was only seen in a few neurons (Fig. 1E, arrows). These results suggest that most GABAergic neurons in the Arc, DMH, and LH express LepR.
Fig. 1.

Deletion of Vgat in LepR neurons. A, LepR neurons were mainly found in the hypothalamus, including the Arc, VMH, DMH, and LH, as shown by Cre-dependent expression of tdTomato in LepR-Ires-CreRosa26-tdTomato reporter mice. B, In situ hybridization showed that Vgat mRNA were detected in numerous neurons in the Arc, DMH, and LH of Vgatflox/flox mice (arrows). C, Vgat mRNA were only detected in a limited number of neurons, mostly in the junctional region between DMH and LH of LepR-Ires-Cre:Vgatflox/flox mice (arrow). D, In micrographs with higher magnification, numerous neurons in the Arc of Vgatflox/flox mice expressed Vgat (arrows). E, Only a few neurons retained Vgat expression in LepR-Ires-Cre:Vgatflox/flox mice in the same region shown in panel D (arrows). F, In the cortex a subset of neurons showed reporter expression in LepR-Ires-Cre mice. G, Vgat mRNA expression patterns in the cortex of Vgatflox/flox mice. H, Vgat mRNA expression patterns in the cortex of LepR-Ires-Cre:Vgatflox/flox mice. 3V, The third ventricle. Scale bars, 100 μm.
We also compared Vgat mRNA expression in extrahypothalamic sites where LepR is expressed, and there were no significant changes in Vgat expression. For example, in the cortex, as previously shown (7, 28), LepR-Ires-Cre was expressed in scattered neurons (Fig. 1F, arrow). Vgat expression patterns in control mice (Fig. 1G, arrows) and in LepR-Ires-Cre:Vgatflox/flox mice (Fig. 1H, arrows) appeared to be indistinguishable, suggesting that LepR neurons in the cortex are not GABAergic, or that there are a negligible number of neurons with deletion of Vgat.
VGAT protein is mainly located in presynaptic vesicular membranes, and as a result, VGAT immunoreactivity is predominantly found in synapse-resembling punctate structures, but not in those structures resembling soma (29). In controls, numerous VGAT-positive puncta were found in the Arc, VMH, and median eminence (ME) (Fig 2A), and also in the DMH (Supplemental Fig. 1 published on The Endocrine Society's Journals Online web site at http://endo.endojournals.org). In comparison, VGAT immunoreactivity was dramatically reduced in the Arc and VMH, but remained the same in the ME of LepR-Ires-Cre: Vgatflox/flox mice (Fig. 2B). We also observed a reduction in VGAT immunoreactivity in the DMH (Supplemental Fig. 1) and paraventricular hypothalamus (Supplemental Fig. 2). These results suggest that Cre expression in LepR neurons effectively deleted VGAT expression in LepR-Ires-Cre:Vgatflox/flox mice.
Fig. 2.
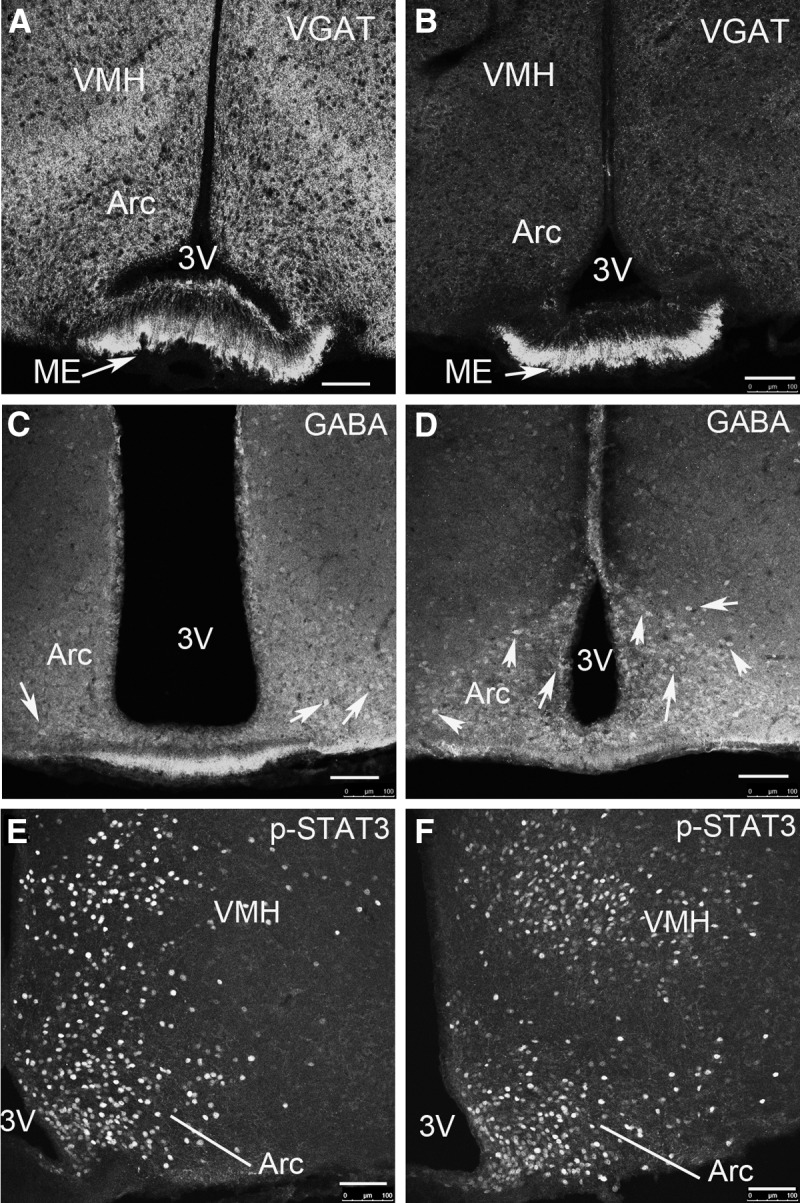
Deletion of VGAT protein in LepR neurons and its associated consequences. A, Numerous VGAT-positive punctate structures were present in the Arc, VMH, and ME of Vgatflox/flox mice. B, The punctate VGAT-positive structures were greatly reduced in the Arc and VMH but retained in the ME of LepR-Ires-Cre:Vgatflox/flox mice. C, In Vgatflox/flox mice, GABA immunoreactivity was strong in the Arc region, and a small number of soma were clearly shown with GABA immunoreactivity (arrows). D, In LepR-Ires-Cre:Vgatflox/flox mice, GABA immunoreactivity was stronger and a greater number of GABA-positive soma were visible (arrows). E and F, Leptin-induced p-STAT3 expression was performed on hypothalamic sections in Vgatflox/flox mice (E, arrows) and in LepR-Ires-Cre:Vgatflox/flox mice (F, arrows). 3V, The third ventricle. Scale bars, 100 μm.
GABAergic neurons contain high levels of GABA accumulation in cell bodies, which can be visualized by immunostaining with a specific antibody against GABA (30). Mice with VGAT deletion exhibited increased GABA accumulation in brain neurons (31). Because the vast majority of Arc GABAergic neurons express LepR, we focused on Arc neurons. In controls, we observed moderate GABA immunoreactivity across the Arc region (Fig. 2C), consistent with abundant Vgat expression in this region. In addition, a small number of GABA-positive soma were readily observable, suggesting a higher level of GABA concentration in these neurons (arrows in Fig. 2C). Strikingly, in LepR-Ires-Cre:Vgatflox/flox mice, both GABA immunoreactivity and the number of GABA-positive soma were increased (arrows in Fig. 2D). The statistical analysis based on this counting showed that LepR-Ires-Cre:Vgatflox/flox mice showed significantly greater number of GABA-positive neurons in the Arc compared with controls (number/Arc section: 73.8 ± 7.1 vs. 48.1 ± 9.1). These results are consistent with the concept that deletion of VGAT results in defective transport of GABA to vesicles, leading to increased GABA accumulation in soma in LepR-Ires-Cre:Vgatflox/flox mice. These data, together with our previous reports that deletion of Vgat in AgRP neurons results in ablation of GABA release (22), suggest that VGAT-deleted GABAergic LepR neurons are defective in releasing GABA.
To assess whether VGAT-deleted LepR neurons respond normally to leptin, we examined the response of these neurons to leptin by immunostaining p-STAT3 in the hypothalamus. With the same dose of leptin administration, both controls (Fig. 2E) and LepR-Ires-Cre:Vgatflox/flox mice (Fig. 2F) exhibited similar degree of pSTAT3 expression in the hypothalamus. Statistical results from counting p-STAT3-positive neurons in the hypothalamus showed no difference between genotypes (number/Arc: 321.8 ± 29.6 vs. 329.0 ± 30.2), suggesting that VGAT-deleted LepR neurons exhibit no major defects in response to leptin.
To examine whether loss of GABA release from LepR neurons leads to changes in the expression levels of POMC, AgRP, and NPY, known to be important for energy balance regulation, we compared the levels of the transcripts of these peptide genes between controls and LepR-Ires-Cre:Vgatflox/flox mice using glyceraldehyde 3-phosphate dehydrogenase as an internal control on hypothalamic tissues (Fig. 3, A–C). Interestingly, compared with controls, LepR-Ires-Cre:Vgatflox/flox mice showed increased POMC expression (Fig. 3A), but reduced expression of AgRP (Fig. 3B) and NPY (Fig. 3C), although the increment for NPY was not significant. These results suggest that these peptide-expressing neurons may be, directly or indirectly, under the control of GABA released from LepR neurons.
Fig. 3.

The expression of neuropeptides in the hypothalamus assessed by real-time PCR. The hypothalamus was punched out from LepR-Ires-Cre:Vgatflox/flox mice and Vgatflox/flox mice (n = 6 each), and real-time PCR assays were performed using specific primers for POMC (A), AgRP (B), and NPY (C). The expression levels were relative to glyceraldehyde 3-phosphate dehydrogenase. *, P < 0.05, two-tailed Student's t test.
To examine the effect of disruption of GABA release from LepR neurons, we monitored weekly body weight of LepR-Ires-Cre:Vgatflox/flox mice and both control groups fed chow diet. Compared with controls, LepR-Ires-Cre:Vgatflox/flox male mice exhibited similar body weight before 9 wk of age, but gradually gained more body weight and became significantly heavier (Fig. 4A). The difference became statistically significant only after 10 wk of age, and at the age of 18 wk, LepR-Ires-Cre:Vgatflox/flox mice were 28.2 ± 0.3 grams whereas Vgatflox/flox mice were 26.1 ± 0.4 g (n = 11–14). Interestingly, measured at the age of 7–8 wk, when Leptin-Ires-Cre:Vgatflox/flox mice showed a similar body weight to that of controls (Fig. 4A), accumulated food intake in LepR-Ires-Cre:Vgatflox/flox mice was higher than that in controls, which reached significant difference at the sixth day of the measurement (grams: 30.5 ± 3.2 vs. 24.2 ± 0.8, Fig. 4B). In females, we observed a similar body weight phenotype (Fig. 4C), and at the age of 14 wk, LepR-Ires-Cre:Vgatflox/flox mice were 21.1 ± 0.4 g whereas Vgatflox/flox mice were 19.7 ± 0.5 g (n = 7–11), which was also associated with hyperphagia (Fig. 4D). Because males and females exhibited a similar body weight phenotype, in the following experiments, we focused primarily on males.
Fig. 4.

LepR-Ires-Cre:Vgatflox/flox mice developed obesity on chow. A, Weekly body weights of LepR-Ires-Cre:Vgatflox/flox male mice fed chow diet showed increased body weight compared with both control groups (n = 11–14). *, P < 0.05, one-way ANOVA test for each week. B, Accumulated food intake assessed on singly housed males at the age of 7–8 wk showed hyperphagia in LepR-Ires-Cre:Vgatflox/flox mice (n = 8–10). *, P < 0.05, two-tailed Student's t test. C, Weekly body weights of LepR-Ires-Cre:Vgatflox/flox female mice fed chow diet showed increased body weight compared with both control groups (n = 7–11). *, P < 0.05, one-way ANOVA test for each week. D, Accumulated food intake in females at the age of 7–8 wk. *, P < 0.05, two-tailed Student's t test. E, Body composition assessed by Eco-MRI in males at the age 12 wk showed a specific increase in fat mass of LepR-Ires-Cre:Vgatflox/flox mice (n = 6). *, P < 0.05, two-tailed Student's t test. F, O2 consumption assessed in males by CLAMS (n = 7–8). G, Quantitative comparison on O2 consumption between genotypes for both light and dark cycles showed a specific reduction in O2 consumption in LepR-Ires-Cre:Vgatflox/flox mice during the dark cycle; *, P < 0.05, Student's t test. H, When measured at the age of 7–8 wk, LepR-Ires-Cre:Vgatflox/flox male mice exhibited impaired GTT compared with controls (n = 6–8), *, P < 0.05, two-tailed Student's t test.
At the age of 12 wk, compared with controls, LepR-Ires-Cre:Vgatflox/flox mice exhibited significantly higher fat mass (grams: 3.4 ± 0.4 vs. 2.1 ± 0.2) but similar lean mass (grams: 17.9 ± 0.5 vs. 18.3 ± 0.8, Fig. 4E), suggesting that these mice developed obesity. Energy expenditure, assessed by O2 consumption at the age of 7 wk (n = 7–8 males), showed that LepR-Ires-Cre:Vgatflox/flox mice consumed significantly less O2 during the dark period (milliliters/kg/h: 4295 ± 57 vs. 4539 ± 65) but similar amount of O2 during the light period (milliliters/kg/h: 3621 ± 150 vs. 3707 ± 57, Fig. 4, F and G), suggesting that disruption of GABA release from LepR neurons leads to reduced energy expenditure, especially during the dark period. Taken together, these results demonstrate that LepR-Ires-Cre:Vgatflox/flox mice develop mild obesity as a result of increased food intake and reduced energy expenditure. In addition, when GTT were performed at 7–8 wk of age (n = 6–8, males), when no body weight difference existed between genotypes, LepR-Ires-Cre:Vgatflox/flox mice exhibited impaired GTT (Fig. 4H), suggesting an involvement of GABA in mediating central action of leptin on glucose homeostasis.
To examine whether GABA release from LepR neurons is required for leptin action on food intake and body weight, we monitored food intake and body weight of LepR-Ires-Cre:Vgatflox/flox mice in response to acute administration of leptin. Saline treatment produced no effects on either food intake (Fig. 5A) or body weight (Fig. 5B) in either genotype. As expected, leptin significantly reduced food intake (Fig. 5C) and body weight (Fig. 5D). However, the effect of leptin on food intake and body weight was significantly diminished in LepR-Ires-Cre:Vgatflox/flox mice, compared with controls (Fig. 5, C and D). On d 2, leptin reduced food intake to 70 ± 2.4% of baseline pretreatment levels and body weight to 93.8 ± 0.7% in controls while reducing food intake to 83.1 ± 3.4% and body weight to 96.3 ± 0.7% in LepR-Ires-Cre:Vgatflox/flox mice. These data demonstrate that GABA release from LepR neurons mediates leptin action on food intake and body weight regulation.
Fig. 5.

Body weight and food intake responses to leptin action. A cohort of male mice (n = 6–7 each genotype at the age of 7–8 wk) received saline treatment over 3 continuous days, followed by leptin treatment at 2 μg/g/injection over another 3 continuous days. Percentages of food intake changes over baseline pretreatment levels of Vgatflox/flox mice and LepR-Ires-Cre:Vgatflox/flox mice were shown. A and B, Responses of food intake (A) and body weight (B) to saline. C and D, Responses of food intake (C) and body weight (D) to leptin. LepR-Ires-Cre:Vgatflox/flox mice showed blunted responses in both body weight and food intake to leptin. FI, Food intake; BW, body weight. *, P < 0.05, one-way ANOVA test.
To test whether GABA release from LepR neurons regulates metabolic response to diet challenges, we measured weekly body weight of LepR-Ires-Cre:Vgatflox/flox male mice switched to HFD at 4 wk of age. Compared with both control groups, LepR-Ires-Cre:Vgatflox/flox mice exhibited significant higher body weight starting from 7 wk of age (Fig. 6A). At 16 wk of age, body weights of LepR-Ires-Cre:Vgatflox/flox mice were 33.4 ± 1.9 g whereas that of controls was 28.1 ± 1.4 g. Using a new cohort of male mice (n = 6–7 each) switched to HFD at 7 wk of age, we measure food intake and energy expenditure on HFD at 7–8 wk of age when there was no body weight difference between genotypes. The accumulated HFD intake showed significantly higher at the third day of the measurement in LepR-Ires-Cre:Vgatflox/flox mice, compared with controls (grams: 9.5 ± 0.5 vs. 7.9 ± 0.4, Fig. 6B). Consistent with the data on chow diet, O2 consumption on HFD in LepR-Ires-Cre:Vgatflox/flox mice was significantly reduced during the dark period (milliliters/kg/h: 4044 ± 160 vs. 4758 ± 210) whereas there was no difference during the light period (milliliters/kg/h: 3922 ± 250 vs. 4101 ± 120, Fig. 6, C and D). Thus, compared with chow diet, HFD induced earlier onset and greater degree of obesity in LepR-Ires-Cre:Vgatflox/flox mice, suggesting that GABA release from LepR neurons mediates resistance to diet-induced obesity through both reducing energy intake and increasing energy expenditure.
Fig. 6.

Susceptibility to diet-induced obesity in LepR-Ires-Cre:Vgatflox/flox male. A, Weekly body weight of LepR-Ires-Cre:Vgatflox/flox male mice and their littermate controls (n = 6–14) fed HFD from 4–16 wk of age. Starting at 7 wk of age, LepR-Ires-Cre:Vgatflox/flox mice were heavier than both controls; *, P < 0.05, one-way ANOVA test for each week. B, A new cohort of singly housed male mice (n = 7–9) were fed chow until 7 wk of age and then switched to HFD. Accumulated food intake on mice fed HFD measured at 7–8 wk of age showed hyperphagia in LepR-Ires-Cre:Vgatflox/floxmice. *, P < 0.05, two-tailed Student's t test. C, O2 consumption measured by CLAMS on male LepR-Ires-Cre:Vgatflox/flox mice and their controls at 6–7 wk of age (n = 5–7). D, Statistical analysis in comparison of O2 consumption showed a selective reduction in O2 consumption during the dark cycle. *, P < 0.05, two-tailed Student's t test.
Discussion
In this study, we aimed to disrupt GABA release from LepR neurons by inactivating VGAT specifically in LepR neurons. Notably, deletion of Vgat in LepR neurons results in dramatic reduction in Vgat mRNA expression in the Arc, DMH, and LH, key hypothalamic regions for energy balance regulation, suggesting that the majority of GABAergic neurons in these regions express LepR. This dramatic reduction in Vgat expression is not caused by reduced number of LepR neurons in these regions because leptin-induced p-STAT3 expression remains unchanged. This result is consistent with previous observations that leptin-responsive GABAergic neurons are largely located in the Arc, DMH, and LH (17). Strikingly, VGAT protein immunoreactivity was also dramatically reduced in the hypothalamus, especially in the Arc and VHM, whereas that in ME was largely unaltered. Because VGAT is preferentially localized in synaptic terminals and, as a result, is mainly present in the projection sites of GABAergic neurons, these results suggest that the majority of GABAergic presynaptic terminals in the Arc and VHM are of LepR neuron origin. LepR neurons send abundant projections to ME (28). The unchanged VGAT immunoreactivity in ME of LepR-Ires-Cre:Vgatflox/flox mice suggests that projections from LepR neurons to ME are largely not VGAT positive, and therefore non-GABAergic. In conclusion, these observations demonstrate that GABAergic neurons within key hypothalamic regions, including the Arc, DHM, and LH, are predominantly LepR positive, and that a significant proportion of GABAergic input to key hypothalamic regions, including the Arc and VHM, originates from LepR neurons.
Our results demonstrated that disruption of GABA release from LepR neurons results in mild obesity, which is in contrast to the previous observation that deletion of LepR in GABAergic neurons leads to massive obesity (17). Because both studies examine the function of the same group of neurons, i.e. LepR-expressing GABAergic neurons, the contrasting results cannot be explained by different groups of neurons involved in the studies. Our in situ data showed that Vgat deletion parallels LepR-Cre expression, suggesting effective Cre-mediated Vgat deletion. Because VGAT is solely responsible for vesicular accumulation of GABA for presynaptic release (23), and its deletion leads to complete loss of synaptic GABA release (22), LepR neurons with VGAT deletion lose GABA release. This view is supported by increased GABA immunoreactivity in VGAT-deleted neurons. Thus, the discrepancy cannot be explained by incomplete loss of synaptic GABA release.
The distinction between the two studies is that our study focuses on one particular neurotransmitter (GABA) whereas the previous study focuses on one particular receptor (LepR). Conceivably, in addition to GABA and LepR, LepR neurons also release other neurotransmitters and express other receptors. Thus, LepR function in GABAergic neurons can be mediated by multiple neurotransmitters including GABA, and the effect caused by disruption of GABA release from LepR neurons only partially accounts for that caused by disruption of LepR in GABAergic neurons. It is known that GABA is coreleased with neuropeptides from POMC and AgRP neurons (22, 32). Given the anorexigenic nature of neuropeptides from POMC neurons and orexigenic nature of those from AgRP neurons, if these neuropeptides mediate leptin action in the absence of GABA, one would predict that POMC expression will be increased and/or neuropeptides from AgRP neurons will be decreased. However, we observed that, in the absence of GABA release, POMC expression is reduced, and AgRP and NPY are increased. These data argue against a role for these neuropeptides in mediating leptin action in the absence of GABA release. Instead, these altered changes of neuropeptide expression explain, at least in part, the hyperphagia and increased body weight by disruption of GABA release from LepR neurons, suggesting that these neuropeptides lie downstream of GABA release from LepR neurons. It remains to be established whether other neuropeptides or neurotransmitters coreleased with GABA are important in mediating leptin action. Notably, complementary expression of Vgat and vesicular glutamate transporter 2 (a marker for glutamatergic neurons) in the hypothalamus suggests that it is unlikely that glutamate is one of the candidates (33).
One major reason underlying the discrepancy is the different modes of leptin action on LepR neurons. It is well established that leptin excites a subset of neurons (leptin-excited neurons) while inhibiting another subset of neurons (leptin-inhibited neurons) (8, 17, 34–37). Previous studies show that LepR exerts antiobesity function in both leptin-excited and -inhibited neurons, and its deletion in leptin-excited neurons (POMC neurons) and -inhibited neurons (AgRP neurons) produces an additive effect on obesity over individual groups (15). Thus, the massive obesity observed in mice with LepR deletion in GABAergic neurons represents additive effects on obesity over all LepR-expressing GABAergic neurons (17). However, neurotransmitters released from leptin-excited neurons produce anorexigenic and body weight-reducing effects whereas those from leptin-inhibited neurons produce the opposite. For example, loss of or reduced α-MSH release from POMC neurons, a well-established group of leptin-excited neurons, result in obesity (18, 38), whereas heightened function of AgRP and/or NPY from AgRP neurons, a well-established group of leptin-inhibited neurons, also results in obesity. Consistently, leptin activates POMC neurons in part by reducing GABA release onto POMC neurons through yet to be identified leptin-inhibited neurons, suggesting body weight-promoting effects of GABA release from leptin-inhibited neurons. In agreement with this, disruption of GABA release from AgRP neurons results in reduced body weight (22). So far, it is unclear what percentage of LepR neurons are activated or inhibited by leptin. It appears that there are multiple groups of leptin-excited neurons. For example, in addition to leptin-excited Arc neurons (36), the majority of neurotensin-positive neurons located in the LH, which are excited by leptin, are GABAergic (39, 40). Also multiple groups of leptin-inhibited neurons exist including AgRP neurons and the unidentified GABAergic neurons that innervate POMC neurons (17). Therefore, it is conceivable that phenotype produced by disruption of GABA release from all LepR neurons will be the net outcome of combined effects of disruption of GABA release from leptin-excited neurons (obesity-promoting effects) and that from leptin-inhibited ones (body weight-reducing effects). The obesity phenotype associated with hyperphagia and reduced energy expenditure in mice with disruption of GABA release from LepR neurons suggests that GABA release from leptin-excited neurons plays a dominant role over that from leptin-inhibited ones. This view is supported by our leptin treatment experiment in which GABA release from leptin-excited neurons will presumably be enhanced whereas that from leptin-inhibited neurons will be reduced; thus the effect of loss of GABA release from leptin-excited neurons will be greatly manifested whereas that from leptin-inhibited neurons will be negligible. Our data showed that disruption of GABA release from LepR neurons led to significantly diminished anorexigenic and body weight-reducing effects in response to exogenous leptin, highlighting the importance of GABA release from leptin-excited neurons. In addition, disruption of GABA release from LepR neurons produced more pronounced obesity on HFD than on chow diet, supporting a dominant role of GABA release from leptin-excited neurons during HFD feeding.
Given the dominant effect of leptin-excited GABAergic neurons, it is interesting to know where these neurons reside. Previous results suggest that GABAergic LepR neurons are largely located in the Arc, DMH, and LH (17). The Arc is a leading site for leptin-excited GABAergic neurons. The Arc shows the most abundant expression of LepR (7, 8). The majority of Arc neurons are GABAergic because the Arc exhibits abundant expression of markers for GABAergic neurons including glutamate acid decarboxylase and VGAT (17, 41–43), but no or little expression of markers for glutamatergic neurons such as vesicular glutamate transporters (17, 44). The majority of GABAergic neurons in the Arc are LepR positive because Vgat expression is dramatically reduced in the Arc of mice with deletion Vgat in LepR neurons (the present study), and deletion of LepR in GABAergic neurons leads to loss of pSTAT3 response to leptin action in the Arc (17). Importantly, within the Arc, it has been shown that there are more leptin-excited neurons than leptin-inhibited ones (36). Given the fact that a small percentage of POMC neurons are GABAergic (17, 32, 41), it is less likely that POMC neurons mediate the effect. This view is supported by our earlier unpublished data that specific deletion of Vgat in POMC neurons leads to a normal phenotype in body weight (data not shown). It is also highly possible that the leptin-excited GABAergic neurons are located in other sites. For example, a novel group of GABAergic LepR neurons (neither orexin nor MCH positive) in the LH mediate leptin action on body weight regulation, the majority of which are excited by leptin (34, 39).
Nonetheless, our results, in combination with previous data discussed above, suggest that leptin acts through a distributed neural network, in which leptin-excited and -inhibited neurons act in concert through altering GABA release to achieve body weight homeostasis. This conclusion is consistent with the observations by pharmacological application of GABA. Injection of GABA to the LH inhibits food intake whereas that to the paraventricular hypothalamus and DMH increases food intake (45–48). Although it remains to be tested whether these GABAergic actions are related to GABAergic LepR neurons, these observations support the concept that food intake-promoting and -inhibiting GABAergic actions coexist in the brain. These GABAergic actions may be preferentially activated during various state of hunger or satiety of the animal (49). Future studies to reveal specific neural pathway of leptin-excited or -inhibited GABAergic neurons will be import to understand the leptin pathway in the regulation of energy balance.
Supplementary Material
Acknowledgments
We thank Dr. Carol F. Elias of the University of Texas Southwestern Medical Center for providing help on in situ hybridization.
This work was supported by a Scientist Development Award from the American Heart Association (10SDG3280017), a bridge award from National Institutes of Health (DK089426), and a startup fund from the University of Texas at Houston.
Disclosure Summary: The authors have nothing to disclose.
For editorial see page 2057
- AgRP
- Agouti gene-related protein
- Arc
- arcuate nucleus
- DMH
- dorsomedial hypothalamus
- GABA
- γ-aminobutyric acid
- GTT
- glucose tolerance test
- HFD
- high-fat diet
- LepR
- leptin receptor
- LH
- lateral hypothalamus
- ME
- median eminence
- NPY
- neuropeptide Y
- POMC
- proopiomelanocortin
- STAT
- signal transducer and activator of transcription
- VGAT
- vesicular GABA transporter protein
- VMH
- ventromedial hypothalamus.
References
- 1. Spiegelman BM, Flier JS. 2001. Obesity and the regulation of energy balance. Cell 104:531–543 [DOI] [PubMed] [Google Scholar]
- 2. Schwartz MW, Woods SC, Porte D, Jr, Seeley RJ, Baskin DG. 2000. Central nervous system control of food intake. Nature 404:661–671 [DOI] [PubMed] [Google Scholar]
- 3. Myers MG, Jr, Leibel RL, Seeley RJ, Schwartz MW. 2010. Obesity and leptin resistance: distinguishing cause from effect. Trends Endocrinol Metab 21:643–651 [DOI] [PMC free article] [PubMed] [Google Scholar]
- 4. Zhang Y, Proenca R, Maffei M, Barone M, Leopold L, Friedman JM. 1994. Positional cloning of the mouse obese gene and its human homologue. Nature 372:425–432 [DOI] [PubMed] [Google Scholar]
- 5. Cohen P, Zhao C, Cai X, Montez JM, Rohani SC, Feinstein P, Mombaerts P, Friedman JM. 2001. Selective deletion of leptin receptor in neurons leads to obesity. J Clin Invest 108:1113–1121 [DOI] [PMC free article] [PubMed] [Google Scholar]
- 6. Schwartz MW, Seeley RJ, Campfield LA, Burn P, Baskin DG. 1996. Identification of targets of leptin action in rat hypothalamus. J Clin Invest 98:1101–1106 [DOI] [PMC free article] [PubMed] [Google Scholar]
- 7. Scott MM, Lachey JL, Sternson SM, Lee CE, Elias CF, Friedman JM, Elmquist JK. 2009. Leptin targets in the mouse brain. J Comp Neurol 514:518–532 [DOI] [PMC free article] [PubMed] [Google Scholar]
- 8. Myers MG, Jr, Münzberg H, Leinninger GM, Leshan RL. 2009. The geometry of leptin action in the brain: more complicated than a simple ARC. Cell Metab 9:117–123 [DOI] [PMC free article] [PubMed] [Google Scholar]
- 9. Grill HJ. 2006. Distributed neural control of energy balance: contributions from hindbrain and hypothalamus. Obesity (Silver Spring) 14 Suppl 5:216S–221S [DOI] [PubMed] [Google Scholar]
- 10. Fulton S, Pissios P, Manchon RP, Stiles L, Frank L, Pothos EN, Maratos-Flier E, Flier JS. 2006. Leptin regulation of the mesoaccumbens dopamine pathway. Neuron 51:811–822 [DOI] [PubMed] [Google Scholar]
- 11. Lam DD, Leinninger GM, Louis GW, Garfield AS, Marston OJ, Leshan RL, Scheller EL, Christensen L, Donato J, Jr, Xia J, Evans ML, Elias C, Dalley JW, Burdakov DI, Myers MG, Jr, Heisler LK. 2011. Leptin does not directly affect CNS serotonin neurons to influence appetite. Cell Metab 13:584–591 [DOI] [PMC free article] [PubMed] [Google Scholar]
- 12. Elmquist JK, Coppari R, Balthasar N, Ichinose M, Lowell BB. 2005. Identifying hypothalamic pathways controlling food intake, body weight, and glucose homeostasis. J Comp Neurol 493:63–71 [DOI] [PubMed] [Google Scholar]
- 13. Morris DL, Rui L. 2009. Recent advances in understanding leptin signaling and leptin resistance. Am J Physiol Endocrinol Metab 297:E1247–E1259 [DOI] [PMC free article] [PubMed] [Google Scholar]
- 14. van den Pol AN. 2003. Weighing the role of hypothalamic feeding neurotransmitters. Neuron 40:1059–1061 [DOI] [PubMed] [Google Scholar]
- 15. van de Wall E, Leshan R, Xu AW, Balthasar N, Coppari R, Liu SM, Jo YH, MacKenzie RG, Allison DB, Dun NJ, Elmquist J, Lowell BB, Barsh GS, de Luca C, Myers MG, Jr, Schwartz GJ, Chua SC., Jr 2008. Collective and individual functions of leptin receptor modulated neurons controlling metabolism and ingestion. Endocrinology 149:1773–1785 [DOI] [PMC free article] [PubMed] [Google Scholar]
- 16. Dhillon H, Zigman JM, Ye C, Lee CE, McGovern RA, Tang V, Kenny CD, Christiansen LM, White RD, Edelstein EA, Coppari R, Balthasar N, Cowley MA, Chua S, Jr, Elmquist JK, Lowell BB. 2006. Leptin directly activates SF1 neurons in the VMH, and this action by leptin is required for normal body-weight homeostasis. Neuron 49:191–203 [DOI] [PubMed] [Google Scholar]
- 17. Vong L, Ye C, Yang Z, Choi B, Chua S, Jr, Lowell BB. 2011. Leptin action on GABAergic neurons prevents obesity and reduces inhibitory tone to POMC neurons. Neuron 71:142–154 [DOI] [PMC free article] [PubMed] [Google Scholar]
- 18. Yaswen L, Diehl N, Brennan MB, Hochgeschwender U. 1999. Obesity in the mouse model of pro-opiomelanocortin deficiency responds to peripheral melanocortin. Nat Med 5:1066–1070 [DOI] [PubMed] [Google Scholar]
- 19. Cone RD. 2005. Anatomy and regulation of the central melanocortin system. Nat Neurosci 8:571–578 [DOI] [PubMed] [Google Scholar]
- 20. Qian S, Chen H, Weingarth D, Trumbauer ME, Novi DE, Guan X, Yu H, Shen Z, Feng Y, Frazier E, Chen A, Camacho RE, Shearman LP, Gopal-Truter S, MacNeil DJ, Van der Ploeg LH, Marsh DJ. 2002. Neither agouti-related protein nor neuropeptide Y is critically required for the regulation of energy homeostasis in mice. Mol Cell Biol 22:5027–5035 [DOI] [PMC free article] [PubMed] [Google Scholar]
- 21. Leshan RL, Opland DM, Louis GW, Leinninger GM, Patterson CM, Rhodes CJ, Münzberg H, Myers MG., Jr 2010. Ventral tegmental area leptin receptor neurons specifically project to and regulate cocaine- and amphetamine-regulated transcript neurons of the extended central amygdala. J Neurosci 30:5713–5723 [DOI] [PMC free article] [PubMed] [Google Scholar]
- 22. Tong Q, Ye CP, Jones JE, Elmquist JK, Lowell BB. 2008. Synaptic release of GABA by AgRP neurons is required for normal regulation of energy balance. Nat Neurosci 11:998–1000 [DOI] [PMC free article] [PubMed] [Google Scholar]
- 23. Wojcik SM, Katsurabayashi S, Guillemin I, Friauf E, Rosenmund C, Brose N, Rhee JS. 2006. A shared vesicular carrier allows synaptic corelease of GABA and glycine. Neuron 50:575–587 [DOI] [PubMed] [Google Scholar]
- 24. Madisen L, Zwingman TA, Sunkin SM, Oh SW, Zariwala HA, Gu H, Ng LL, Palmiter RD, Hawrylycz MJ, Jones AR, Lein ES, Zeng H. 2010. A robust and high-throughput Cre reporting and characterization system for the whole mouse brain. Nat Neurosci 13:133–140 [DOI] [PMC free article] [PubMed] [Google Scholar]
- 25. Kishi T, Aschkenasi CJ, Lee CE, Mountjoy KG, Saper CB, Elmquist JK. 2003. Expression of melanocortin 4 receptor mRNA in the central nervous system of the rat. J Comp Neurol 457:213–235 [DOI] [PubMed] [Google Scholar]
- 26. Banno R, Zimmer D, De Jonghe BC, Atienza M, Rak K, Yang W, Bence KK. 2010. PTP1B and SHP2 in POMC neurons reciprocally regulate energy balance in mice. J Clin Invest 120:720–734 [DOI] [PMC free article] [PubMed] [Google Scholar]
- 27. Leshan RL, Bjornholm M, Munzberg H, Myers MG., Jr. 2006. Leptin receptor signaling and action in the central nervous system. Obesity (Silver Spring) 14 Suppl 5:208S–212S [DOI] [PubMed] [Google Scholar]
- 28. Patterson CM, Leshan RL, Jones JC, Myers MG., Jr 2011. Molecular mapping of mouse brain regions innervated by leptin receptor-expressing cells. Brain Res 1378:18–28 [DOI] [PMC free article] [PubMed] [Google Scholar]
- 29. Bragina L, Giovedì S, Barbaresi P, Benfenati F, Conti F. 2010. Heterogeneity of glutamatergic and GABAergic release machinery in cerebral cortex: analysis of synaptogyrin, vesicle-associated membrane protein, and syntaxin. Neuroscience 165:934–943 [DOI] [PubMed] [Google Scholar]
- 30. McClellan KM, Stratton MS, Tobet SA. 2010. Roles for γ-aminobutyric acid in the development of the paraventricular nucleus of the hypothalamus. J Comp Neurol 518:2710–2728 [DOI] [PMC free article] [PubMed] [Google Scholar]
- 31. Saito K, Kakizaki T, Hayashi R, Nishimaru H, Furukawa T, Nakazato Y, Takamori S, Ebihara S, Uematsu M, Mishina M, Miyazaki J, Yokoyama M, Konishi S, Inoue K, Fukuda A, Fukumoto M, Nakamura K, Obata K, Yanagawa Y. 2010. The physiological roles of vesicular GABA transporter during embryonic development: a study using knockout mice. Mol Brain 3:40. [DOI] [PMC free article] [PubMed] [Google Scholar]
- 32. Hentges ST, Nishiyama M, Overstreet LS, Stenzel-Poore M, Williams JT, Low MJ. 2004. GABA release from proopiomelanocortin neurons. J Neurosci 24:1578–1583 [DOI] [PMC free article] [PubMed] [Google Scholar]
- 33. Xu Y, Tong Q. 2011. Expanding neurotransmitters in the hypothalamic neurocircuitry for energy balance regulation. Protein Cell 2:800–813 [DOI] [PMC free article] [PubMed] [Google Scholar]
- 34. Leinninger GM, Jo YH, Leshan RL, Louis GW, Yang H, Barrera JG, Wilson H, Opland DM, Faouzi MA, Gong Y, Jones JC, Rhodes CJ, Chua S, Jr, Diano S, Horvath TL, Seeley RJ, Becker JB, Munzberg H, Myers MG., Jr 2009. Leptin acts via leptin receptor-expressing lateral hypothalamic neurons to modulate the mesolimbic dopamine system and suppress feeding. Cell Metab 10:89–98 [DOI] [PMC free article] [PubMed] [Google Scholar]
- 35. Qiu J, Fang Y, Bosch MA, Rønnekleiv OK, Kelly MJ. 2011. Guinea pig kisspeptin neurons are depolarized by leptin via activation of TRPC channels. Endocrinology 152:1503–1514 [DOI] [PMC free article] [PubMed] [Google Scholar]
- 36. Irani BG, Le Foll C, Dunn-Meynell A, Levin BE. 2008. Effects of leptin on rat ventromedial hypothalamic neurons. Endocrinology 149:5146–5154 [DOI] [PMC free article] [PubMed] [Google Scholar]
- 37. Elmquist JK. 2001. Hypothalamic pathways underlying the endocrine, autonomic, and behavioral effects of leptin. Physiol Behav 74:703–708 [DOI] [PubMed] [Google Scholar]
- 38. Cowley MA, Smart JL, Rubinstein M, Cerdán MG, Diano S, Horvath TL, Cone RD, Low MJ. 2001. Leptin activates anorexigenic POMC neurons through a neural network in the arcuate nucleus. Nature 411:480–484 [DOI] [PubMed] [Google Scholar]
- 39. Leinninger GM, Opland DM, Jo YH, Faouzi M, Christensen L, Cappellucci LA, Rhodes CJ, Gnegy ME, Becker JB, Pothos EN, Seasholtz AF, Thompson RC, Myers MG., Jr 2011. Leptin action via neurotensin neurons controls orexin, the mesolimbic dopamine system and energy balance. Cell Metab 14:313–323 [DOI] [PMC free article] [PubMed] [Google Scholar]
- 40. Hentges ST, Otero-Corchon V, Pennock RL, King CM, Low MJ. 2009. Proopiomelanocortin expression in both GABA and glutamate neurons. J Neurosci 29:13684–13690 [DOI] [PMC free article] [PubMed] [Google Scholar]
- 41. Meister B. 2007. Neurotransmitters in key neurons of the hypothalamus that regulate feeding behavior and body weight. Physiol Behav 92:263–271 [DOI] [PubMed] [Google Scholar]
- 42. Ovesjö ML, Gamstedt M, Collin M, Meister B. 2001. GABAergic nature of hypothalamic leptin target neurones in the ventromedial arcuate nucleus. J Neuroendocrinol 13:505–516 [DOI] [PubMed] [Google Scholar]
- 43. McIntire SL, Reimer RJ, Schuske K, Edwards RH, Jorgensen EM. 1997. Identification and characterization of the vesicular GABA transporter. Nature 389:870–876 [DOI] [PubMed] [Google Scholar]
- 44. Tong Q, Ye C, McCrimmon RJ, Dhillon H, Choi B, Kramer MD, Yu J, Yang Z, Christiansen LM, Lee CE, Choi CS, Zigman JM, Shulman GI, Sherwin RS, Elmquist JK, Lowell BB. 2007. Synaptic glutamate release by ventromedial hypothalamic neurons is part of the neurocircuitry that prevents hypoglycemia. Cell Metab 5:383–393 [DOI] [PMC free article] [PubMed] [Google Scholar]
- 45. Stanley BG, Urstadt KR, Charles JR, Kee T. 2011. Glutamate and GABA in lateral hypothalamic mechanisms controlling food intake. Physiol Behav 104:40–46 [DOI] [PubMed] [Google Scholar]
- 46. Turenius CI, Charles JR, Tsai DH, Ebersole PL, Htut MH, Ngo PT, Lara RN, Stanley BG. 2009. The tuberal lateral hypothalamus is a major target for GABAA–but not GABAB-mediated control of food intake. Brain Res 1283:65–72 [DOI] [PubMed] [Google Scholar]
- 47. Tsujii S, Bray GA. 1991. GABA-related feeding control in genetically obese rats. Brain Res 540:48–54 [DOI] [PubMed] [Google Scholar]
- 48. Richards BS, Berthoud HR. 2006. Staying slim on a low-GABA diet. Nat Med 12:504–506 [DOI] [PubMed] [Google Scholar]
- 49. Ebenezer IS, Patel SM. 2011. Effects of intraperitoneal administration of the GABA B receptor agonist baclofen on food intake in rats measured under different feeding conditions. Eur J Pharmacol 653:58–62 [DOI] [PubMed] [Google Scholar]
Associated Data
This section collects any data citations, data availability statements, or supplementary materials included in this article.