Abstract
Adamantyl ureas were previously identified as a group of compounds active against Mycobacterium tuberculosis in culture with minimum inhibitor concentrations (MICs) below 0.1 μg/ml. These compounds have been shown to target MmpL3, a protein involved in secretion of trehalose mono-mycolate. They also inhibit both human soluble epoxide hydrolase (hsEH) and M. tuberculosis epoxide hydrolases. However, active compounds to date have high cLogP’s and are poorly soluble, leading to low bioavailability and thus limiting any therapeutic application. In this study, a library of 1,600 ureas (mostly adamantyl ureas), which were synthesized for the purpose of increasing the bioavailability of inhibitors of hsEH, was screened for activity against M. tuberculosis. 1-Adamantyl-3-phenyl ureas with a polar para substituent were found to retain moderate activity against M. tuberculosis and one of these compounds was shown to be present in serum after oral administration to mice. However, neither it, nor a closely related analog, reduced M. tuberculosis infection in mice. No correlation between in vitro potency against M. tuberculosis and the hsEH inhibition were found supporting the concept that activity against hsEH and M. tuberculosis can be separated. Also there was a lack of correlation with cLogP and inhibition of the growth of M. tuberculosis. Finally, members of two classes of adamantyl ureas that contained polar components to increase their bioavailability, but lacked efficacy against growing M. tuberculosis, were found to taken up by the bacterium as effectively as a highly active apolar urea suggesting that these modifications to increase bioavailability affected the interaction of the urea against its target rather than making them unable to enter the bacterium.
Keywords: adamantyl, urea, tuberculosis, TB drug discovery
1. Introduction
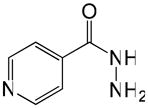
Tuberculosis (TB)a is a contagious disease and one of the leading causes of death world-wide. According to the World Health Organization, more than two billion people, one third the world’s total population, are infected with the TB bacterium, including 10–15 million in the United States alone. The current chemotherapeutic approach involves a 6 months treatment consisting of an initial intensive phase of rifampicin, isoniazid, pyrazinamide, and ethambutol daily for 2 months followed by a continuation phase of rifampicin and isoniazid for a further 4 months, either daily or 3 times per week.1 The emergence of drug-resistant strains has been a huge problem in recent years,2 and now strains resistant to both first and second line antibiotics multidrug resistant (MDR) and extensively drug-resistant (XDR) TB respectively have clearly been identified.3;4 Although it is desirable to improve standard chemotherapy by identifying drugs that act more quickly and are active against non-replicating TB bacilli5 obtaining such compounds is difficult and problematic. In contrast, compounds of reasonable activity comparable to isoniazid and rifampicin should be more readily obtainable and are urgently needed for MDR and XDR TB. The use of quinolones, one of the few remaining drugs available to effectively treat patients with MDR 6;7 is threatened by resistance.8 In the search for such drugs a large effort has focused on targeting essential M. tuberculosis enzymes because an enzyme targeted approach has yielded powerful and important new drugs in other fields such as the protease inhibitors in AIDS and statins in cholesterol control. However, in spite of intensive efforts both in industry and academia, this approach has yet to yield promising new antimicrobials.9 In contrast, screening chemical libraries against mycobacteria in culture has yielded new drug candidates, perhaps most importantly a diarylquinolone 10 which is now in phase III clinical trials. Screening against mycobacteria in our own laboratories revealed the potent activities of adamantyl ureas against M. tuberculosis in culture.11 The target of these adamantyl ureas has been shown to be the trehalose mono-mycolate transporter known as MmpL3.12 MmpL3 has previously been shown to be essential for the growth of M. tuberculosis13 and efforts are underway to develop a direct assay for its action in our laboratory. Some structure activity relationships have been determined11 but in all cases the compounds were poorly bioavailable. In the context of inhibitors of human soluble epoxide hydrolase, over 1600 ureas have been synthesized, primarily in efforts to improve their bioavailability.14–18 The determination of the potency of these compounds against M. tuberculosis in culture was undertaken as a logical next step to develop ureas with good bioavailability as new tuberculosis therapeutic agents.
2. Results and discussion
2. 1. Initial Screen
An initial screen of the library was conducted at 10 μM compound concentration against M. tuberculosis H37Rv. All compounds with some activity were further analyzed to determine their MIC values against the same bacterium. All active compounds are presented in Tables 1–3. In addition some compounds with structures related to active compounds that were inactive at 10 μM were also analyzed for MICs values (Tables 1–3).
Table 1.
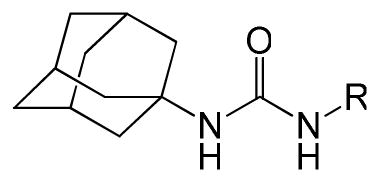
Phenyl adamantyl ureas with small substitutents
| |||
|---|---|---|---|
| ID# | R | MIC μg/ml | cLogP |
| 1 |

|
0.2 | 5.0 |
| 2 |
|
0.6 | 6.2 |
| 3 |

|
0.8 | 4.3 |
| 4 |
|
0.8 | 5.2 |
| 5 |

|
0.9 | 5.2 |
| 6 |
|
1.1 | 4.1 |
| 7 |

|
0.1 | 5.2 |
| 8 |

|
1.1 | 4.1 |
| 9 |

|
1.1 | 4.3 |
| 10 |

|
1.2 | 4.3 |
| 11 |

|
1.4 | 5.7 |
| 12 |

|
1.5 | 4.3 |
| 13 |

|
1.9 | 3.9 |
| 14 |

|
2.0 | 3.8 |
| 15 |
|
2.0 | 4.3 |
| 16 |

|
>3.1 | 4.2 |
| 17 |

|
2.0 | 3.9 |
| 18 |

|
2.1 | 3.4 |
| 19 |

|
2.2 | 3.9 |
| 20 |
|
3.9 | 3.8 |
| 21 |

|
4.7 | 4 |
| 22 |

|
7.8 | 3.8 |
| 23 |

|
66 | 3.3 |
| 24 |

|
14 | 3.8 |
| 25 |

|
17 | 3.8 |
| 26 |

|
19 | 4.3 |
| 27 |

|
30 | 3.9 |
| 28 |

|
32 | 3.0 |
| 29 |

|
36 | 3.9 |
| 30 |

|
57 | 3.1 |
| 31 |

|
65 | 2.8 |
| INH |
|
0.08 | −0.67 |
Table 3.
Phenyl adamantyl ureas with linker group
| |||
|---|---|---|---|
| ID# | R | MIC μg/ml | cLogP |
| 56 |

|
0.7 | 5.3 |
| 57 |
|
3.4 | 4.8 |
| 58 |

|
0.7 | 4.6 |
| 59 |

|
6.7 | 5.2 |
| 60 |

|
8.3 | 5.6 |
| 61 |

|
10 | 5.4 |
| 62 |

|
14 | 5.2 |
| 63 |
|
>20 | 5.2 |
| 64 |
|
>39 | 5.2 |
| 65 |

|
>41 | 5.4 |
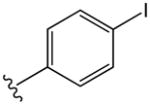
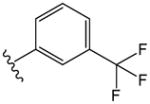
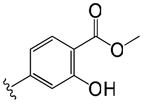
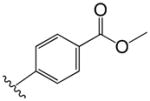
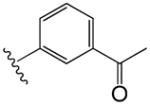
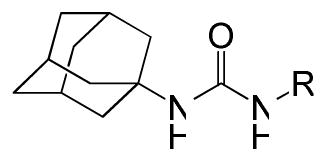
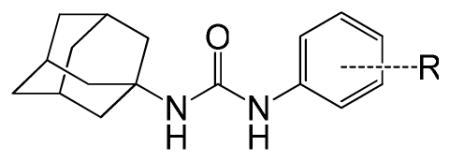
The compounds presented in Table 1 are phenyl adamantyl ureas with various small substituents on the phenyl group. The most active were halogenated subsituents (e.g. 1-5 Table 1) which tended towards high cLogP values and also were similar to compounds previously recognized as highly active.11 On the other extreme, compounds with ionizeable groups such as 22, 29, and 30 (Table 1) showed very poor MIC values; in fact all of 49 adamantyl ureas that contained a COOH group, except 22 were inactive at 10 μM against M. tuberculosis. A large number of small, non-ionizeable subsituents on the phenyl ring including ethers, thio ethers, and esters showed intermediate activity with MICs between 1 and 5 (Table 1).
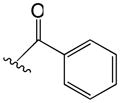
The effect of the attachment of larger groups to the phenyl ring of phenyl adamantyl ureas was analyzed (Table 2). The attachment of a second phenyl ring to the phenyl adamantyl ureas via an ether linkage led to three compounds with MIC values below 1 μg/ml (32-34). The activity was sensitive to the attachment position on the internal phenyl ring, a ~30-fold decreased in antibacterial potency was observed by moving the phenoxy substituent of 32 from a para position to the meta position (38). This is also reflected with compounds 34 and 37 (Table 2). Unfortunately, all these compounds are quite non-polar. Groups such as morpholino (40,41,46, 47) linked to the phenyl via an ether linkage produced compounds with decreased cLogP values, but these compounds had very high MIC values (all greater than 20 μg/ml). Linkage of the morpholino group via an amide also resulted in an inactive compound (45, Table 2).
Table 2.
Phenyl adamantyl ureas with large substituents
| ||||
|---|---|---|---|---|
| ID # | R | MIC μg/ml | cLogP | |
| 32 | p |

|
0.1 | 5.9 |
| 33 | m |

|
0.3 | 6.1 |
| 34 | p |

|
0.6 | 6.0 |
| 35 | p |
|
1.8 | 5.3 |
| 36 | m |

|
2.4 | 5.4 |
| 37 | m |

|
2.5 | 4.0 |
| 38 | m |

|
3.4 | 5.9 |
| 39 | m |

|
5.7 | 5.4 |
| 40 | p |

|
>25 | 4.3 |
| 41 | m |
|
21 | 4.0 |
| 42 | o |
|
21 | 4.0 |
| 43 | o |

|
21 | 3.9 |
| 44 | p |
|
21 | 4.0 |
| 45 | m |

|
>30 | 3.2 |
| 46 | p |

|
>30 | 4.0 |
| 47 | m |

|
32 | 3.9 |
| 48 | p |

|
39 | 5.4 |
| 49 | m |

|
>33 | 3.4 |
| 50 | p |

|
>37 | 2.7 |
| 51 | p |

|
>44 | 3.8 |
| 52 | m |

|
44 | 3.5 |
| 53 | p |

|
62 | 3.4 |
| 54 | p |

|
66 | 5.3 |
| 55 | p |

|
>68 | 3.8 |
Finally, compounds in which the phenyl group of phenyl adamantyl phenyl ureas was attached to the urea moiety via a non-aromatic linker groups were analyzed (Table 3). Relatively short alkanes (58 and 57) and alkynes (56) retained some activity and two had cLogP values below 5. Cyclohexyl spacer groups in either cis or trans configurations (Table 3) in which the phenyl groups were attached by an ether linkage essentially lost all activity.
2.2. Follow up on 6
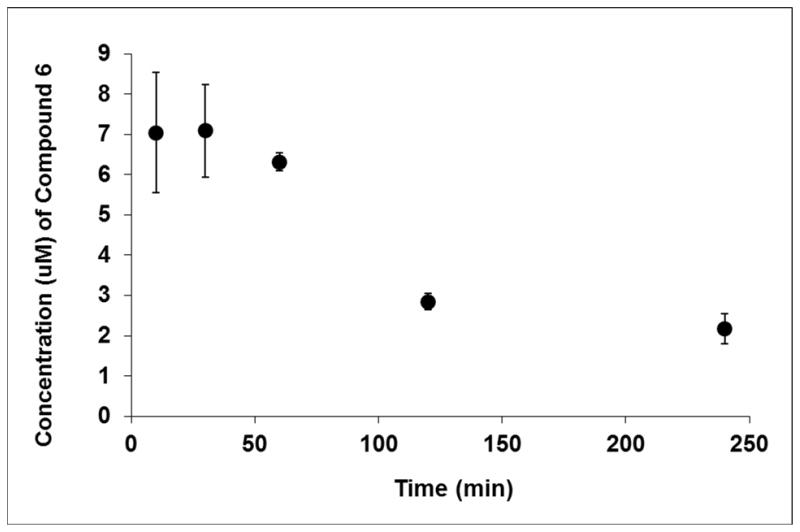
Our initial goal was to identify compounds with both a good MIC and reasonable cLogP and other molecular features consistent with the possibility of good bioavailability. Although there was found to be no overall correlation between MIC values and cLogP values (see Table S1 in the supplementary section), only one compound, 3 (Table 1) with an MIC below 1 μg/ml and a cLogP below 4.5 was found; when the MIC criteria was relaxed to 1.1 μg/ml (and the cLogP criteria kept at below 4.5) three others were noted, 6, 8, and 9 (Table 1). Since compound 6 had been shown to have encouraging pharmacokinetics in dog (C. Morisseau unpublished results), it was selected for further studies. An initial PK study in mice showed that the compound appeared in serum at concentrations above the MIC values (Fig. 1) when dosed in standard (i.e. not genetically modified) mice at 140 mg/kg in 30% Captisol. Therefore, an efficacy study using tuberculosis infected mice was performed using this compound and the related compound 7 (Table 1, MIC 0.1 μg.ml). (In compound 7 the adamantyl group is attached to a secondary carbon as we have found that attachment of the urea nitrogen to a secondary rather than a tertiary carbon in the adamantyl group yields compounds with a lower MICs11.) Gamma interferon knockout (GKO) mice were infected with a low dose aerosol and treatment with 6 and 7 at 150 mg/kg in 30% Captisol performed twice a day by oral gavage, starting 15 days after infection and proceeding for 9 days of treatment (Table 4). Unfortunately in contrast to the over 3 log protection afford by the known drug isoniazid, no protection was seen in either lungs or spleens for either compound (Table 4). These disappointing results suggest further experiments to determine the concentration of 6 and 7 in lungs and their efficacy against M. tuberculosis in macrophages.
Fig. 1.
The concentrations in serum of 6 after administration in 30% Captisol by gavage at 140 mg/kg. The concentrations were well above MIC of 1.1 μg/mL (~3 μM) for about 2 hr. and around the MIC for the duration of the experiment.
Table 4.
Efficacy of two adamantyl ureas in mice
| Group: | Number of mice | Lung Log10CFU | Spleen Log10CFU |
|---|---|---|---|
| Day 1 post aerosol infection | 3 | 1.85 ± 0.14 | NA |
| Day 15 post aerosol infection | 5 | 7.42 ± 0.08 | 5.53 ± 0.22 |
| Day 24 post aerosol infection (no drug treatment) | 3 | 8.86 ± 0.02 | 7.30 ± 0.09 |
| Day 24 post aerosol infection Captisol only (OPD oral) | 4 | 8.77 ± 0.18 | 7.06 ± 0.13 |
| Day 24 post aerosol infection treated with 6 (150 mg/kg BID oral) | 5 | 8.77 ± 0.12 | 7.31 ± 0.13 |
| Day 24 post aerosol infection treated with 7 (150 mg/kg BID oral) | 4 | 8.74 ± 0.12 | 7.33 ± 0.02 |
| Day 24 post aerosol infection treated with INH (25 mg/kg OPD oral) | 5 | 5.41 ± 0.06a | 3.63 ± 0.13 |
Significantly lower than day 24 untreated control (p < 0.05)
2.3. Lack of correlation between inhibition of epoxide hydrolase and inhibition of growth of M. tuberculosis in culture
In our initial work with these analogs, we recognized that adamantyl ureas could inhibit the human soluble epoxide hydrolase (hsEH).11 Inhibition of hsEH has been shown to affect cardiovascular diseases and pain management.19;20 Thus, all active hits were analyzed for a correlation between their ability to inhibit the growth of M. tuberculosis in culture and their ability to inhibit hsEH. The analysis (see supplementary material, tables S1 and S2) showed that there was no correlation between the MIC values and the IC50s against the hsEH which is encouraging in the context of avoiding unwanted inhibition of hsEH with future adamantyl ureas targeting the growth of M. tuberculosis. We next determined if compounds with cyclohexylether and morpholino groups (Table S3 and also see Table 5) with high MIC values against M. tuberculosis were inactive due to their inability to enter the bacterium. Both compounds (67 and 40) were quite active against hsEH; 67 was also active against tuberculosis epoxide hydrolase but 40 relatively inactive against the tuberculosis enzyme (Table 5). The analysis showed that both 67 and 40 were taken up as well as 66 which is highly effective against M. tuberculosis (Table 5). Thus the cyclohexylether and morpholino groups did not inhibit the uptake of these compound by M. tuberculosis and likely the compounds were inactive because they no longer inhibited the transport action of MmpL3.
Table 5.
Uptake by M. tuberculosis of adamantyl ureas highly active against hsEH but not against the growth of M. tuberculosis
| ID# | Structure | HsEH IC50 (nM)a | % inhibition EphEb | MIC (MTb) | Conc inside MTbc (ng/50 μl wet cell pellet) |
|---|---|---|---|---|---|
| 66 |

|
0.4 | 68 | 0.01 | 75 (14)d |
| 67 |
|
11.4 | 93 | 25 | 128 (20)e |
| 40 |
|
9.4 | 19 | 17 | 103 (5)f |
Concentration (nM) that inhibits human soluble epoxide hydrolase to 50% activity.
Percent inhibition of M. tuberculosis epoxide hydrolase E when the urea is at 10 nM.
The amount of adamantyl urea present in the cytosol (soluble fraction after breaking the cells) of a 50 μl pellet of M. tuberculosis H37Ra after treatment with 5 μM adamantyl urea. Standard deviation is in parenthesis.
Average of 3 experiments.
Average of 4 experiments.
Average of 2 experiments.
2.4. Conclusions
In conclusion it was found that the best modifications of the phenyl group that retained activity against M. tuberculosis but decreased the cLogP values were the combination of carboxy methyl and an alcohol (6 Table 1). Compounds with larger and specifically designed groups such as polyethers, cyclohexyl ethers, and morpholino groups which very nicely lowered cLogP values while retaining activity against hsEH, lost their effectiveness against M. tuberculosis. After administration by oral gavage, 6 appeared in the serum in concentrations well above its MIC, but neither it nor the related 7 were efficacious in diminishing an infection of M. tuberculosis in the mouse model. Further experimentation is required to determine if high protein binding is the reason for this lack of efficacy or if other factors play a role. On the other hand, it was encouraging to note the divergence of inhibition of epoxide hydrolase inhibition activity and inhibition of the growth of M. tuberculosis and to see that adamantyl ureas containing polar components in their structure were able to penetrate the highly impermeable mycobacterial cell wall.
3. Experimental procedures
3.1. Preparation of the library of ureas
Most of chemicals used in the library were synthesized for their ability to inhibit the human soluble epoxide hydrolase 14;15;17;18;21–28; few were of commercial origins (Chem Service Inc., West Chester, PA; and Sigma Chemical Co, St Louis, MO). The library was prepared in 2 mL deep well polypropylene 96-well assay blocks (Fisher Scientific, Santa Clara, CA; # 07200700). For every compound, a one milliliter solution at 10 mM in DMSO was prepared in a 2 ml glass vial and the solution was transferred into the assay block using a clean glass syringe. Only compounds totally soluble at 10 mM in DMSO were kept inside the library. In each plate 1 mL of DMSO was dispensed in the first column wells to serve as controls. In the remainder of the plates, one compound per well was dispensed, with 88 compounds total per plate. Nineteen plates were created with different chemicals for a total of 1672 compounds. The plates were tightly sealed with EVA copolymer sealing mats (Fisher Scientific #07201112). The plates were then sealed in a 2-mil thick plastic bag, to avoid condensation, and stored at −20°C until use. Upon usage, the plates were allowed to warm-up at room temperature overnight before to be removed from the plastic bag. Using a robotic pipetting station (Quadra 96 – 96 well automated pipetor; Tomtec, Hamden, CT), each well was first mixed and the compound solutions were diluted 10-fold in DMSO (down to 1 mM) and then in the appropriate buffer or media and transferred into 96 well plates.
3.2. MIC values, cLogP calculations, and Epoxide hydrolase inhibition
MICs, soluble human soluble epoxide hydrolase inhibition, and mycobacteria epoxide hydrolase inhibition were determined as previously described.11 cLogP values were calculated by ChemBioDraw (Cambridge Soft, Cambridge, MA).
3.3. Chemical synthesis of 66, 6, 7, 67, and 40
All synthesized compounds had >99% purity determined by RP-HPLC and ELSD.
3.3.1
1-(2-adamantyl)-3-(2,3,4-trifluorophenyl)urea 6611 and 3.2.2 Methyl 4-(3-(1-adamantyl)ureido)-2-hydroxybenzoate (6)11;29 were synthesized as described.
3.2.3 Methyl 4-(3-(2-adamantyl)ureido)-2-hydroxybenzoate (7)
Compound 7 was synthesized using a modified protocol from Majer and Randad.30 Triphosgene (1.10 g, 3.7 mmol) was dissolved in 1,2-dichloroethane (25 mL) and cooled on an acetone and dry ice bath. To that, a mixture of methyl 4-amino-2-hydroxybenzoate (2.01 g, 12.0 mmol) and DIPEA (3.83 mL, 22.0 mmol) in 1,2-dichloroethane (50 mL) was added drop wise over 15 minutes. After the reaction mixture stirred for an additional 5 minutes, a suspension of 2-adamantylamine hydrogen chloride (1.88 g, 10 mmol) and DIPEA (3.83 mL, 22.0 mmol) in 1,2-dichloroethane (25 mL) was added. The reaction mixture was removed from the acetone and dry ice bath and stirred for 1 hour. The solvent was then removed under reduced pressure and the residue was purified on silica gel using a hexane to ethyl acetate gradient. Yield: 1.569 g (46%) as a white powder; Mp: 210–214°C; 1H NMR (DMSO-d6): δ = 1.56 (1H, s), 1.59 (1H, s), 1.67–1.89 (12H, m), 3.77 (1H, d, J = 8 Hz), 3.85 (3H, s), 6.63 (1H, d, J = 8 Hz), 6.80 (1H, d, J = 8 Hz), 7.20 (1H, s), 7.65 (1H, d, J = 8 Hz), 8.81 (1H, s), 10.66 (1H, s); ESI-HRMS m/z: [M+H]+ calcd: 345.1814, found: 345.1801
3.2.4 1-(1-adamantyl)-3-(4-pentyloxycyclohexyl)urea (67)
Compound 67 was synthesized as previously described17 (in that report it was identified as compound 24). Yield: 49 mg (27%) as a white powder; Mp: 229–231°C; 1H NMR (CDCl3): δ = 0.89 (3H, t, J = 8 Hz), 1.10 (2H, q, J = 16 Hz), 1.29–1.39 (5H, m), 1.53–1.57 (4H, m), 1.66 (6H, br), 1.95–2.06 (12H, m), 3.16 (1H, m), 3.41 (2H, t, J = 8 Hz), 3.44–3.52 (1H, m), 3.88 (1H, d, J = 8 Hz), 3.93 (1H, s); ESI-HRMS m/z: [M+H]+ calcd: 363.3012, found: 363.2985.
3.2.5 1-(1-adamantyl)-3-(4-(3-(4-morpholinyl)propoxy)phenyl)urea (40)
Compound 40 was synthesized as previously described17 (in that report it was identified as compound 29). Yield: 169 mg (23%) as a tan powder; Mp: 187–191°C; 1H NMR (CDCl3): δ = 1.66 (9H, br), 1.92–1.99 (8H, m), 2.47 (4H, br), 2.52 (2H, t, J = 8 Hz), 3.72 (4H, t, J = 4 Hz), 3.99 (2H, t, J = 4 Hz), 4.40 (1H, s), 5.96 (1H, s), 6.85 (2H, d, J = 12 Hz), 7.15 (2H, d, J = 12 Hz); ESI-HRMS m/z: [M+H]+ calcd: 414.2757, found: 414.2744.
3.4. Initial PK study of 6
Compound 6 was suspended in Captisol to deliver 140 mg/kg of compound; specifically at 2.8 mg/200 μl of Captisol for each 200 μl dose to 20 gram mice. Three mice were bled from the lateral tail vein at 10, 30, 60, 120, and 240 minutes. To obtain serum the blood was allowed to clot for at least 1 hour and then centrifuged at ~3000g for 15 minutes at 40 °C. Then the supernatant was transferred to a sterile tube and frozen at −70°C awaiting extraction and LC/MS analysis. Upon thawing, the supernatant was diluted with methanol (4:1), which contained the internal standard warfarin. The final concentration of warfarin in the methanol/supernatant mixture was 5 μM. To remove precipitated proteins, the samples were centrifuged at ~10,000g for 10 minutes at 4°C. The supernatant was transferred to a 96-well plate and sealed, followed by LC/MS analysis on a Waters Acquity TQD LCMS. Compound 6 was quantified using a 7-point calibration curve normalized to the internal standard (warfarin, 5 μM).
3.5. Human plasma protein binding assay
Sample preparation for plasma protein binding was modified from Waters’ method.31 The Teflon base plate with the RED (rapid equilibrium dialysis, Thermo Scientific, Rockford, IL) inserts (MWCO 8 kDa) were used without any precondition the membrane inserts. Human plasma (Innovative Research, Michigan, IL) was thawed and centrifuged at 1000 rpm for 2 min to remove any particulates. Compound stocks (10 mM in DMSO) were diluted to 10 μM in human plasma. Spiked plasma solutions (300 μL) were placed into the sample chamber and 500 μL of DPBS into the adjacent chamber. The plate was sealed and incubated at 37°C on an orbital shaker (100 rpm) for 4 hours. After incubation, the seal was removed from the RED plate and aliquots (50 μL) were removed from each side of the insert and dispensed into a 96-well deep plate. An equal volume of blank plasma or DPBS was added to the required wells to create analytically identical sample matrices. To each sample 200 μL of ACN containing 4 mg/ml warfarin internal standard was added. All of the plates were sealed and mixed at 600 rpm for 10 minutes followed by centrifugation at 4000 rpm for 20 minutes. The supernatants (120 μL) were transferred to analytical plates for analysis by LCMS. Compound concentrations were quantified in both buffer and plasma chambers via peak areas relative to the internal standard. The percentage of the test compound bound to plasma was calculated on following equations: % free = (concentration buffer chamber/concentration plasma chamber) × 100% and %bound = 100% − % free.
3.6. Determination of efficacy of 6 and 7 in mice
The published protocol using GKO mice was followed.32 Briefly gamma interferon knockout mice were infected with M. tuberculosis (Erdman) with a low dose aerosol. Treatment was for 9 days beginning at day 15 by oral gavage with 6 and (separately) 7 at 150 mg/kg in 30% Captisol twice a day by gavage for 9 days. Five mice were used for each drug and no drug control (treatment with 30% Captisol without drug) and positive control of 25 mg/kg of INH once a day. After the 9 days of treatment the mice were sacrificed and the CFUs present in the lungs and spleen determined as described.32
3.7. Determination of uptake of adamantyl ureas by M. tuberculosis
H37Ra was grown up to mid to late log phase in 7H9 + OADC without tween. Two to 5 ml of culture were spun down in an Eppendorf tube until a pellet of 50 μL was obtained. The pellet was resuspended in 1mL of media containing 5μM of the adamantyl urea to be tested and incubated in a shaker at 37°C for 4 hours. The cells were recovered by centrifugation and washed 3x in 1ml of PBS buffer. They were then broken in 1mL of double distilled water using a bead beater with three seconds pulses. Between cycles, cells were stored on ice. Following centrifugation at 12,000xg for 10 min the supernatant was removed. Approximately 9 ml of double distilled water was added followed by ultracentrifugation at 1hr to prepare the cytosolic fraction. It was then moved into glass 13x100 tube and drug was extracted with 3ml of ethyl acetate containing 0.17 μg of internal standard (usually 6). The ethyl acetate layer was removed, dried down using a nitrogen bath, and reconstituted in 100 μL of methanol. For LC/MS, an Agilent 6220 TOF mass spectrometer equipped with a MultiMode Source (positive mode) and an Agilent 1200 binary pump was used. The column used was a Waters XBridge (C18 2.1 mm × 150 mm) with a 5 micrometer particle size and the column temperature was maintained at 45 °C. The separation was done using a gradient of solvent A (10mM formic acid in water) and solvent B (10mM formic acid in acetonitrile) starting at 10% solvent B for 2 minutes after injection followed by a linear gradient to 90% solvent B from 2 to 12 minutes after injection. The drying gas temperature was 300 °C, and the vaporizer temperature was set at 200 °C. Typically, 2 μl of sample was injected for analysis, with a flow rate of 0.32 ml/min. The fragmentor voltage was set to 120 V. The mass spectra were acquired from m/z 110 to 2,000 Daltons with a frequency of 1.31 scans/s. The selection ion traces for M+H ions at 325.152 (66) and 363.301 (67), 414.275 (40) or 345.181 (6) were obtained and the peaks integrated. For each compound a standard curve with differing amounts of compound and internal standard was prepared which allowed for the absolute amounts of each compound in the cytosol from 50 μl cell pellet to be calculated (Table 5).
Supplementary Material
Figure S1. 1H NMR spectrum for 66
Figure S2. RP-HPLC traces for 66 with ELSD and UV-vis detection
Figure S3. 1H NMR spectrum for 6
Figure S4. RP-HPLC traces for 6 with ELSD and UV-vis detection
Figure S5. 1H NMR spectrum for 7
Figure S6. 13C NMR spectrum for 7
Figure S7. RP-HPLC traces for 7 with ELSD and UV-vis detection
Figure S8. 1H NMR spectrum for 67
Figure S9. RP-HPLC traces for 67 with ELSD and UV-vis detection
Figure S10. 1H NMR spectrum for 40
Figure S11. RP-HPLC traces for 40 with ELSD and UV-vis detection
Table S1: Structure and activity of the positive hits against M. tuberculosis, their cLogP and activity against hsEH
Table S2: Correlation results
Table S3: Structure and activity of polyethers, cyclohexylethers and morpholino containing compounds against M. tuberculosis, their cLogP and activity against the hsEH
Acknowledgments
We thank National Institutes of Health grants AI057836, AI063054, RC1AI85992 and the American Lebanese Syrian Associated Charities (ALSAC) for financial support.
Footnotes
Abbreviations are: Tuberculosis (TB); ; Minimum inhibitory concentration (MIC); human soluble epoxide hydrolase (hsEH) ; multidrug-resistant (MDR); extensively drug-resistant (XDR); interferon-gamma knockout (GKO)
Publisher's Disclaimer: This is a PDF file of an unedited manuscript that has been accepted for publication. As a service to our customers we are providing this early version of the manuscript. The manuscript will undergo copyediting, typesetting, and review of the resulting proof before it is published in its final citable form. Please note that during the production process errors may be discovered which could affect the content, and all legal disclaimers that apply to the journal pertain.
Reference List
- 1.du Toit LC, Pillay V, Danckwerts MP. Respiratory Research. 2006;7:Article 118. doi: 10.1186/1465-9921-7-118. [DOI] [PMC free article] [PubMed] [Google Scholar]
- 2.O’Brien RJ, Nunn PP. Am J Respir Crit Care Med. 2001;163:1055. doi: 10.1164/ajrccm.163.5.2007122. [DOI] [PubMed] [Google Scholar]
- 3.Gandhi NR, Moll A, Sturm AW, Pawinski R, Govender T, Lalloo U, Zeller K, Andrews J, Friedland G. Lancet. 2006;368:1575. doi: 10.1016/S0140-6736(06)69573-1. [DOI] [PubMed] [Google Scholar]
- 4.Van Rie A, Enarson D. Lancet. 2006;368:1554. doi: 10.1016/S0140-6736(06)69575-5. [DOI] [PubMed] [Google Scholar]
- 5.Deb C, Lee CM, Dubey VS, Daniel J, Abomoelak B, Sirakova TD, Pawar S, Rogers L, Kolattukudy PE. Plos One. 2009;4:Article e6077. doi: 10.1371/journal.pone.0006077. [DOI] [PMC free article] [PubMed] [Google Scholar]
- 6.Maranetra KN. Chemotherapy. 1999;45:12. doi: 10.1159/000048477. [DOI] [PubMed] [Google Scholar]
- 7.De Souzaa MVN, Vasconcelos TRA, de Almeida MV, Cardoso SH. Current Medicinal Chemistry. 2006;13:455. doi: 10.2174/092986706775527965. [DOI] [PubMed] [Google Scholar]
- 8.Von Groll A, Martin A, Jureen P, Hoffner S, Vandamme P, Portaels F, Palomino JC, da Silva PA. Antimicrobial Agents and Chemotherapy. 2009;53:4498. doi: 10.1128/AAC.00287-09. [DOI] [PMC free article] [PubMed] [Google Scholar]
- 9.Talbot GH, Bradley J, Edwards JE, Gilbert D, Scheld M, Bartlett JG. Clinical Infectious Diseases. 2006;42:657. doi: 10.1086/499819. [DOI] [PubMed] [Google Scholar]
- 10.Andries K, Verhasselt P, Guillemont J, Gohlmann HW, Neefs JM, Winkler H, Van Gestel J, Timmerman P, Zhu M, Lee E, Williams P, de Chaffoy D, Huitric E, Hoffner S, Cambau E, Truffot-Pernot C, Lounis N, Jarlier V. Science. 2005;307:223. doi: 10.1126/science.1106753. [DOI] [PubMed] [Google Scholar]
- 11.Brown JR, North EJ, Hurdle JG, Morisseau C, Scarborough JS, Sun DQ, Kordulakova J, Scherman MS, Jones V, Grzegorzewicz A, Crew RM, Jackson M, McNeil MR, Lee RE. Bioorganic & Medicinal Chemistry. 2011;19:5585. doi: 10.1016/j.bmc.2011.07.034. [DOI] [PMC free article] [PubMed] [Google Scholar]
- 12.Grzegorzewicz A, Pham H, Gundi V, Scherman M, North EJ, Hess T, Jones V, Gruppo V, Born S, Kordulakova J. Nature Chemical Biology. 2012 doi: 10.1038/nchembio.794. (in Press) [DOI] [PMC free article] [PubMed] [Google Scholar]
- 13.Domenech P, Reed MB, Barry CE. Infection and Immunity. 2005;73:3492. doi: 10.1128/IAI.73.6.3492-3501.2005. [DOI] [PMC free article] [PubMed] [Google Scholar]
- 14.Morisseau C, Goodrow MH, Dowdy D, Zheng J, Greene JF, Sanborn JR, Hammock BD. Proceedings of the National Academy of Sciences of the United States of America. 1999;96:8849. doi: 10.1073/pnas.96.16.8849. [DOI] [PMC free article] [PubMed] [Google Scholar]
- 15.Morisseau C, Goodrow MH, Newman JW, Wheelock CE, Dowdy DL, Hammock BD. Biochemical Pharmacology. 2002;63:1599. doi: 10.1016/s0006-2952(02)00952-8. [DOI] [PubMed] [Google Scholar]
- 16.Liu JY, Tsai HJ, Hwang SH, Jones PD, Morisseau C, Hammock BD. British Journal of Pharmacology. 2009;156:284. doi: 10.1111/j.1476-5381.2008.00009.x. [DOI] [PMC free article] [PubMed] [Google Scholar]
- 17.Kim IH, Tsai HJ, Nishi K, Kasagami T, Morisseau C, Hammock BD. Journal of Medicinal Chemistry. 2007;50:5217. doi: 10.1021/jm070705c. [DOI] [PMC free article] [PubMed] [Google Scholar]
- 18.Hwang SH, Tsai HJ, Liu JY, Morisseau C, Hammock BD. Journal of Medicinal Chemistry. 2007;50:3825. doi: 10.1021/jm070270t. [DOI] [PMC free article] [PubMed] [Google Scholar]
- 19.Hammock BD, Wagner K, Inceoglu B. Pain Manage. 2011;1:383. doi: 10.2217/pmt.11.47. [DOI] [PubMed] [Google Scholar]
- 20.Ni GH, Chen JF, Chen XP, Yang TL. Pharmazie. 2011;66:153. [PubMed] [Google Scholar]
- 21.McElroy NR, Jurs PC, Morisseau C, Hammock BD. Journal of Medicinal Chemistry. 2003;46:1066. doi: 10.1021/jm020269o. [DOI] [PubMed] [Google Scholar]
- 22.Kim IH, Morisseau C, Watanabe T, Hammock BD. Journal of Medicinal Chemistry. 2004;47:2110. doi: 10.1021/jm030514j. [DOI] [PubMed] [Google Scholar]
- 23.Kim IH, Nishi K, Tsai HJ, Bradford T, Koda Y, Watanabe T, Morisseau C, Blanchfield J, Toth I, Hammock BD. Bioorganic & Medicinal Chemistry. 2007;15:312. doi: 10.1016/j.bmc.2006.09.057. [DOI] [PMC free article] [PubMed] [Google Scholar]
- 24.Kim IH, Heirtzler FR, Morisseau C, Nishi K, Tsai HJ, Hammock BD. Journal of Medicinal Chemistry. 2005;48:3621. doi: 10.1021/jm0500929. [DOI] [PMC free article] [PubMed] [Google Scholar]
- 25.Kasagami T, Kim IH, Tsai HJ, Nishi K, Hammock BD, Morisseau C. Bioorganic & Medicinal Chemistry Letters. 2009;19:1784. doi: 10.1016/j.bmcl.2009.01.069. [DOI] [PMC free article] [PubMed] [Google Scholar]
- 26.Morisseau C, Newman JW, Tsai HJ, Baecker PA, Hammock BD. Bioorganic & Medicinal Chemistry Letters. 2006;16:5439. doi: 10.1016/j.bmcl.2006.07.073. [DOI] [PMC free article] [PubMed] [Google Scholar]
- 27.Jones PD, Tsai HJ, Do ZN, Morisseau C, Hammock BD. Bioorganic & Medicinal Chemistry Letters. 2006;16:5212. doi: 10.1016/j.bmcl.2006.07.009. [DOI] [PMC free article] [PubMed] [Google Scholar]
- 28.Hwang SH, Morisseau C, Do Z, Hammock BD. Bioorganic & Medicinal Chemistry Letters. 2006;16:5773. doi: 10.1016/j.bmcl.2006.08.078. [DOI] [PMC free article] [PubMed] [Google Scholar]
- 29.Kasagami T, Kim IH, Tsai HJ, Nishi K, Hammock BD, Morisseau C. Bioorganic & Medicinal Chemistry Letters. 2009;19:1784. doi: 10.1016/j.bmcl.2009.01.069. [DOI] [PMC free article] [PubMed] [Google Scholar]
- 30.Majer P, Randad RS. Journal of Organic Chemistry. 1994;59:1937. [Google Scholar]
- 31.Waters NJ, Jones R, Williams G, Sohal B. Journal of Pharmaceutical Sciences. 2008;97:4586. doi: 10.1002/jps.21317. [DOI] [PubMed] [Google Scholar]
- 32.Lenaerts AJM, Gruppo V, Brooks JV, Orme IM. Antimicrobial Agents and Chemotherapy. 2003;47:783. doi: 10.1128/AAC.47.2.783-785.2003. [DOI] [PMC free article] [PubMed] [Google Scholar]
Associated Data
This section collects any data citations, data availability statements, or supplementary materials included in this article.
Supplementary Materials
Figure S1. 1H NMR spectrum for 66
Figure S2. RP-HPLC traces for 66 with ELSD and UV-vis detection
Figure S3. 1H NMR spectrum for 6
Figure S4. RP-HPLC traces for 6 with ELSD and UV-vis detection
Figure S5. 1H NMR spectrum for 7
Figure S6. 13C NMR spectrum for 7
Figure S7. RP-HPLC traces for 7 with ELSD and UV-vis detection
Figure S8. 1H NMR spectrum for 67
Figure S9. RP-HPLC traces for 67 with ELSD and UV-vis detection
Figure S10. 1H NMR spectrum for 40
Figure S11. RP-HPLC traces for 40 with ELSD and UV-vis detection
Table S1: Structure and activity of the positive hits against M. tuberculosis, their cLogP and activity against hsEH
Table S2: Correlation results
Table S3: Structure and activity of polyethers, cyclohexylethers and morpholino containing compounds against M. tuberculosis, their cLogP and activity against the hsEH


