

Abstract
Objectives:
To test the hypotheses that 1) patients with relapsing-remitting multiple sclerosis (RR-MS) exhibit a quantifiable decline in their whole-brain concentration of the neural marker N-acetyl-l-aspartate (WBNAA), that is 2) more sensitive than clinical changes and 3) may provide a practical outcome measure for proof-of-concept and larger phase III clinical trials.
Methods:
Nineteen patients (5 men and 14 women) with clinically definite RR-MS, who were 33 ± 5 years old (mean ± SD), had a disease duration of 47 ± 28 months, and had a median Expanded Disability Status Scale (EDSS) score of 1.0 (range 0–5.5), underwent MRI and proton magnetic resonance spectroscopy (1H-MRS) semiannually for 2 years (5 time points). Eight matched control subjects underwent the protocol annually (3 time points). Their global N-acetyl-l-aspartate 1H-MRS signal was converted into absolute amounts by phantom replacement and into WBNAA by dividing with the brain parenchymal volume, VB, from MRI segmentation.
Results:
The baseline WBNAA of the patients (10.5 ± 1.7 mM) was significantly lower than that of the controls (12.3 ± 1.3 mM; p < 0.002) and declined significantly (5%/year, p < 0.002) vs that for the controls who did not show a decline (0.4%/year, p > 0.7). Likewise, VB values of the patients also declined significantly (0.5%/year, p < 0.0001), whereas those of the controls did not (0.2%/year, p = 0.08). The mean EDSS score of the patients increased insignificantly from 1.0 to 1.5 (range 0–6.0) and did not correlate with VB or WBNAA.
Conclusions:
WBNAA of patients with RR-MS declined significantly at both the group and individual levels over a 2-year time period common in clinical trials. Because of the small sample sizes required to establish power, WBNAA can be incorporated into future studies.
Multiple sclerosis (MS), the most common demyelinating disorder in young adults,1 affects more than 2 million people worldwide.2 Nearly 85% of new patients experience a relapsing-remitting (RR) course characterized by short acute episodes of neurologic symptoms, separated by partial or complete remissions,3 that accumulate neurologic deficits over time.4 Although its etiology is unknown, it is accepted that its irreversible sequelae are primarily from neuronal loss,5 making their surrogate markers crucial for a comprehensive picture of the disease and for treatment decisions.
The amino acid derivative N-acetyl-l-aspartate (NAA), which is almost exclusive to neurons and their processes and yields the most intense peak in brain proton magnetic resonance spectroscopy (1H-MRS), is, therefore, well suited to be such a marker and its decreases have been reported in all CNS disorders.6–8 Unfortunately, serial 1H-MRS studies in MS are rare and examine only small regions9,10 or individual lesions.11 They must, therefore, be image-guided, introducing 2 implicit assumptions: 1) changes occur only at MRI abnormalities and 2) they are representative of the entire brain.12 They must also avoid most of the cortex, are sensitive to (unknown) T1 and T2 relaxation times, and are subject to misregistration errors.
These problems can be addressed by obtaining the whole-brain NAA concentration (WBNAA).8 Because (owing to its absolute quantification facet) WBNAA has been shown previously to be insensitive to different scanner types, manufacturer, magnetic field strength, or study site13 and to be temporally stable in healthy individuals,14 but not in patients with MS, we monitored its course in a cohort of patients with RR-MS semiannually over 2 years to test 3 hypotheses: 1) that it will exhibit significant changes; 2) that it will be more sensitive than the Expanded Disability Status Scale (EDSS) score; and 3) that its changes could provide practical outcome measures for small proof-of-concept and larger phase III clinical trials.
METHODS
Participants.
Nineteen patients (5 men and 14 women) with clinically definite MS were recruited prospectively.15 Inclusion criteria were RR course, diagnosis less than 3 years previously, and age younger than 45. Exclusion criteria were MRI contraindications, substance abuse, and any other confounding neurologic conditions. All patients were taking disease-modifying anti-inflammatory medication. Although 4 patients experienced 1 relapse, 3 experienced 2, 2 experienced 3, and 1 experienced 6, for which they were subsequently treated with steroids, all had been relapse- and steroid-free at least 3 months before each of their examinations by the same neurologist. Eight (2 men and 6 women) volunteers with no history of neurologic dysfunction and unremarkable MRI scans also underwent the same protocol annually.
Standard protocol approvals, registrations and patient consents.
Demographics and clinical information for all participants is compiled in table e-1 on the Neurology® Web site at www.neurology.org. All participants signed institutional review board–approved informed consent forms.
MRI.
All experiments were done on a 3.0-T whole-body magnetic resonance scanner (Trio; Siemens AG, Erlangen, Germany) using a circularly polarized transmit-receive head-coil (MR Instruments, Minneapolis, MN). After head-first, supine placement into the magnet, the static magnetic field homogeneity was optimized over the whole brain using our own proton chemical shift imaging–based automatic shim procedure.16 It yielded a consistent 26 ± 9 Hz full-width at half-height whole-head water linewidth in 3–5 minutes. The subject was then imaged with T1-weighted magnetization-prepared rapid acquisition gradient echo (MP-RAGE) (echo time [TE]/repetition time (TR)/inversion time (TI) = 7.0/14.7/300 msec; 256 × 256 × 160 matrix; 256 × 256 × 160 mm2 field-of-view MRI for brain volume segmentation).
Brain volume, VB.
VB was obtained from the MP-RAGE images using the FireVoxel package.17 The procedure starts by placing a seed region in the periventricular white matter to obtain its average signal intensity, IWM. After selection of all pixels at or greater than 0.55 of IWM (but less than 135% to exclude fat), a brain mask is formed for each slice in 3 steps: 1) morphologic erosion; 2) recursive region growth retaining pixels connected to the seed; and 3) morphologic inflation to reverse the effect of erosion. Pixels of intensity less than 0.55 of IWM are defined as CSF. The masks are truncated at the foramen magnum to include the brain stem and cerebellum but not the cord, as shown in figure 1. Finally, VB is the pixel volume times their number in the masks. The precision of this approach for T1-weighted MRI was established at 3.4%.17
Figure 1. Representative images and spectra of a 36-year-old women with relapsing-remitting multiple sclerosis (RR-MS).

(A) Axial T1-weighted MP-RAGE brain slices at baseline and 6, 12, 18, and 24 months from a 36-year-old woman with RR-MS, superimposed with FireVoxel brain volume masks (red). Note the imperceptible brain atrophy and segmentation tool performance. (B) The subject's corresponding whole-head 1H-MRS scan. The N-acetylaspartate (NAA) peak area, SS, was obtained by integration for equation 1. Note the prominent NAA peak at 2 ppm and lipid suppression performance of the sequence and that although several other metabolite peaks are also obtained (creatine [Cr], choline [Cho], and glutamate [Glu]), only NAA is implicitly localized by its biochemistry to the neurons, i.e., to only the brain.
Lesion segmentation.
T2-weighted lesion volumes were calculated from the fluid-attenuated inversion recovery images with FireVoxel. After automatic detection IWM in a periventricular seed, all pixels at or greater than 120, but less than 500% of IWM are selected, and a lesion mask is constructed for each slice in the same 3 steps described above. To ensure accuracy, each slice was then manually inspected, and the mask was modified if needed. Lesion volume for each subject was the product of the number of lesion pixels and their volume.
MRS-WBNAA quantification.
The MRI was followed by nonlocalizing 1H-MRS (TE/TI/TR = 0/940/104 msec).18 The long, TR ≫ T1, and short, TE ≈ 0, ensure insensitivity to possible (but unknown) regional T1 and T2 variations. The NAA peak area, SS, was integrated using in-house software following the operator's manual definition of its left and right edges, as shown in figure 1, by 4 blinded operators. Any area more than 2 SD from their mean was rejected. If more than one area was rejected that dataset was excluded. The 4 (or 3) good areas were averaged into S̄S and converted into absolute amounts, QNAA, by phantom replacement with a 2-L sphere of 1.5 × 10⁻² mol NAA in water using subject and reference NAA peak areas, S̄S and SR,18
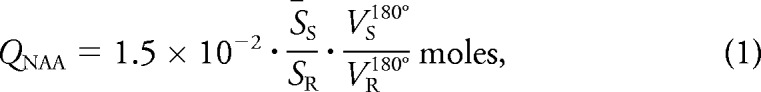 |
where VS180° and VR180° are the transmitter voltages into 50 Ω for nonselective 1-msec 180° inversion pulses on the sphere and subject, respectively, reflecting their relative coil loading.
To account for normal variations in human head size, each QNAA was divided by that individual's VB to yield the global NAA concentration:
which is independent of brain size and, therefore, also suitable for intersubject comparison.
Note that although there are several peaks for metabolites in figure 1, only NAA is localized by its biochemistry specifically to neurons, i.e., the brain.19,20 All other metabolites are present in all tissue types, making it impossible to quantify the brain's contribution to their signal. It is also noteworthy that although macromolecules and other N-acetyl bearing species may also resonate around 2.02 ppm,21 their contribution to the area of the peak was reported by Baslow19 to be less than 10%.
Statistical analyses.
Random coefficients regression was used to estimate and test the mean rate of WBNAA and VB changes as a function of time from initial scan within each group (control subjects and patients) and to test whether the groups differ in terms of their mean rates of change. WBNAA and VB were treated as dependent variables in separate analyses. For each analysis, the data included the levels observed for all subjects at all times. The model included subject group as a classification factor, time from baseline as a numeric factor, and a term representing the interaction of group with time; the interaction tests whether the patients and controls differ in terms of the mean rate of change in the relevant dependent variable. By using random coefficients regression, the slope and intercept of the line describing the temporal change of the dependent variable within each subject group are modeled as random variables whose expected values equal the respective true slope and intercept of the model describing the group's average change. This improves statistical power to detect a group difference in the mean rate of change by removing a component of intersubject variation from the comparison. All reported p values are two-sided and were declared significant when p < 0.05. SAS 9.0 (SAS Institute, Cary, NC) was used for all computations.
An autoregressive correlation structure was used to account for statistical dependence among the longitudinal observations for each subject. That is, observations were assumed to be correlated only when acquired from the same subject, and the strength of correlation between 2 observations was inversely related to the time separation between the observations. To assess changes within individual subjects, least-squares regression was used to estimate and test the rate of change for each subject using only the data from that subject.
A bootstrap resampling procedure was used to estimate the SE of the estimated yearly rate of WBNAA change that would be expected if the data for any one subject consisted of a given number of scans. A statistical power assessment determined the SE that would be needed for 80% power to detect a WBNAA change at a given yearly rate. These 2 results allowed estimation of the number of scans needed for 80% power to detect whether the WBNAA of a given subject is declining at a specific rate. Statistical power assessments and sample size estimates were based on the formulations for longitudinal studies in Diggle et al.22
RESULTS
The EDSS scores, obtained annually by the same neurologist (3 per patient) over the 2-year study, are compiled in table e-1. Over that time, the median EDSS score of the cohort increased from 1.0 to 1.5. It increased in 4 patients and decreased in 2. The EDSS score changes did not correlate with either the WBNAA (p > 0.5) or the brain volume, VB (p > 0.9).
The segmentation software performance for one patient is demonstrated in figure 1. The mean 1,217 cm3 VB at baseline for the patients declined to 1,213, 1,210, 1,205, and 1,205 cm3 at 6, 12, 18, and 24 months and were significantly different from the values for the controls of 1,240, 1,235, and 1,235 cm3 at baseline and at 12 and 24 months. The overall VB for the patients declined significantly (0.5%/year, p < 0.0001, R2 = 0.95), but the VB for the controls did not (0.2%/year, p = 0.08, R2 = 0.75). The difference between mean VB annual decline rate for the 2 groups was also significant (p < 0.003).
The mean lesion load across all patients and scan times was 3.6 cm3. It increased significantly (p = 0.001) at an annual rate of 12.5% (R2 = 0.62) from 3.0 at baseline to 3.7, 3.8, 3.6, and 3.9 cm3 at each subsequent semiannual time point, as shown in figure 2 These volumes represent less than 0.5% of the entire parenchymal volume, and none of the patients had lesion loads above 1% of it.
Figure 2. Serial group distributions of lesion volumes.

Box plots of the lesion volume distribution in the patients at each time point. A mixed-model regression of the means (●) shows a significant annual increase of 12.5% with R2 = 0.62. Note that despite the significant increase, the lesion loads represent approximately 0.5% of the entire VB; i.e., lesion volume does not fully account for either the disparity between patient and control volumes nor the patient VB loss, indicating granular neurodegeneration undetected by MRI.
Sample whole-head 1H-MRS scans are also shown in figure 1, and all WBNAA values are compiled in table e-1. The WBNAA distributions at each time are plotted in figure 3. WBNAA data for none of the patients and WBNAA data from only 1 control subject were excluded because of quality control failure, and only 9 of 119 (7.6%) individual time points were rejected for that reason. The baseline WBNAA for the patients of 10.5 ± 1.7 mM declined to 10.3 ± 1.8, 9.9 ± 1.8, 9.5 ± 1.5, and 9.8 ± 1.5 mM at 6, 12, 18, and 24 months, all significantly lower than those for the controls (12.3 ± 1.3, 12.3 ± 1.0, and 12.2 ± 1.1 mM at 0, 12, and 24 months) (p = 0.001). The regression of the patient WBNAA means shows a significant ∼0.5 mM/year (5%) decline relative to their baseline mean (R2 = 0.69, p = 0.002), whereas the control decline is insignificant (0.4%/year, R2 = 0.36, p = 0.75). These rate differences between the 2 groups are also significant (p = 0.02).
Figure 3. Serial group distributions of VB and whole-brain concentration of N-acetylaspartate (WBNAA).

(A) Box plots showing the first, second (median), and third quartiles (box) ± 95% (whiskers) of the VB distribution in the 8 controls and 19 patients with RR-MS at baseline and at 6, 12, 18, and 24 months. A mixed-model regression of the means (●) shows a significant decline at an annual mean rate of 0.5% with R2 = 0.95 in patients but no decline in controls (○). (B) Box plots of the WBNAA distribution in the same controls and patient cohort. A mixed-model regression of the means (●) shows a significant decline at an estimated annual mean rate of 5% with R2 = 0.69 that is also significantly higher than that of controls (○). Note 1) that the mean WBNAA of the patients is significantly lower than that of the controls at every time point and 2) that the patient cohort shows a significant decline.
Individual regression analyses showed that 5 patients already had a significant decrease in VB, and 8 patients had a decline in WBNAA over the 2 years. Both WBNAA and EDSS declined in 2 patients and both VB and EDSS in 1 patient. WBNAA and VB did not decline significantly in any control subject. There was no significant difference in terms of the within-subject change in either WBNAA or VB with respect to either gender, age, or disease duration.
The intersubject control WBNAA distribution at baseline was not different from either follow-up in its mean or variation. The mean intrasubject WBNAA changes were similar to a those in previous serial study of healthy individuals.18,23 Based on this variability, a statistical power assessment determined that the sample size needed for 80% power at the 5% significance level to detect a mean intrasubject rate of 0.5 mM/year WBNAA decline is 5 patients if each is scanned every 6 months for 2 years (5 scans/patient for a total of 25 scans), 30 patients if each is imaged every 6 months for 1 year (3 scans/patient for a total of 90 scans), or 97 patients if each is imaged twice 6 months apart (2 scans/patient for a total of 194 scans).
DISCUSSION
The link between diffuse neuronal loss and MS progression has led to the assumption that a marker sensitive to the global concentration of neurons (NAA) would be ideal for tracking ongoing pathogeneses faster and more accurately than other methodologies. This information would be useful not only for tracking group changes, which can aid in study design and evaluation, but also for individual patients, potentially aiding in treatment customization. These assumptions prompted 3 hypotheses: first, that a group decline rate can be determined by serial WBNAA measurements in a relatively short time; second, that individual patients would exhibit faster change than typical clinical tests, e.g., EDSS score and more sensitivity than magnetic resonance-based metrics, e.g., VB; and finally, that serial WBNAA changes could provide practical outcome measures for small proof-of-concept and larger phase III clinical trials.
Our results demonstrate that serial WBNAA changes are quantifiable at reasonable sample sizes and hence are suitable for clinical trials of neuroprotective treatments. The 5% annual WBNAA decline for the patients vs that of healthy controls, over a relatively short (1- to 2-year) period, demonstrates sensitivity to the characteristic diffuse neurodegeneration of RR-MS and, therefore, the feasibility of WBNAA as an outcome measure in clinical trials. Along with its known hardware insensitivity, as mentioned in the Introduction, these results also suggest a potential role in determining treatment efficacy in multicenter studies.13
The decline in both VB and WBNAA is significant in patients but not in controls, illustrating that not only have the former lost more parenchyma, but also that there is ongoing neuroaxonal injury in the remaining brain. Interestingly, whereas VB declines 2.5 times faster in patients than in controls, WBNAA declines 12.5 times faster, suggesting higher sensitivity to tissue changes over time. This finding substantiates the result of a previous cross-sectional study showing WBNAA declining 3.6 times faster than the fractional brain parenchymal volume, rendering the former a leading and the latter a lagging indicator.24 This higher sensitivity translates into smaller sample sizes. Indeed, our study shows that a significant WBNAA change can already be detected in 1 year, suggesting that in addition to smaller cohorts, shorter trials can be an added advantage over atrophy measures.25
These advantages may have important implications in light of emerging new treatments targeting the neurodegenerative component of MS that must be tested in proof-of-concept clinical trials before large-phase III trials seeking regulatory approval.26 Although the use of MRI to evaluate the inflammatory disease component in proof-of concept trials is established,27,28 there remains a pressing need for imaging outcomes to screen neuroprotective agents with small sample sizes and a short trial duration. Owing to the higher pathologic specificity for neuroaxonal injury, WBNAA could provide that outcome measure.
WBNAA did not correlate with VB or EDSS at any time point nor were baseline WBNAA or its changes over time predictive of either metric. The lack of correlation between WBNAA and VB, especially its loss over time, is quite unexpected. Because brain atrophy is the result of myelin and axonal loss, it is conceivable that baseline values of or changes in WBNAA would predict, at least in part, VB loss over 2 years. However, it is possible that the lower sensitivity of atrophy measures to changes requires longer follow-up for the 2 metrics to correlate. Moreover, it has been suggested that the NAA decrease may be caused by neuroaxonal dysmetabolism that is in part reversible29 and, therefore, not contributing to axonal loss. Finally, all our patients were taking disease-modifying drugs shown to have an effect on brain atrophy measures.30 Their treatment may have influenced the results by reducing brain volume changes over time and contributed to the lack of correlation. Although the treatment effect on WBNAA is unknown, some evidence suggests that the same disease-modifying agents might improve localized levels of NAA.31,32
Regarding correlations with EDSS, aside from 2 patients whose WBNAA declined significantly and EDSS score increased, one metric did not predict the other. It is likely that those patients who exhibited low WBNAA with no visible signs of disease progression have had fortuitous sparing of eloquent areas and well-functioning plastic compensatory mechanisms. This may, unfortunately, portend a bleaker clinical picture later in life.33 Conversely, an elevated EDSS score and stable WBNAA may indicate limited focal neuronal damage (below the sensitivity threshold of the method) in eloquent areas either in the brain or the spine, a region not monitored by the WBNAA method. For example, patient 7 in table e-1 displayed an EDSS score decrease with stable WBNAA and also a clinical transient monocular decrease of vision, probably caused by a lesion on the optic nerve. Furthermore, similar to correlations with brain atrophy, a probable treatment effect and WBNAA decline reflect that not only (permanent) axonal loss but also (reversible) dysfunction might have influenced lack of correlation with the EDSS score.
As already mentioned, a limitation of the WBNAA method is its lack of localization. Because of its 6%–8% sensitivity threshold, changes in lesion loads, reported here as less than 0.5% and rarely exceeding 1% of VB,34 may go undetected. However, this limitation is a tradeoff for sensitivity to relatively small global diffuse changes that are characteristic of the brain in MS. Another issue may arise from the heterogeneity of MS. Although the patients enrolled in this study were all within 4 years of their first symptom, their overall WBNAA levels were already significantly lower than those of controls, reflecting the fact that neuronal loss and dysfunction precedes clinical diagnosis. Although we attempted to mitigate this by enrolling patients with a relatively new diagnosis of MS, lack of knowledge of their true disease duration is an unavoidable characteristic of the disease. Finally, as described in Methods, both the MRS sequence and its postprocessing tool were developed in-house, i.e., not widely distributed or supported by a commercial manufacturer. Although neither is particularly complicated, evidenced by both having been translated to several other sites,13 distribution by a commercial entity is the most reliable route for broad dissemination.
The WBNAA method used in this study is shown to be sensitive to tissue changes over time. Therefore, it could provide an additional outcome measure to clinical assessment for monitoring the treatment effect in phase III trials of patients with RR-MS, although the relationship between WBNAA and subsequent disability must be further investigated. In addition, our study suggests that because of the high pathologic specificity for neuroaxonal integrity as well as the small sample size and the relatively shorter trial duration, WBNAA could serve as an outcome measure for screening neuroprotective treatments in small proof-of-concept clinical trials.
AUTHOR CONTRIBUTIONS
Manuscript preparation: Dr. Rigotti, Dr. Inglese, N.N. Perry, Dr. Gonen. Study design and supervision: Dr. Rigotti, Dr. Grossman, Dr. Gonen. Data interpretation: Dr. Rigotti, Dr. Inglese, Dr. Kirov, E. Gorynski, Dr. Herbert, Dr. Babb, Dr. Gonen. Data acquisition: Dr. Rigotti, Dr. Kirov, N.N. Perry, Dr. Herbert. Statistical analysis: Dr. Babb. Funding: Dr. Grossman, Dr. Gonen.
DISCLOSURE
The authors report no disclosures relevant to the manuscript. Go to Neurology.org for full disclosures.
Supplementary Material
GLOSSARY
- EDSS
Expanded Disability Status Scale
- 1H-MRS
proton magnetic resonance spectroscopy
- MP-RAGE
magnetization-prepared rapid acquisition gradient echo
- MS
multiple sclerosis
- NAA
N-acetyl-l-aspartate
- RR
relapsing-remitting
- TE
echo time
- TI
inversion time
- TR
repetition time
- WBNAA
whole-brain concentration of the neural marker N-acetyl-l-aspartate
Footnotes
Supplemental data at www.neurology.org
REFERENCES
- 1. Confavreux C, Vukusic S. Natural history of multiple sclerosis: a unifying concept. Brain 2006; 129: 606– 616 [DOI] [PubMed] [Google Scholar]
- 2. Calabresi P. Multiple sclerosis and demyelinating conditions of the central nervous system. In: Goldman L, Ausiello D, eds. Cecil Medicine, 23rd ed Philadelphia: Saunders Elsevier; 2007. [Google Scholar]
- 3. Compston A, Coles A. Multiple sclerosis. Lancet 2002; 359: 1221– 1231 [DOI] [PubMed] [Google Scholar]
- 4. Kantarci OH, Weinshenker BG. Natural history of multiple sclerosis. Neurol Clin 2005; 23: 17– 38, v [DOI] [PubMed] [Google Scholar]
- 5. Lassmann H. Axonal and neuronal pathology in multiple sclerosis: what have we learnt from animal models. Exp Neurol 2010; 225: 2– 8 [DOI] [PubMed] [Google Scholar]
- 6. Mountford CE, Stanwell P, Lin A, Ramadan S, Ross B. Neurospectroscopy: the past, present and future. Chem Rev 2010; 110: 3060– 3086 [DOI] [PubMed] [Google Scholar]
- 7. Schuff N, Meyerhoff DJ, Mueller S, et al. N-acetylaspartate as a marker of neuronal injury in neurodegenerative disease. Adv Exp Med Biol 576: 241– 262, 2006; discussion 361–243 [DOI] [PMC free article] [PubMed] [Google Scholar]
- 8. Rigotti DJ, Inglese M, Gonen O. Whole-brain N-acetylaspartate as a surrogate marker of neuronal damage in diffuse neurologic disorders. AJNR Am J Neuroradiol 2007; 28: 1843– 1849 [DOI] [PMC free article] [PubMed] [Google Scholar]
- 9. Tiberio M, Chard DT, Altmann DR, et al. Metabolite changes in early relapsing-remitting multiple sclerosis: a two year follow-up study. J Neurol 2006; 253: 224– 230 [DOI] [PubMed] [Google Scholar]
- 10. Sajja BR, Narayana PA, Wolinsky JS, Ahn CW. Longitudinal magnetic resonance spectroscopic imaging of primary progressive multiple sclerosis patients treated with glatiramer acetate: multicenter study. Mult Scler 2008; 14: 73– 80 [DOI] [PubMed] [Google Scholar]
- 11. Narayana PA, Doyle TJ, Lai D, Wolinsky JS. Serial proton magnetic resonance spectroscopic imaging, contrast-enhanced magnetic resonance imaging, and quantitative lesion volumetry in multiple sclerosis. Ann Neurol 1998; 43: 56– 71 [DOI] [PubMed] [Google Scholar]
- 12. De Stefano N, Narayanan S, Francis SJ, et al. Diffuse axonal and tissue injury in patients with multiple sclerosis with low cerebral lesion load and no disability. Arch Neurol 2002; 59: 1565– 1571 [DOI] [PubMed] [Google Scholar]
- 13. Benedetti B, Rigotti DJ, Liu S, Filippi M, Grossman RI. Gonen O. Reproducibility of the whole-brain N-acetylaspartate level across institutions, MR scanners, and field strengths. AJNR Am J Neuroradiol 2007; 28: 72– 75 [PMC free article] [PubMed] [Google Scholar]
- 14. Rigotti DJ, Kirov II, Djavadi B, Perry N, Babb JS, Gonen O. Longitudinal whole-brain N-acetylaspartate concentration in healthy adults. AJNR Am J Neuroradiol 2011; 32: 1011– 1015 [DOI] [PMC free article] [PubMed] [Google Scholar]
- 15. Lublin FD, Reingold SC. Defining the clinical course of multiple sclerosis: results of an international survey: National Multiple Sclerosis Society (USA) Advisory Committee on Clinical Trials of New Agents in Multiple Sclerosis. Neurology 1996; 46: 907– 911 [DOI] [PubMed] [Google Scholar]
- 16. Hu J, Javaid T, Arias-Mendoza F, Liu Z, McNamara R, Brown TR. A fast, reliable, automatic shimming procedure using 1H chemical-shift-imaging spectroscopy. J Magn Reson B 1995; 108: 213– 219 [DOI] [PubMed] [Google Scholar]
- 17. Mikheev A, Nevsky G, Govindan S, Grossman R, Rusinek H. Fully automatic segmentation of the brain from T1-weighted MRI using Bridge Burner algorithm. J Magn Reson Imaging 2008; 27: 1235– 1241 [DOI] [PMC free article] [PubMed] [Google Scholar]
- 18. Gonen O, Viswanathan AK, Catalaa I, Babb J, Udupa J, Grossman RI. Total brain N-acetylaspartate concentration in normal, age-grouped females: quantitation with non-echo proton NMR spectroscopy. Magn Reson Med 1998; 40: 684– 689 [DOI] [PubMed] [Google Scholar]
- 19. Baslow MH. N-acetylaspartate in the vertebrate brain: metabolism and function. Neurochem Res 2003; 28: 941– 953 [DOI] [PubMed] [Google Scholar]
- 20. Moffett JR, Ross B, Arun P, Madhavarao CN, Namboodiri AM. N-acetylaspartate in the CNS: from neurodiagnostics to neurobiology. Prog Neurobiol 2007; 81: 89– 131 [DOI] [PMC free article] [PubMed] [Google Scholar]
- 21. Behar KL, Rothman DL, Spencer DD, Petroff OA. Analysis of macromolecule resonances in 1H NMR spectra of human brain. Magn Reson Med 1994; 32: 294– 302 [DOI] [PubMed] [Google Scholar]
- 22. Diggle P, Heagerty P, Liang K-Y, Zeger S. Analysis of Longitudinal Data, 2nd ed. New York: Oxford University Press; 2002. [Google Scholar]
- 23. Rigotti DJ, Inglese M, Babb JS, et al. Serial whole-brain N-acetylaspartate concentration in healthy young adults. AJNR Am J Neuroradiol 2007; 28: 1650– 1651 [DOI] [PMC free article] [PubMed] [Google Scholar]
- 24. Ge Y, Gonen O, Inglese M, Babb JS, Markowitz CE, Grossman RI. Neuronal cell injury precedes brain atrophy in multiple sclerosis. Neurology 2004; 62: 624– 627 [DOI] [PubMed] [Google Scholar]
- 25. Anderson VM, Bartlett JW, Fox NC, Fisniku L, Miller DH. Detecting treatment effects on brain atrophy in relapsing remitting multiple sclerosis: sample size estimates. J Neurol 2007; 254: 1588– 1594 [DOI] [PubMed] [Google Scholar]
- 26. Barkhof F, Calabresi PA, Miller DH, Reingold SC. Imaging outcomes for neuroprotection and repair in multiple sclerosis trials. Nat Rev Neurol 2009; 5: 256– 266 [DOI] [PubMed] [Google Scholar]
- 27. Comi G, Pulizzi A, Rovaris M, et al. Effect of laquinimod on MRI-monitored disease activity in patients with relapsing-remitting multiple sclerosis: a multicentre, randomised, double-blind, placebo-controlled phase IIb study. Lancet 2008; 371: 2085– 2092 [DOI] [PubMed] [Google Scholar]
- 28. Kappos L, Gold R, Miller DH, et al. Efficacy and safety of oral fumarate in patients with relapsing-remitting multiple sclerosis: a multicentre, randomised, double-blind, placebo-controlled phase IIb study. Lancet 2008; 372: 1463– 1472 [DOI] [PubMed] [Google Scholar]
- 29. De Stefano N, Matthews PM, Arnold DL. Reversible decreases in N-acetylaspartate after acute brain injury. Magn Reson Med 1995; 34: 721– 727 [DOI] [PubMed] [Google Scholar]
- 30. Zivadinov R, Reder AT, Filippi M, et al. Mechanisms of action of disease-modifying agents and brain volume changes in multiple sclerosis. Neurology 2008; 71: 136– 144 [DOI] [PubMed] [Google Scholar]
- 31. Narayanan S, De Stefano N, Francis GS, et al. Axonal metabolic recovery in multiple sclerosis patients treated with interferon β-1b. J Neurol 2001; 248: 979– 986 [DOI] [PubMed] [Google Scholar]
- 32. Khan O, Shen Y, Caon C, et al. Axonal metabolic recovery and potential neuroprotective effect of glatiramer acetate in relapsing-remitting multiple sclerosis. Mult Scler 2005; 11: 646– 651 [DOI] [PubMed] [Google Scholar]
- 33. Costelloe L, Thompson A, Walsh C, Tubridy N, Hutchinson M. Long-term clinical relevance of criteria for designating multiple sclerosis as benign after 10 years of disease. J Neurol Neurosurg Psychiatry 2008; 79: 1245– 1248 [DOI] [PubMed] [Google Scholar]
- 34. Li DK, Held U, Petkau J, et al. MRI T2 lesion burden in multiple sclerosis: a plateauing relationship with clinical disability. Neurology 2006; 66: 1384– 1389 [DOI] [PubMed] [Google Scholar]
Associated Data
This section collects any data citations, data availability statements, or supplementary materials included in this article.