Abstract
To determine whether oscillations in glycolysis could underlie the oscillations in O2 consumption observed in intact islets, we evaluated the capacity of an islet extract to exhibit spontaneous oscillations in glycolysis. When a cell-free extract obtained from approximately 1,000 islets was supplied with glucose and glycolytic cofactors, oscillations in NADH fluorescence were obtained. After this demonstration of spontaneous oscillations in islet extracts, we bathed permeabilized clonal β-cells in the more plentiful spontaneously oscillating glycolytic muscle extract that generates pulses of alpha-glycerophosphate and pyruvate and induces oscillations in free Ca2+ and the ATP/ADP ratio. This preparation was used to investigate whether changes in Ca2+ and possibly alpha-glycerophosphate or pyruvate supply could underlie observed oscillations in O2 consumption and explain coordination between cytosolic and mitochondrial metabolism. We found that oscillations of O2 consumption and Ca2+ of a similar period were induced. Removal of medium Ca2+ with EGTA did not prevent the oscillations in O2 consumption nor were they greatly affected by the substantial rise in medium Ca2+ on treatment with thapsigargin to inhibit sequestration into the endoplasmic reticulum. The O2 oscillations were also not eliminated by the addition of relatively high concentrations of pyruvate or alpha-glycerophosphate. However, they were lost on addition of fructose-2,6-P2 at concentrations that prevent oscillations of glycolysis and the ATP/ADP ratio. Addition of a high concentration of ADP increased O2 consumption and also prevented O2 oscillations. These results suggest that the changes in respiration reflected in the O2 oscillations occur in response to the oscillations in the ATP/ADP ratio or ADP concentration and that this parameter is a primary regulator of O2 consumption in the pancreatic β-cell.
INTRODUCTION
Insulin secretion in vivo, in the perfused pancreas, and by groups of perifused islets is pulsatile (1-3). Similar oscillations in intracellular free Ca2+ and O2 consumption have been observed in glucose-stimulated perifused islets (1,4). Ca2+ oscillations have also been seen in single β-cells stimulated with glucose (5-7). We have suggested that these oscillatory phenomena may derive from oscillatory metabolism of glucose, such as has been demonstrated in extracts of skeletal muscle (8-12), heart (13), and yeast (14,15), as well as in intact yeast (16-18) and ascites cells (19). The mechanism of the oscillations in skeletal muscle extracts involves a rather unusual form of enzyme regulation in which the product activates the enzyme. Autocatalytic, AMP-dependent activation of the key glycolytic enzyme phosphofructokinase (PFK) by its product, fructose-1,6-P2, has been well documented, and its role is supported by observations that the oscillations can be blocked by addition of sufficiently high concentrations of fructose-2,6-P2 or glucose-1,6-P2 (10,11), activators that are natural analogs of fructose-1,6-P2 and compete for the same regulatory side on PFK. There are three mammalian isoforms of PFK with differing tissue distribution (20,21). Adult muscle has only the M-type subunit, and liver has mainly the L-type subunit. Brain has C-type as well as M- and L-type subunits. Skeletal muscle PFK is strongly activated by micromolar levels of fructose-1,6-P2 (22,23), whereas there is little, if any, activation of liver or platelet PFK (mainly C- and L-type subunits) in the presence of near physiological concentrations of ATP (several millimolar) and AMP and fructose-6-phosphate (micromolar) (24). Our recent Western blots of pancreatic islets and clonal β-cells (INS-1) showed the presence of both M- and C-type isoforms, with perhaps a smaller amount of L-, and kinetic studies demonstrated that the activity under near-physiological conditions was dominated by the M-type fructose-1,6-P2 activatable form (25). Thus, the autocatalytic activation of PFK by micromolar levels of fructose-1,6-P2, which is the basis of the glycolytic oscillations in the muscle extract system, should be expected to occur in islets. Because of the limited amount of islet material obtainable, oscillations were examined by NADH fluorescence, a sensitive technique frequently used to monitor glycolytic oscillations in other cell types. We previously used a model experimental system consisting of permeabilized clonal pancreatic β-cells incubated in a synthetic cytosol containing oscillatory glycolyzing muscle extract; under these conditions, oscillations in free Ca2+ were generated (26). Because such permeabilized cells maintain mitochondrial function, we examined this model system for oscillations in O2 consumption. The behavior of the oscillatory muscle extract has been well characterized; it also produces pulses of the mitochondrial substrates pyruvate and alpha-glycerophosphate (8,9), as well as oscillations in the ATP/ADP ratio or ADP concentration (9-12). Furthermore, several of the mitochondrial dehydrogenases are activated by Ca2+ (27-32). We therefore tested which of these factors was involved in generating the observed oscillations in O2 consumption. Our data demonstrate that an islet extract exhibits spontaneous metabolic oscillations like the muscle extract, and using the muscle extract, oscillations in respiration by the permeabilized cells are indeed driven by the glycolytic oscillations. Removal or elevation of Ca2+ or the addition of high saturating concentrations of mitochondrial substrate did not dampen the O2 oscillations. In contrast, inhibition of glycolytic oscillations with fructose-2,6-P2 or stimulation of maximal rates of respiration with ADP eliminated oscillations in O2 consumption, suggesting that the ATP/ADP ratio or ADP concentration is probably the dominant regulator of these oscillations.
RESEARCH DESIGN AND METHODS
Isolation, extraction, and assessment of islets
Islets were prepared by collagenase digestion as described previously (1). Islet extracts were prepared by placing islets in a microfuge tube, washing with Hanks’ buffer, removing as much medium as possible, and freezing until the day of use. Islets suspended in 0.2 ml/1,000 islets of 15 mmol/l potassium phosphate, pH 7.0, 100 mmol/l KCl, and 1 mmol/l dithiothreitol were sonicated for 10 s in ice and centrifuged for 5 min in a microfuge.
Oscillations were induced in a reaction mixture containing ATP, MgCl2, NAD, potassium phosphate, KCl, and HEPES buffer and a 50% volume of islet extract in a total volume of 70 μl. Hexokinase and apyrase were added as needed to achieve the desired rates of ATP usage and glucose phosphorylation.
Glycolytic oscillations were monitored by pyridine nucleotide fluorescence (9,15,16) using a Farrand fluorometer.
Growth and incubation of HIT cells
Clonal pancreatic β-cells (HIT-T 15) were cultured in RPMI 1640 medium supplemented with 50 U/ml penicillin, 50 μg/ml streptomycin, and 10% fetal calf serum (33). Cells were used between passages 64 and 80, harvested with phosphate-buffered saline containing 0.02% EDTA, and washed in Hanks’ Ca2+-Mg2+-free buffer, pH 7.4. Cells were incubated at 30°C in a buffer containing an oscillating glycolytic muscle extract (high speed supernatant fraction, gel filtered to remove endogenous metabolites) (12) in a total volume of 1.7 ml. Although we provide evidence of metabolic oscillations in islet extracts, the muscle extract has two important advantages as a reagent at this point: it is easily prepared in sufficient quantity, and it has been well characterized (8-12) and already used successfully with permeabilized clonal β-cells (26). Saponin (60-80 μg/ml) was added to selectively permeabilize the plasma membrane of cells in suspension. The precise concentration used was the minimum amount required to permeabilize the plasma membrane within 5 min without altering the Ca2+ set point (33).
Oxygen consumption
O2 consumption was measured using a Clark type electrode with an amplifier designed and built by the Bio-Instrumentation Group of the University of Pennsylvania in a stirred water-jacketed open chamber. An open chamber was used in these studies, since otherwise the total O2 of the chamber was consumed too quickly to allow observation of multiple oscillations. Air was blown over the top surface of the solution at a rate sufficient to balance average O2 use such that a concentration of O2 in the chamber of ~150 μmol/l was maintained.
Thus, a rise in the O2 traces shown indicates a decreased rate of O2 consumption, and a fall in the trace indicates an increased rate of O2 consumption compared with the average.
Ca2+ measurements
Ca2+ was measured in permeabilized cells in the presence of 2 μmol/l free fura 2 added to the buffer. Ca2+ values were calculated from the fura 2 signals at excitation wavelengths of 340 and 380 nm and emission at 510 nm (34) using a time-sharing fluorometer designed and built by the Bio-Instrumentation Group of the University of Pennsylvania (35).
Metabolite assays
Samples (0.1 ml) of the reaction mixture were deproteinized and assayed by enzymatic methods, as described previously (8,9), using a Hewlitt Packard model 8450 spectrophotometer system set to read A335-345 minus A390-400. A new specific method was used to assay ADP separate from GDP (36).
Materials
RPMI 1640 media, penicillin, and streptomycin were from Gibco. Fetal calf serum was obtained from Hyclone Laboratories. Fura 2 (free acid) was obtained from Molecular Probes (Eugene, OR). Thapsigargin was from Calbiochem. All other biochemicals were from Sigma or Boehringer Mannheim.
RESULTS
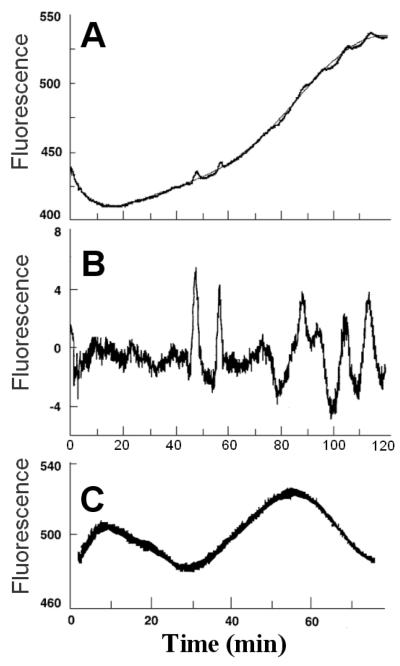
Figure 1 illustrates spontaneous oscillations in NADH fluorescence in islet extracts supplied with ATP, NAD, hexokinase, and glucose.
Figure. 1. Oscillations in NADH fluorescence in a cell-free supernatant prepared from isolated rat islets.
A and B are traces obtained from the same extract, and C represents a separate extract. The raw data in A were fitted with a 6th order polynomial (narrow line), which was subtracted out in B to show the repetitive oscillations more clearly. Data are arbitrary fluorescence units. The reaction mixture contained 1 mmol/l ATP, 1 mmol/l MgCl2, 20 mmol/l HEPES, pH 7.1, 100 mmol/l KCl, 7.5 mmol/l potassium phosphate, 10 mmol/l glucose, 0.5 mmol/l NAD, 0.06 U/ml crystalline yeast hexokinase (gel filtered in 20 mmol/l HEPES), 0.04 U/ml apyrase (an ATPase), and islet extract equivalent to 50% of the volume. In C, the HEPES buffer was pH 7.2. Reactions were started by adding hexokinase, apyrase, and islet extract in rapid succession.
The three panels show data obtained from two different preparations of ~1,000 islets. Figures 1A and B were from the same preparation and Fig. 1C from a separate preparation. Figure 1A shows repetitive oscillations superimposed on an upward drift that may be due to mitochondrial contamination. To show the oscillations more clearly, the raw data in Fig. 1A were fitted with a polynomial function (narrow line), which was then subtracted out in Fig. 1B.
It should be noted that glycolytic oscillations in extracts show a considerable range of periods and amplitudes, depending on the particular extract and the experimental conditions, especially factors affecting phosphofructokinase activity (9,11,12,37). Furthermore, there may be a considerable lag after the reaction is started before the oscillations begin, most likely to allow suitable shifts in metabolite concentrations to bring them into the oscillatory region for phosphofructokinase. Thus, the data in Fig. 1 are consistent with our prior observations of oscillations in skeletal muscle extracts.
Oscillations in NADH fluorescence have been associated with every oscillating glycolytic system so far studied and have in fact been used for monitoring the yeast and heart extract systems. Oscillations in NADH fluorescence have also been reported in single β-cells on stimulation with glucose (5). Importantly, the initial rise in NADH preceded that of Ca2+, consistent with Ca2+ changes being secondary to metabolic coupling factors. The data indicate that a cell-free islet extract, like the cell-free skeletal muscle extract, is capable of generating spontaneous oscillations of glycolysis. However, the large amount of material required made it impractical to use such islet extracts in the following studies of oxygen consumption by permeabilized clonal β-cells (HIT). To obviate this constraint, experiments were performed using skeletal muscle extract.
As illustrated in Figure 2, when the permeabilized HIT cells were incubated in a spontaneously oscillating glycolytic extract and oscillations in Ca2+ were observed (bottom trace), then O2 consumption also oscillated (top trace) and with the same period.
Figure. 2. Oscillations in free Ca2+ and Oxygen consumption in permeabilized HIT cells induced by an oscillating glycolytic muscle extract.
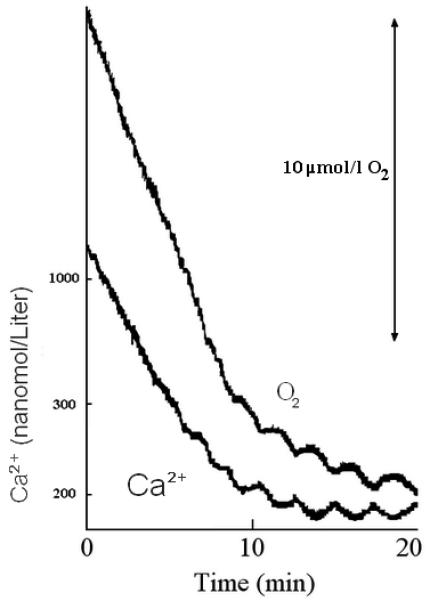
The reaction mixture contained 2 μmol/l fura 2 (free acid), 2 mmol/l sodium ATP, 3 mmol/l MgCl2, 20 mmol/l HEPES adjusted to pH 7.1 with KOH, 97 mmol/l KCl, 5 mmol/l KHCO3, 6.5 mmol/l potassium phosphate, 0.3 mmol/l GTP, 4 mmol/l sodium aspartate, 10 mmol/l glucose, 30 μmol/l NAD, 0.2 U/ml crystalline yeast hexokinase (gel filtered in 20 mmol/l HEPES), rat muscle extract equivalent to 1 mg of protein per milliliter, ~80 mg/ml saponin, and HIT cells equivalent to ~1 mg protein per milliliter. The reaction was started by addition of muscle extract, saponin, and hexokinase in rapid succession. Free Ca2+ was measured using the fluorescent signals of fura 2 and O2 consumption using an O2 electrode. Note that air was blown over the surface of the solution to balance the average rate of O2 consumption; thus, a rise in the trace indicates a decreased rate of O2 consumption, and a fall in the trace indicates an increased rate of O2 consumption, compared with the average. These traces are representative of experiments that were repeated at least three times.
When the cells are permeabilized, Ca2+ is taken up by the endoplasmic reticulum Ca2+-ATPase and the free concentration in the medium declines and approaches a set point, which is in part determined by the ATP/ADP ratio (33,34); in this case, because of the oscillations in glycolysis and the ATP/ADP ratio, Ca2+ does not remain constant but oscillates. We previously showed a strong correlation between Ca2+ and the ATP/ADP ratio in permeabilized clonal β-cells, a high ATP/ADP ratio promoting Ca2+ sequestration (26,34). The inverse correlation of Ca2+ and oxygen changes during the oscillations in Fig. 2 suggests that oxygen consumption may be enhanced by low ATP/ADP ratios and relatively suppressed at high ATP/ADP ratios. This is consistent with our recent results of effects of different fixed ATP/ADP ratios on oxygen consumption in permeabilized HIT cells (38). The correlation of oxygen consumption and ATP/ADP ratio could not be determined directly in the oscillating system because sampling for measurement of the nucleotides would disrupt the oxygen measurements. As noted above, and illustrated in Fig. 2, there may be a considerable lag before oscillations begin, and furthermore, it takes some time after permeabilization for Ca2+ and oxygen to reach near plateaus around which they oscillate. Thus, the subsequent oxygen traces shown are portions from the plateau phases.
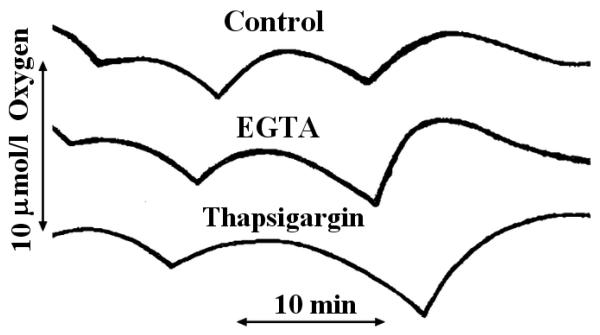
Removal of Ca2+ with EGTA (Fig. 3) had little effect on the oscillations in Oxygen use (amplitude, 118 ± 51%; period, 85 ± 23% of same-day control; mean ± SD, n = 5), even though EGTA lowers the free Ca2+ to <10 nmol/l and eliminates Ca2+ oscillations. Under control conditions, free Ca2+ oscillates in the range of 100-200 nmol/l (26,33); however, it is likely that higher levels of Ca2+ may be reached in response to stimulatory concentrations of glucose in intact cells.
Figure. 3. Effect of different concentrations of Ca2+ on oscillations in O2 consumption.
Conditions were similar to those described for Fig. 2, except that fura 2 was omitted and EGTA (2 mmol/l) or thapsigargin (3 μmol/l) was added as indicated. These traces are representative of experiments that were repeated at least three times.
To assess the influence of higher Ca2+ concentrations on the oscillations of O2 consumption in our permeabilized cell system, we inhibited the endoplasmic reticulum Ca2+-ATPase with thapsigargin (39). Under these conditions the Ca2+ set point is presumably maintained by the mitochondria, rather than the endoplasmic reticulum, but at a much higher level of 500-1,000 nmol/l (40). We previously showed that thapsigargin greatly raises the Ca2+ concentration in permeabilized HIT cells under steady-state conditions (33). Like the removal of Ca2+, this treatment had little effect on the oscillations in O2 consumption (Fig. 3) (amplitude, 92 ± 27%; period, 93 ± 17% of control, n = 3). These findings indicate that variations in free Ca2+ do not generally control the rate of respiration and are not responsible for the oscillations in O2 consumption. This conclusion is supported by the relatively small effects of Ca2+ on oxygen consumption by permeabilized HIT cells under steady-state conditions (38). Furthermore, when a suspension of intact HIT cells is stimulated with glucose, the increase in oxygen consumption precedes and is not further augmented by the increase in intracellular free Ca2+(41).
In addition to oscillations in Ca2+ and the ATP/ADP ratio, the extract is characterized by pulsatile delivery of the mitochondrial substrates alpha-glycerophosphate and pyruvate. These can be metabolized by the permeabilized cells, and therefore their levels also oscillated (Fig. 4). alpha-glycerophosphate increased when its precursor, dihydroxyacetone-phosphate, was high. Pyruvate decreased as dihydroxyacetone-phosphate rose, perhaps in part because of the use of pyruvate to reoxidize the pulse of NADH that occurs when phosphofructokinase is activated and flux through glyceraldehyde-3-phosphate dehydrogenase suddenly increases (8,9). The repeated activation of phosphofructokinase that generates the metabolite oscillations is indicated by the decreases in glucose-6-phosphate (which is in equilibrium with fructose-6-phosphate) and corresponding increases in dihydroxyacetone-phosphate (which is in equilibrium with fructose-1,6-P2).
Figure. 4. Oscillations in alpha-glycerophosphate (a-GP), pyruvate, dihydroxyacetone-phosphate (DHAP), glucose-6-phosphate (G6P), ATP, and ADP.
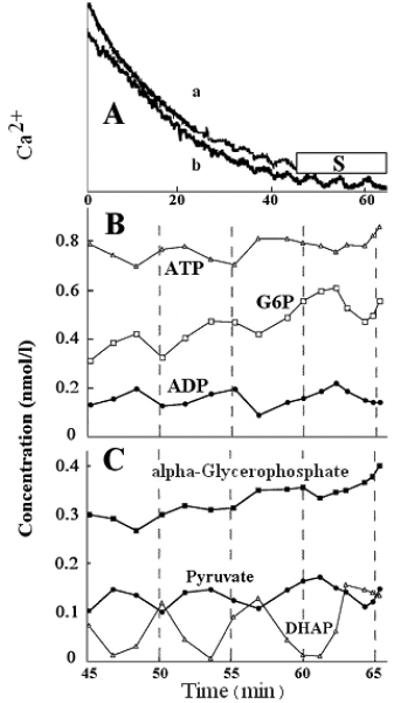
Conditions were similar to those described for Fig. 2. The development of oscillations was monitored by following changes in Ca2+ by fura 2 fluorescence. In one experiment, after several oscillations in Ca2+ were seen (A, trace a), samples were taken in interval S at the times indicated by the experimental points in B and C and deproteinized and assayed for the metabolites. The sampling disrupted the fluorescence trace. Trace b shows the Ca2+ oscillations in a similar reaction mixture run previously and not sampled for metabolites. The Ca2+ scale ranges from ~ 100-1,000 nmol/l, but the traces have been offset.
To test the possibility that the fluctuations in mitochondrial fuels caused the observed oscillations in O2 consumption, we added high concentrations of pyruvate or alpha-glycerophosphate (10 times the levels in Fig. 4) to markedly dampen the influence of their pulsatile production from glucose. These additions did not inhibit the O2 oscillations (Fig. 5) (pyruvate: amplitude, 103 ± 30%; period, 108 ± 21% of control, n = 5; alpha-glycerophosphate: amplitude, 101 ± 21%; period, 99 ± 27% of control, n = 4). Thus, mitochondrial fuel supply does not appear to be the dominant factor regulating oscillations in our system under these conditions. Clearly although the rate of respiration can be affected by substrate supply, the oscillations here are not.
Figure. 5. Effect of high concentrations of alpha-glycerophosphate or pyruvate on oscillations in O2 consumption.
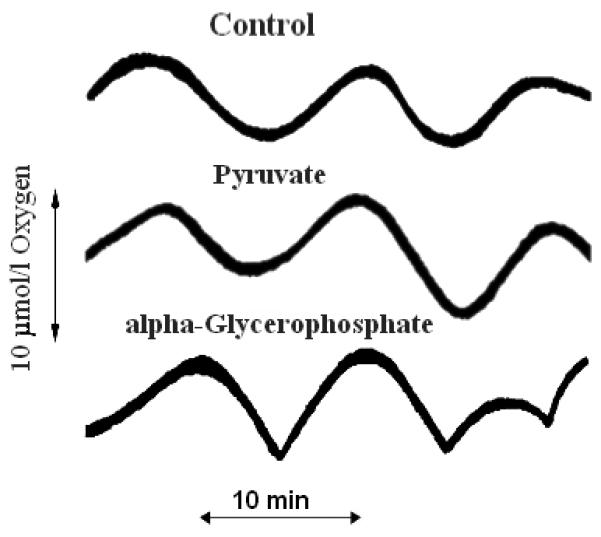
Conditions were similar to those described for Fig. 2, except that fura 2 was omitted and 5 mmol/l alpha-glycerophosphate or 1 mmol/l pyruvate was added as indicated. These traces are representative of experiments that were repeated at least three times.
To demonstrate that the O2 oscillations could be inhibited in a rather simple manner that does not involve poisoning or greatly altering the metabolic state of the mitochondria, we added fructose-2,6-P2. High concentrations of fructose-2,6-P2 prevent glycolytic oscillations by competing with fructose-1,6-P2 for an activator site on phosphofructokinase, thereby preventing the autocatalytic activation of the enzyme; this leads to continuous flow through the glycolytic pathway rather than the normal pulsatile flux (10). Similar results are seen with another analog, glucose-l,6-P2 (11). Importantly the associated oscillations in the ATP/ADP ratio and ADP concentration are eliminated, being replaced with steady-state values of intermediate magnitude (10,11). Addition of fructose-2,6-P2 in the permeabilized cell system also blocked oscillations in O2 consumption (Fig. 6A). This experiment confirms that the O2 oscillations are metabolically generated and are not a consequence of artifacts such as pulsating air flow or electrical oscillations in the measuring equipment.
Figure. 6. Effect of fructose-2,6-P2 (A) or ADP (B) on oscillations in O2 consumption.
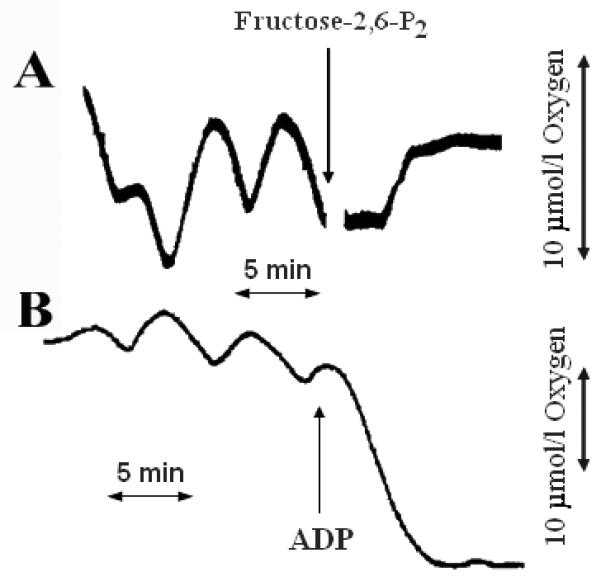
Conditions were similar to those described for Fig. 2, except that fura 2 was omitted and 100 μmol/l fructose-2,6-P2 (A) or 1 mmol/l ADP (B) was added at the time indicated by the arrow. These traces are representative of experiments that were repeated at least three times.
A high concentration of ADP (1 mmol/l) maximally stimulates mitochondrial respiration and should make it independent of the micromolar fluctuations in ADP caused by glycolytic oscillations. Indeed, addition of ADP increased respiration and blocked the oscillations (Fig. 6B). It should be noted that because these experiments were performed in an open system, the resupply of O2 from the air prevented cells from becoming anoxic, even when respiring in the presence of large amounts of ADP. These data also indicate that ADP limits respiration under the conditions of these experiments and thus may be the dominant factor linking oscillatory glycolysis to oscillatory O2 consumption.
DISCUSSION
In the studies presented here, the oscillations in O2 consumption by the permeabilized HIT cells were induced by the oscillatory glycolyzing extract in which they were placed. However, intact β-cells or islets also exhibit oscillations in O2 consumption, as well as oscillations in membrane potential, intracellular free Ca2+, and insulin secretion. The pulsatile character of insulin secretion is seen in vivo in normal individuals and is lost in some type II diabetic patients and their near relatives (42), a fact that suggests its physiological importance.
We have proposed that the basis of all these oscillatory phenomena is the same as in the model system used here, namely oscillatory metabolism of glucose. We suggest that it is the changes in ADP associated with glycolytic oscillations that most likely cause repeated opening and closing of ATP-sensitive K channels (43) and thus the changes in membrane potential and Ca2+ fluxes. The Ca2+ rises in turn are important for the secretory process and also for activating mitochondrial dehydrogenases, shifting the metabolic stance to favor the production of additional signaling compounds, such as malonyl CoA and long-chain acyl CoA (44). However, it is also ADP that appears to be the major controller of the oscillations in O2 consumption, rather than the mitochondrial substrates or Ca2+ activation of the dehydrogenases. The overall increase in O2 consumption in glucose-stimulated islets presumably reflects the increased ATP utilization by the exocytotic secretory process and perhaps ion pumping, as well as the increase in substrate supply. The apparent paradox is that enhanced O2 consumption would require a rise in the ADP concentration, whereas closure of ATP-sensitive K channels would require a decrease in ADP. The resolution of this paradox may well lie in the oscillatory behavior of glycolysis and the energy state, whereby ADP concentrations alternate between high and low values. The observed oscillations in membrane potential and O2 consumption in intact cells are consistent with such alternating control. Our recent demonstration of oscillations in the ATP/ADP ratio and glucose-6-phosphate in a suspension of β-cells, correlating with oscillations in intracellular free Ca2+, further supports this proposal (45). The present studies with permeabilized cells obviously do not test whether the glucose-induced oscillations in Ca2+ and insulin release in intact islets are indeed due to glycolytic oscillations; they are useful for showing the responses of mitochondrial metabolism to putative coupling factors that may link O2 consumption to these other oscillating parameters.
ACKNOWLEDGMENTS
This work was supported by a grant from the Juvenile Diabetes Foundation (to B.E.C.), U.S. Public Health Service Grants DK35914 (to B.E.C.) and DK31559 (to K.T.), and grants from the Upjohn Company (to B.E.C.).
ABBREVIATIONS
- PFK
phosphofructokinase
- ADP
Adenosine Diphosphate
- Oxygen
O2
- a-glycerophosphate
alpha-glycerophosphate
Footnotes
Contributions: Vildan N. Civelek, [M.D., Endocrinologist, Ph.D.; Prof. Dr. of Biochemistry and Medicine, Project Leader], Jude T. Deeney, [Ph.D.; Assoc. Prof., Project Leader], Glenn E. Fusonie [M.D.; Senior Microsurgery Fellow, Project Leader], Barbara E. Corkey, [Ph.D.; Prof. Dr. of Biochemistry and Medicine, Project Leader, President], and Keith Tornheim, [Ph.D.; Prof. Dr. of Biochemistry and Medicine, Project Leader].
REFERENCES
- 1.Longo EA, Tornheim K, Deeney JT, Varnum BA, Tillotson D, Prentki M, Corkey BE. Oscillations in cytosolic free Ca2+, oxygen consumption, and insulin secretion in glucose-stimulated rat pancreatic islets. J Biol Chem. 1991;266:9314–9319. [PubMed] [Google Scholar]
- 2.Weigle DS. Pulsatile secretion of fuel-regulatory hormones. Diabetes. 1987;36:764–775. doi: 10.2337/diab.36.6.764. [DOI] [PubMed] [Google Scholar]
- 3.Lefèbvre PJ, Paolisso G, Scheen AT, Henquin JC. Pulsatility of insulin and glucagon release: physiological significance and pharmacological implications. Diabetologia. 1987;30:443–452. doi: 10.1007/BF00279610. [DOI] [PubMed] [Google Scholar]
- 4.Valdeolmillos M, Santos RM, Contreras D, Soria B, Rosario LM. Glucose-induced oscillations of intracellular Ca2+ concentration resembling bursting electrical activity in single mouse islets of Langerhans. FEBS Lett. 1989;259:19–23. doi: 10.1016/0014-5793(89)81484-x. [DOI] [PubMed] [Google Scholar]
- 5.Pralong WF, Bartley C, Wollheim CB. Single islet β-cell stimulation by nutrients: relationship between pyridine nucleotides, cytosolic Ca2+ and secretion. EMBO J. 1990;9:53–60. doi: 10.1002/j.1460-2075.1990.tb08079.x. [DOI] [PMC free article] [PubMed] [Google Scholar]
- 6.Grapengiesser E, Gylfe E, Hellman B. Glucose-induced oscillations of cytoplasmic Ca2+ in the pancreatic β-cell. Biochem Biophys Res Commun. 1988;151:1299–1304. doi: 10.1016/s0006-291x(88)80503-5. [DOI] [PubMed] [Google Scholar]
- 7.Grapengiesser E, Gylfe E, Hellman B. Three types of cytoplasmic Ca2+ oscillations in stimulated pancreatic β-cells. Arch Biochem Biophys. 1989;268:404–407. doi: 10.1016/0003-9861(89)90602-4. [DOI] [PubMed] [Google Scholar]
- 8.Tornheim K, Lowenstein JM. The purine nucleotide cycle IV: interaction with oscillations of the glycolytic pathway in muscle extracts. J Biol Chem. 1974;249:3241–3247. [PubMed] [Google Scholar]
- 9.Tornheim K, Lowenstein JM. The purine nucleotide cycle: control of phosphofructokinase and glycolytic oscillations in muscle extracts. J Biol Chem. 1975;250:6304–6314. [PubMed] [Google Scholar]
- 10.Tornheim K. Fructose 2,6-bisphosphate and glycolytic oscillations in skeletal muscle extracts. J Biol Chem. 1988;263:2619–2624. [PubMed] [Google Scholar]
- 11.Andrés V, Schultz V, Tornheim K. Oscillatory synthesis of glucose 1,6-bisphosphate and frequency modulation of glycolytic oscillations in skeletal muscle extracts. J Biol Chem. 1990;265:21441–21447. [PubMed] [Google Scholar]
- 12.Tornheim K, Andrés V, Schultz V. Modulation by citrate of glycolytic oscillations in skeletal muscle extracts. J Biol Chem. 1991;266:15675–15678. [PubMed] [Google Scholar]
- 13.Frenkel R. Control of reduced diphosphopyridine nucleotide oscillations in beef heart, extracts. II. Oscillations of glycolytic intermediates and adenine nucleotides. Arch Biochem, Biophys. 1968;125:157–165. doi: 10.1016/0003-9861(68)90650-4. [DOI] [PubMed] [Google Scholar]
- 14.Das J, Busse HG. Analysis of the dynamics of relaxation type oscillation in glycolysis of yeast extracts. Biophys J. 1991;60:369–379. doi: 10.1016/S0006-3495(91)82062-8. [DOI] [PMC free article] [PubMed] [Google Scholar]
- 15.Chance B, Schoener B, Elsaesser S. Metabolic control phenomena involved in damped sinusoidal oscillations of reduced diphosphopyridine nucleotide in a cell-free extract of Saccharomyces carlsbergensis. J Biol Chem. 1965;240:3170–3181. [PubMed] [Google Scholar]
- 16.Hess B, Boiteux A. Oscillatory phenomena in biochemistry. Anna Rev Biochem. 1971;40:237–258. doi: 10.1146/annurev.bi.40.070171.001321. [DOI] [PubMed] [Google Scholar]
- 17.Hess B, Boiteux A, Kruger J. Cooperation of glycolytic enzymes. Adv Enz Regul. 1969;7:149–167. doi: 10.1016/0065-2571(69)90016-8. [DOI] [PubMed] [Google Scholar]
- 18.Betz A, Chance B. Phase relationship of glycolytic intermediates in yeast cells with oscillatory metabolic control. Arch Biochem Biophys. 1965;109:585–594. doi: 10.1016/0003-9861(65)90404-2. [DOI] [PubMed] [Google Scholar]
- 19.Ibsen KH, Schiller KW. Oscillations of nucleotides and glycolytic intermediates in aerobic suspensions of Erlich ascites tumor cells. Biochim Biophys Acta. 1967;131:405–407. doi: 10.1016/0005-2728(67)90156-9. [DOI] [PubMed] [Google Scholar]
- 20.Foe LG, Kemp RG. Isolation and characterization of phosphofructokinase C from rabbit brain. J Biol Chem. 1985;260:726–730. [PubMed] [Google Scholar]
- 21.Dunaway GA, Kasten TP. Nature of the subunits of the 6-phosphofructo-l-kinase isoenzymes from rat tissues. Biochem J. 1987;242:667–671. doi: 10.1042/bj2420667. [DOI] [PMC free article] [PubMed] [Google Scholar]
- 22.Tornheim K, Lowenstein JM. Control of phosphofructokinase from rat skeletal muscle: effects of fructose diphosphate, AMP, ATP and citrate. J Biol Chem. 1976;251:7322–7328. [PubMed] [Google Scholar]
- 23.Tornheim K. Activation of muscle phosphofructokinase by fructose 2,6-bisphosphate and fructose 1,6-bisphosphate is differently affected by other regulatory metabolites. J Biol Chem. 1985;260:7985–7989. [PubMed] [Google Scholar]
- 24.Underwood AH, Newsholme EA. Properties of phosphofructokinase from rat liver and their relationship to the control of glycolysis and gluconeogenesis. Biochem, J. 1965;95:868–875. doi: 10.1042/bj0950868. [DOI] [PMC free article] [PubMed] [Google Scholar]
- 25.Yaney GC, Schultz V, Cunningham BA, Dunaway GA, Corkey BE, Tornheim K. Phosphofructokinase isozymes in pancreatic islets and clonal β-cells (INS-1) Diabetes. 1995;44:1285–1289. doi: 10.2337/diab.44.11.1285. [DOI] [PubMed] [Google Scholar]
- 26.Corkey BE, Tornheim K, Deeney JT, Glennon MC, Parker JC, Matschinsky FM, Ruderman NB, Prentki M. Linked oscillations of free Ca2+ and the ATP/ADP ratio in permeabilized RINm5F insulinoma cells supplemented with a glycolyzing cell-free muscle extract. J Biol Chem. 1988;263:4254–4258. [PubMed] [Google Scholar]
- 27.McCormack JG, Halestrap AP, Denton RM. Role of calcium ions in regulation of mammalian intramitochondrial metabolism. Physiol Rev. 1990;70:391–425. doi: 10.1152/physrev.1990.70.2.391. [DOI] [PubMed] [Google Scholar]
- 28.McCormack JG, Longo EA, Corkey BE. Glucose-induced activation of pyruvate dehydrogenase in isolated rat pancreatic islets. Biochem J. 1990;267:527–530. doi: 10.1042/bj2670527. [DOI] [PMC free article] [PubMed] [Google Scholar]
- 29.Hansford RG. Dehydrogenase activation by Ca2+ in cells and tissues. J Bioenerg Biomembr. 1991;23:823–854. doi: 10.1007/BF00786004. [DOI] [PubMed] [Google Scholar]
- 30.MacDonald MJ. High content of mitochondrial glycerol-3-phosphate dehydrogenase in pancreatic islets and its inhibition by diazoxide. J Biol Chem. 1981;256:8287–8290. [PubMed] [Google Scholar]
- 31.MacDonald MJ. Calcium activation of pancreatic islet mitochondrial glycerol phosphate dehydrogenase. Horm Metab Res. 1982;14:678–679. doi: 10.1055/s-2007-1019117. [DOI] [PubMed] [Google Scholar]
- 32.Rutter GA, Pralong WF, Wollheim CB. Regulation of mitochondrial glycerol phosphate dehydrogenase by Ca2+ within electropermeabilized insulin-secreting cells (INS-1) Biochim Biophys Acta. 1992;1175:107–113. doi: 10.1016/0167-4889(92)90016-5. [DOI] [PubMed] [Google Scholar]
- 33.Deeney JT, Tornheim K, Korchak HM, Prentki M, Corkey BE. Acyl-CoA esters modulate intracellular Ca2+ handling by permeabilized clonal pancreatic β-cells. J Biol Chem. 1992;267:19840–19845. [PubMed] [Google Scholar]
- 34.Corkey BE, Deeney JT, Glennon MC, Matschinsky FM, Prentki M. Regulation of steady-state free Ca2+ levels by the ATP/ADP ratio and orthophosphate in permeabilized RINm5F insulinoma cells. J Biol Chem. 1988;263:4247–4253. [PubMed] [Google Scholar]
- 35.Chance B, Legailais V, Sorge J, Graham N. A versatile time-sharing multichannel spectrophotometer. Anal Biochem. 1975;66:498–504. doi: 10.1016/0003-2697(75)90617-x. [DOI] [PubMed] [Google Scholar]
- 36.Tornheim K, Schultz V. Specific enzymatic spectrophotometry assay of adenosine 5′-diphosphate. Anal Biochem. 1993;211:329–330. doi: 10.1006/abio.1993.1280. [DOI] [PubMed] [Google Scholar]
- 37.Tornheim K, Lowenstein JM. The purine nucleotide cycle III: oscillations in metabolite concentrations during the operation of the cycle in muscle extracts. J Biol Chem. 1973;248:2670–2677. [PubMed] [Google Scholar]
- 38.Civelek VN, Deeney JT, Shalosky NJ, Tornheim K, Hansford RG, Prentki M, Corkey BE. Regulation of pancreatic β-cell mitochondrial metabolism: influence of Ca2+, substrate and ADP on oxygen consumption by permeabilized clonal β-cells (HIT) Biochem J. 1996;318:615–621. doi: 10.1042/bj3180615. [DOI] [PMC free article] [PubMed] [Google Scholar]
- 39.Thastrup O, Cullen PJ, Drobak BK, Hanley MR, Dawson AP. Thapsigargen, a tumor promotor, discharges intracellular Ca2+ stores by specific inhibition of the endoplasmic reticulum Ca2+-ATPase. Proc Natl Acad Sci USA. 1990;87:2466–2470. doi: 10.1073/pnas.87.7.2466. [DOI] [PMC free article] [PubMed] [Google Scholar]
- 40.Prentki M, Matschinsky FM. Ca2+, cAMP, and phospholipid-derived messengers in coupling mechanisms of insulin secretion. Physiol Rev. 1987;67:1185–1248. doi: 10.1152/physrev.1987.67.4.1185. [DOI] [PubMed] [Google Scholar]
- 41.Civelek VN, Deeney JT, Kubik K, Schultz V, Tornheim K, Corkey BE. Temporal sequence of metabolic and ionic events in glucose-stimulated clonal pancreatic β-cells (HIT) Biochem J. 1996;315:1015–1019. doi: 10.1042/bj3151015. [DOI] [PMC free article] [PubMed] [Google Scholar]
- 42.O’Rahilly S, Turner RC, Matthews DR. Impaired pulsatile secretion of insulin in relatives of patients with non-insulin-dependent diabetes. N Engl J Med. 1988;318:1225–1230. doi: 10.1056/NEJM198805123181902. [DOI] [PubMed] [Google Scholar]
- 43.Hopkins WF, Fatherazi S, Peter-Riesch B, Corkey BE, Cook DL. Two sites for adenine-nucleotide regulation of ATP-sensitive potassium channels in mouse pancreatic β-cells and HIT cells. J Membr Biol. 1992;129:287–295. doi: 10.1007/BF00232910. [DOI] [PubMed] [Google Scholar]
- 44.Prentki M, Corkey BE. Are the β-cell signaling molecules malonyl-CoA and cytosolic long-chain acyl-CoA implicated in multiple tissue defects of obesity and NIDDM? Diabetes. 1996;45:273–283. doi: 10.2337/diab.45.3.273. [DOI] [PubMed] [Google Scholar]
- 45.Nilsson T, Schultz V, Berggren P-O, Corkey BE, Tornheim K. Temporal patterns of changes in ATP/ADP ratio, glucose 6-phosphate and cytoplasmic free Ca2+ in glucose-stimulated pancreatic β-cells. Biochem J. 1996;314:91–94. doi: 10.1042/bj3140091. [DOI] [PMC free article] [PubMed] [Google Scholar]


