

Abstract
The response to stressful stimuli requires rapid, precise, and dynamic gene expression changes that must be coordinated across the genome. To gain insight into the temporal ordering of genome reorganization, we investigated dynamic relationships between changing nucleosome occupancy, transcription factor binding, and gene expression in Saccharomyces cerevisiae yeast responding to oxidative stress. We applied deep sequencing to nucleosomal DNA at six time points before and after hydrogen peroxide treatment and revealed many distinct dynamic patterns of nucleosome gain and loss. The timing of nucleosome repositioning was not predictive of the dynamics of downstream gene expression change but instead was linked to nucleosome position relative to transcription start sites and specific cis-regulatory elements. We measured genome-wide binding of the stress-activated transcription factor Msn2p over time and found that Msn2p binds different loci with different dynamics. Nucleosome eviction from Msn2p binding sites was common across the genome; however, we show that, contrary to expectation, nucleosome loss occurred after Msn2p binding and in fact required Msn2p. This negates the prevailing model that nucleosomes obscuring Msn2p sites regulate DNA access and must be lost before Msn2p can bind DNA. Together, these results highlight the complexities of stress-dependent chromatin changes and their effects on gene expression.
INTRODUCTION
All cells have to respond rapidly and specifically to stressful changes in their environment. Environmental shock often elicits massive changes in gene expression, which must be coordinated appropriately. In the budding yeast Saccharomyces cerevisiae, environmental stress triggers altered expression of genes whose condition-specific transcription is altered only by unique environments, along with a common response activated by many stresses called the environmental stress response (ESR) (13, 21, 24). These expression changes are precisely altered in timing and magnitude to produce a genomic expression program customized to each new environment. Although the timing differs for different stresses, the expression changes are often transient and adjust to near-prestress levels once cells acclimate. Several transcriptional regulators are known, including the “general-stress” transcription factors Msn2p and Msn4p that are activated by diverse stresses (reviewed in reference 21). However, the mechanisms cells use to orchestrate the timing of transcript changes are only beginning to be revealed (reviewed in references 29 and 75).
Transcription initiation is also influenced by nucleosomes positioned near and within genes (reviewed in reference 59). Most eukaryotic genes show a nucleosome-depleted region (NDR) upstream of the transcription start site (TSS), where cis-regulatory elements are exposed for binding (18, 32, 42, 61, 76). However, at many genes the functional regulatory elements are occluded by nucleosomes. While some transcription factors can compete with nucleosomes for DNA binding (17, 19, 56, 57, 60), it is often the case that occluding nucleosomes must first be removed to facilitate factor binding (reviewed in reference 70). Indeed, nucleosome occupancy typically decreases upstream of transcriptionally induced genes and increases in regulatory regions of repressed genes (31, 40, 62, 79, 81). Changes in nucleosome occupancy within gene-regulatory regions may be particularly important in regulating transcription factor access in response to environmental changes (1, 4, 15, 25, 27, 30, 50).
Despite a number of studies relating nucleosome gain or loss to gene expression changes, it is unclear how nucleosome repositioning and transcription are related temporally. A few studies have used yeast to characterize dynamic changes in global nucleosome occupancy following environmental change (34, 40, 62, 79), during the cell cycle (31), or upon meiosis (81). Taken together, these reports indicated that relatively few genomic regions showed changes in nucleosome occupancy upon stimulus. Of those that did, nucleosome loss was generally associated with promoters of induced genes, while nucleosome deposition occurred upstream of many repressed genes. Most of these studies focused on only one or a few time points and did not distinguish differences in temporal patterns. Hogan et al. did compare the dynamics seen in nucleosome reorganization to the dynamics of gene expression during cell cycle progression and found the two to be largely correlated: nucleosome changes typically occurred in the same cell cycle phase as peak transcript changes (31). Little is known about the temporal dynamics of genomic nucleosome positioning after a sudden environmental shift or how it correlates to the dynamics of transcript change.
Here, we measured nucleosome occupancy over time in yeast cells responding to hydrogen peroxide treatment, through deep sequencing of nucleosome-bound DNA at six time points during the response. We also followed dynamic binding of the stress-activated transcription factor Msn2p and dynamic changes in gene expression. By integrating temporal information across these processes, we uncovered new relationships between regulators of stress-dependent gene expression in yeast.
MATERIALS AND METHODS
Cell growth and gene expression analysis.
Wild-type BY4741 (MATa his3Δ1 leu2Δ0 met15Δ0 ura3Δ0) and msn2Δ msn4Δ (10) cells were grown in YPD medium at 30°C overnight for >10 generations. Cells were removed before stress and at 4, 8, 12, 16, 20, 30, 40, and 60 min after treatment with 0.4 mM H2O2. The response in an additional three samples at 30 min was also measured for statistical analysis. Cell lysis, RNA extraction, and cDNA synthesis were performed as previously described (22, 41) using SuperScript III (Invitrogen, Carlsbad, CA), aminoallyl-dUTP (aa-dUTP; Ambion, Austin, TX), and NHS-ester cyanine dyes (Flownamics, Madison, WI).
Nucleosomal DNA sequencing.
Nucleosomes were isolated as described in reference 49. Briefly, cells from unstressed cultures and cultures treated with 0.4 mM H2O2 for 4, 12, 20, 40, or 60 min were cross-linked with 1% formaldehyde for 15 min at room temperature and quenched with 125 mM glycine. Phosphate-buffered saline (PBS)-washed cells were then digested to spheroplasts with Zymolyase (Seikagaku Biosystems, Tokyo, Japan), and chromatin was treated with micrococcal nuclease (Worthington Biochemical, Lakewood, NJ) for 20 min at 37°C. DNA was purified as described in reference 49 and submitted to the University of Wisconsin—Madison Biotechnology Center for library preparation and sequencing. Libraries were generated using Illumina paired-end DNA sample prep kit V1 (Illumina Inc., San Diego, CA) with minimal modification. Size selection targeted 140- and 310-bp fragments to capture mono- and dinucleosomes. Clusters were generated using standard cluster kits (version 2) and an Illumina cluster station, with one sample per lane. A paired-end, 75-bp procedure was performed, using standard 36-bp SBS kits (version 3) and SCS 2.4 software and an Illumina IIx Genome Analyzer. Images were analyzed using standard Illumina Pipeline software, version 1.4.
Nucleosome occupancy in wild-type and msn2Δ msn4Δ cells was also measured using a similar protocol. Isolated DNA was then analyzed by real-time PCR as previously described (3) or fluorescently labeled and hybridized to tiled genomic arrays as described below for chromatin immunoprecipitation (ChIP).
ChIP.
ChIP was performed as described in reference 3. Briefly, cells containing integrated, C-terminally c-Myc-tagged MSN2 (generously provided by M. Snyder [53]) were grown for >10 generations. Unstressed cells and cells treated with 0.4 mM H2O2 for 4, 12, 20, 40, or 60 min were cross-linked with 1% formaldehyde for 30 min at 25°C. The lysate was sonicated to produce chromatin fragments of ∼250 to 300 bp. An aliquot of the supernatant was retained as a whole-cell extract, and 1 to 2.5 mg of protein was incubated with 5 μl of anti-c-Myc antibody (9E11; Abcam, Cambridge, MA) overnight at 4°C and treated as described in reference 3. Samples were amplified using the ligation-mediated PCR method and a mix of ∼200 μM dATP-dCTP-dGTP, ∼130 μM aaUTP, and ∼86 μM dTTP. The resultant DNA was labeled as described in reference 3 and hybridized to Nimblegen 385K arrays.
Nimblegen microarrays.
DNA from labeled gene expression or ChIP samples was mixed in equal masses with the associated labeled control, 2× Nimblegen hybridization buffer, Nimblegen Solution A, and 0.8 μl of prelabeled CPK6 alignment oligonucleotide in a 15.5 μl final volume according to the manufacturer's instructions (Roche-Nimblegen, Madison, WI). All experiments were done as competitive hybridizations, comparing gene expression samples from stressed cells to their unstressed counterparts and comparing ChIP samples to whole-cell extract. Samples were hybridized to 385K yeast tiling arrays (2006-10-12_Ansari_tiling_51mer) for 16 h on a Maui hybridization station, washed, and scanned (GenePix 4000B; Molecular Devices, Sunnyvale, CA), according to standard Nimblegen protocols.
Computational methods. (i) Identifying nucleosome positions.
Sequencing reads were aligned to the S. cerevisiae genome by the use of Bowtie (39), allowing 1 mismatch per unique read, with restricted paired-end distances between 90 and 400 bp. The pileup function of Maq (43) was used to assign coverage (reads/base pair), which was scaled by the total number of reads per lane. Nucleosome positions were identified at each time point using a nonhomogenous hidden-state model of the first-order difference as described in reference 35. All nucleosome positions identified by this method are available in Table S1 in the supplemental material. Nucleosomes from different time points with greater than 75% overlap were considered to be in the same position in the metaset. Nucleosomes identified in the metaset and occupancy values are available in Table S2 in the supplemental material. Nucleosome occupancy was calculated for each nucleosome at each time point as the average number of reads per base pair over the length of the nucleosome, and the log2 difference was calculated at each time point relative to unstressed cell data. When a nucleosome was not called at one or more time points, changes in occupancy were based on the average number of reads per base pair in that region, using the average start and end positions for nucleosomes called at that position at other time points. To compare data to previously reported nucleosome maps, we identified nucleosomes whose center-to-center distances were within ±20 bp or 37 bp of those of nucleosomes reported in other studies (2, 32, 68). Technical and biological reproducibility was high, as shown in Fig. S1 in the supplemental material. Nucleosome positions and occupancy changes are also provided in genome browser-compatible bed files (see Table S3 in the supplemental material).
(ii) Identifying nucleosome changes and dynamics.
Nucleosome-bound regions with significant changes were identified by a Wilcoxon rank sum test based on the number of reads per base pair in the nucleosome-bound region, comparing each time point to the equivalent data from unstressed cells. Nucleosomes with a q of <0.01 that also showed a 1.5-fold change or greater at two or more time points were selected; of these nucleosome changes, those that were contradicted in two replicate 30-min samples hybridized to tiled-genome arrays (unpublished data) were excluded from analysis, leaving 9,509 high-confidence repositioned nucleosomes. These nucleosomes were organized by model-based multinomial clustering, using the VII model in mclust and the Bayesian information criterion (BIC) to identify 25 unique clusters (20). The cluster centroids were organized by hierarchically clustering, and the main clusters were collapsed into eight clusters. Two clusters did not fall into larger groups—as these did not show any statistically significant enrichments, they are not discussed further. For each nucleosome-bound region, the peak change in occupancy was defined as the time point with the greatest difference in signal compared to the data from unstressed cells.
(iii) Gene expression analysis.
Transcript abundance was measured as the median log2 ratio of data from all probes fully contained within the length of the transcript (defined in references 32 and 71 to 74). Previous annotations of 4,321 noncoding RNA transcripts (ncRNA) (71–74) were measured using all probes, excluding those that could be assigned to mRNAs. Log2 changes in transcript abundance were median centered across all transcripts. Genes whose expression was affected by H2O2 treatment were identified as those with significant (q < 0.01) changes at 30 min using the Bioconductor programs limma (63) and q value (66) or those with at least two time points with an expression change of at least 1.5-fold. This identified 4,440 coding transcripts and 2,479 ncRNAs that changed significantly during the time course (see Table S4 in the supplemental material).
(iv) Identifying ChIP-chip peaks.
ChIP-chip data were normalized, and peaks were identified from each time point using the Java implementation of MA2C (64) with the Robust setting and C of 2. Peaks identified at multiple time points with more than 75% overlap were considered to represent the same peak. Peak boundaries were defined as the narrowest region of overlap among all time points at which a peak was called. Msn2p occupancy was defined for each time point as the average log2 median-centered ratio of microarray signals (ChIP versus whole-cell extract) over the length of the peak. Changes in occupancy were calculated relative to the corresponding signal in unstressed cells; loci that showed an increase in Msn2p binding of 1.5-fold for at least two time points were selected for further analysis. The identified peaks are available in Table S5 in the supplemental material.
(v) Identifying positions relative to genes and the transcription start site.
Nucleosomes were assigned to regions upstream or downstream or within open reading frames (as defined in reference 32) if the nucleosome center fell within those regions. Unless otherwise noted, “upstream” and “downstream” regions were defined as 800 bp upstream and 300 bp beyond the transcript stop, respectively.
Msn2-Myc peaks (see Fig. 6) whose centers fell within a region from bp −1000 to +100 with respect to the transcription start site (defined in reference 32) were considered upstream of the gene. Similarly, peaks whose centers fell within a region between bp −100 and bp +500 from a gene's transcription termination site were considered downstream of the gene. Peaks centered between the bp +100 and −100 region of the open reading frame were considered to be within the gene.
Fig 6.
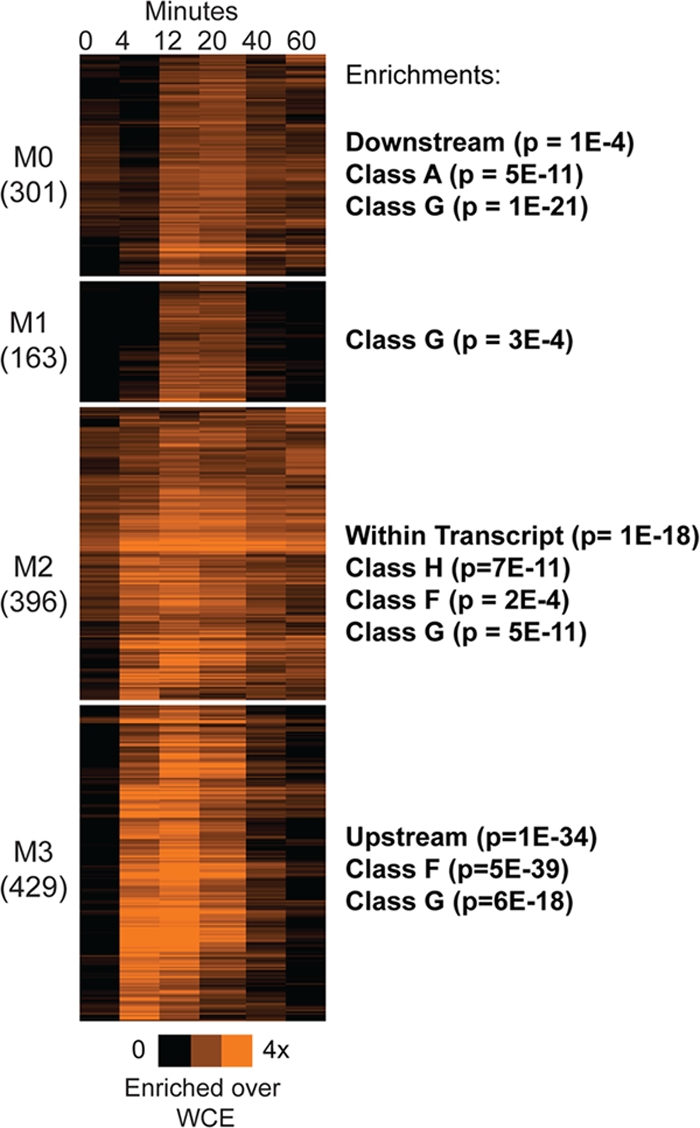
Msn2p binds with different dynamics to different loci. K-means clustering (k = 4) of Msn2p-bound regions at each time point (listed above the heat map) is shown in orange according to the color bar, which represents enrichment of Msn2p-bound fragments relative to whole-cell extract (WCE). Enrichment of nucleosomes from various classes is shown to the right of each cluster.
To identify the distribution of nucleosome positions relative to the TSS for each dynamic class, the region surrounding each TSS from bp +1000 to −1000 was divided into 20-bp windows with 10 bp of overlap. The fraction of nucleosomes from each class was then calculated in each bin. Association with transcription factor binding sites was performed using position-weight matrices for 30 different cis-regulatory elements (23) and the program Fimo (7) to identify instances of each matrix in gene upstream regions. Given the low sequence complexity of the stress response elements (STREs), exact matches to CCCCT were also subjected to genome-wide mapping. Data for genes whose upstream regions were bound by different chromatin regulators were taken from reference 67 using a false-discovery-rate (FDR) cutoff of 0.05, and P values of enrichment are available in Table S6 in the supplemental material. The probability of overlap in gene groups that was equal to or greater than observed was assessed using the hypergeometric distribution by comparisons to the total set of genes with significant expression changes or, where indicated, to the separate sets of significantly induced or repressed genes.
Microarray data accession numbers.
All microarray and sequencing data have been deposited in the NIH GEO database under superseries accession number GEO:GSE30901. Subseries accession numbers are GEO:GSE30899 (gene expression data), GEO:GSE30900 (sequencing data), GEO:GSE30898 (Msn2p ChIP-chip data), and GEO:GSE0897 (wild-type and msn2Δ msn4Δ nucleosome-occupancy data).
RESULTS
Experimental overview.
To investigate dynamic changes in nucleosome occupancy, we identified genome-wide nucleosome positions before and at 4, 12, 20, 40, and 60 min after treatment with 0.4 mM H2O2. Following formaldehyde cross-linking and micrococcal nuclease digestion, nucleosome-protected DNA was identified and quantified by paired-end deep sequencing (see Materials and Methods). Nucleosome-bound regions were scored at each time point using a nonhomogeneous hidden-state model, as described in reference 35. This identified a total of 62,142 nucleosomes at one or more time points—over 65% of these nucleosomes had center-to-center distances within 20 bp of those of previously identified nucleosomes from other studies (32, 68), and over 90% of the center-to-center distances were within 37 bp. The set of nucleosomes not previously observed was enriched for those that increased in occupancy in response to stress (P = 10−14 [hypergeometric distribution]), suggesting that these nucleosomes are not measured well under nonstress conditions. We then compiled a metaset of nucleosome positions across all time points, identifying time-point-specific nucleosomes that overlapped by >75% as representing the same nucleosome position (see Materials and Methods for details). This procedure provides a robust but conservative estimate of nucleosome positions over time, but it precludes us from scoring subtle changes in positioning (i.e., sliding). In all, we called 43,276 well-resolved nucleosome positions in the metaset. The physical distribution of nucleosomes before stress treatment confirmed the presence of an NDR upstream of most genes and several well-positioned nucleosomes within the coding region (Fig. 1, left panels).
Fig 1.
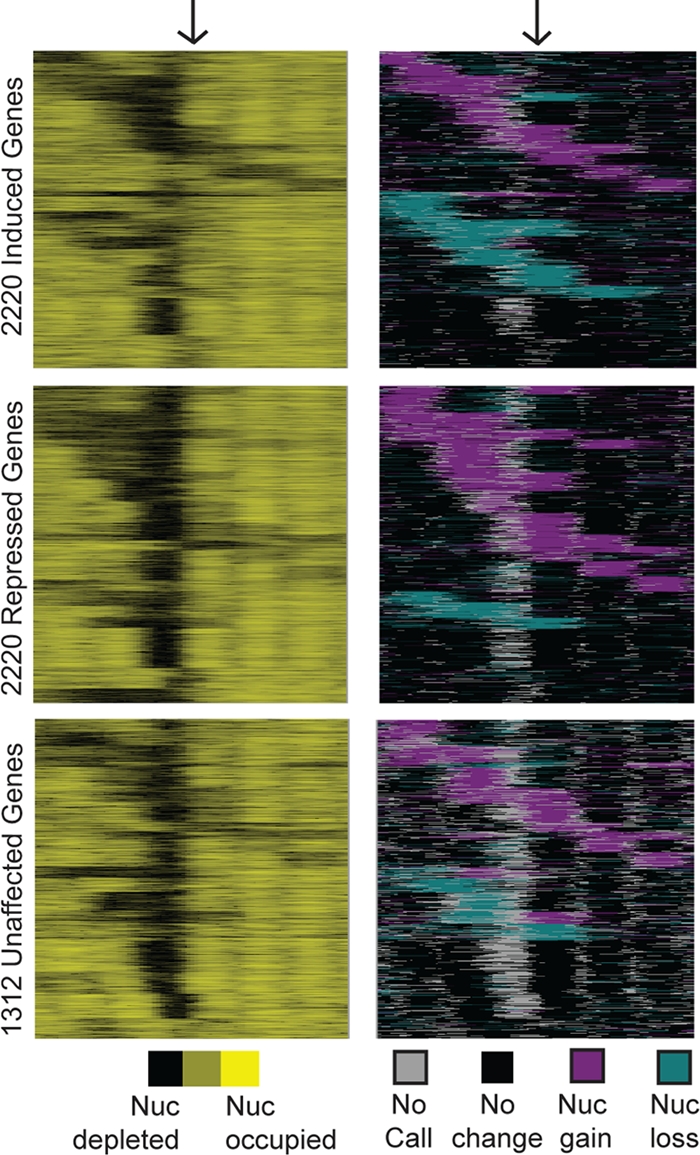
Global analysis of nucleosome positions before and after stress. Genes were subdivided into groups with induced (top), repressed (middle), and unchanging (bottom) expression. Each group was organized separately by k-means clustering based on concatenated data representing nucleosome positions before stress (counts/base pair; left panels) and the position of nucleosome gain (magenta) or depletion (aqua) observed at one or more time points (right panels). Each row represents 500 bp upstream and downstream of a TSS (indicated with arrows), with nucleosome occupancy shown in black or yellow and the directionality of nucleosome change (without regard to timing) shown in magenta or aqua, according to the keys. Data were smoothed with a sliding average based on a 20-bp window with a step size of 10 bp.
Of the nucleosome-bound regions in the metaset, 9,509 (22%) showed a statistically significant change in nucleosome occupancy (P < 0.01 by Wilcoxon rank sum test; q < 0.012 with FDR correction) of at least 1.5× at two or more time points after H2O2 treatment (see Materials and Methods for details). These nucleosomes were strongly associated with regions upstream of genes (P = 10−149 [hypergeometric distribution]), while nucleosome-bound regions with no observable change in occupancy were found within open reading frames (P = 10−218). One caveat is that the positioning of upstream nucleosomes is more subject to technical variation during chromatin preparation (68). Nearly three-quarters of occupancy changes reflected nucleosome “gain” (i.e., an increase in the fraction of cells with a nucleosome bound at that position). The remaining quarter represented depleted occupancy at one or more time points. Of genes that showed an upstream nucleosome occupancy change, most (74%) harbored only one affected upstream nucleosome, consistent with previous reports (62, 79).
To compare dynamic nucleosome rearrangement to neighboring gene expression changes, we also measured global changes in transcript abundance at eight time points up to 60 min after 0.4 mM H2O2 treatment on strand-specific, tiled genomic DNA microarrays. Consistent with prior results, the bulk of transcript changes were transient and most peaked between 20 and 40 min after H2O2 treatment (see Fig. 2B). As expected, nucleosome gain was typically found upstream of repressed genes (P = 10−5 [hypergeometric distribution]) and at the overlapping set of genes with “open” promoters before stress (P = 10−5) (18), while nucleosome depletion was associated with induced genes (P = 10−13), many of which displayed “closed” promoters with minimal NDRs under unstressed conditions (P = 10−18) (Fig. 1, right panels). However, there were many exceptions to these trends. Twelve percent of induced genes showed only nucleosome gain in the upstream regions and were not adjacent to confounding repressed transcripts, while 18% of repressed genes showed only nucleosome depletion and no adjacent induced transcripts. In contrast, many of the genes that did not change in expression (and were not near changing noncoding transcripts) showed an upstream alteration of nucleosome occupancy (Fig. 1, right panels). Interestingly, this group was enriched for genes involved in secretion and protein transport (P = 5 × 10⁻⁷), hinting that changing chromatin may have functional importance for this gene group.
Fig 2.

Lack of correlation in timing of nucleosome versus gene expression changes. Nucleosomes were grouped based on the timing of the peak or earliest change in occupancy and assigned to the nearest downstream transcript. (A) For each group, the fractions of nucleosomes whose downstream transcripts peaked (left) or initiated (right) in change at the denoted time points were plotted, according to the key. (B) Expression patterns for downstream genes repressed (left) or induced (right) are shown for each nucleosome group, sorted within each group by the timing of peak gene expression change.
Lack of global correlation between dynamic changes in nucleosome occupancy and transcript abundance.
We speculated that the dynamics of nucleosome repositioning might be associated with the kinetics of neighboring gene expression. However, there was no significant relationship between the peak change in nucleosome occupancy, or the earliest time point of nucleosome change, and the corresponding change in expression of downstream coding transcripts (P > 0.1 [chi-square test]) (Fig. 2). The lack of relationship was also observed at ncRNAs or when both coding and noncoding transcripts were considered (assigning the nucleosome to the RNA with the closest start site; data not shown). Thus, on a global level and on this time scale, earlier changes in nucleosome occupancy did not correspond to earlier changes in gene expression.
To further investigate dynamic patterns, we partitioned nucleosome-bound regions into different temporal classes, using probabilistic model-based clustering in mclust (20) and the Bayesian information criterion (BIC), which automatically identified 25 distinct clusters (see Materials and Methods for details). The mean expression profiles (centroids) of each cluster were then organized by hierarchical clustering, and highly similar profiles were collapsed into eight major classes (Fig. 3).
Fig 3.
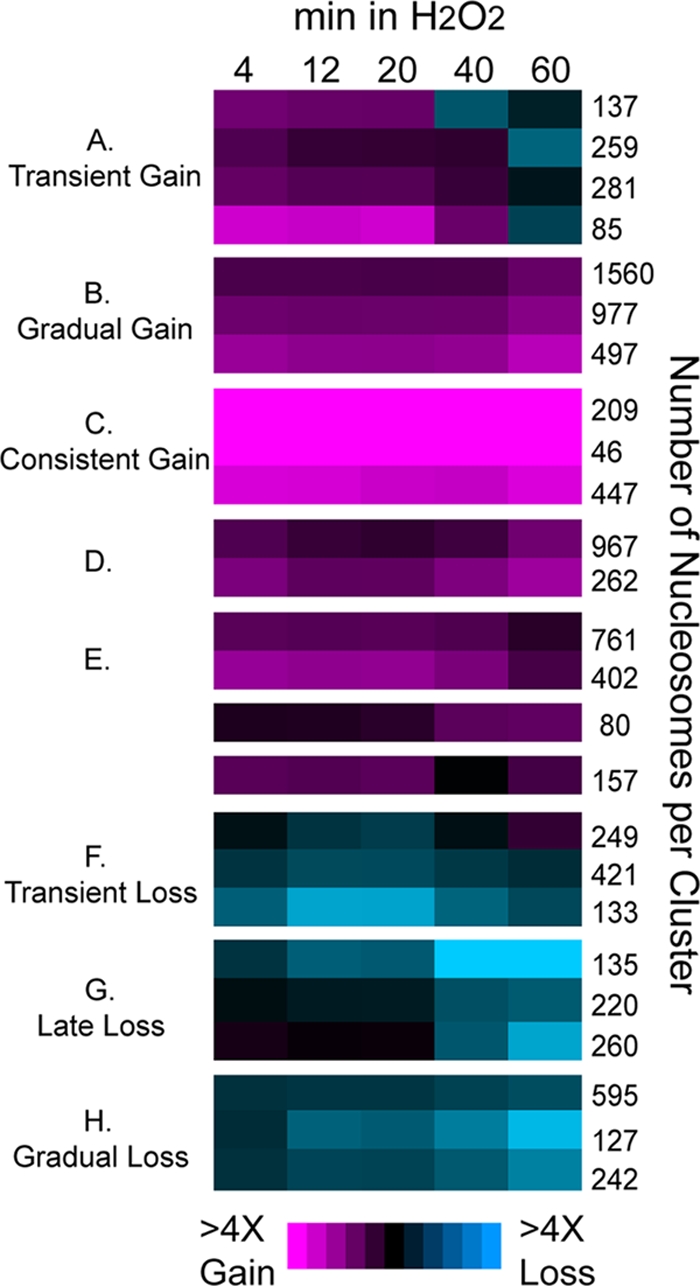
Classification of nucleosome dynamics. Roughly 9,500 nucleosomes were organized by model-based clustering and BIC into 25 clusters. The mean occupancy change profile of each cluster is shown in each row, with the number of nucleosomes in each cluster listed to the right. Cluster means were grouped together by hierarchical clustering into 8 major classes, listed to the left. Magenta represents nucleosome gain and aqua represents nucleosome depletion, according to the key.
The nucleosome classes were distinguished from one another primarily by dynamic differences. For example, all five major classes of nucleosome gain showed increased occupancy early in the time course; however, the gain was transient for nucleosomes in class A, gradually increased for class B, and largely persisted over time for class C. Of the classes of nucleosome depletion, nucleosomes in class F were transiently depleted at ∼12 to 20 min, nucleosomes in class G were lost late at 40 to 60 min after H2O2 addition, and nucleosomes in class H were gradually lost over time. Consistent with results presented above, none of the nucleosome classes showed any significant differences in the peak timing of downstream gene expression (P > 0.01 [t tests]).
Dynamic patterns of nucleosome repositioning are associated with different cis-regulatory elements and chromatin regulators.
Few of the classes showed enrichment of functionally related neighboring genes, with the exception of class C (persistent nucleosome gain) and class G (late nucleosome depletion), which were enriched for ribosomal protein genes (P = 8 × 10⁻¹⁰) and genes induced in the environmental stress response (P = 4 × 10⁻⁶), respectively. However, several classes were associated with genic features: in particular, nucleosomes with transient or late depletion (classes F and G) or gradual depletion (class H) were enriched upstream of or within, respectively, TATA-containing genes or overlapped previously identified H2A.Z-containing nucleosomes that poise genes for induction (Fig. 3) (2, 8). Consistently, these classes of nucleosome depletion were strongly associated (P < 10−6) with closed promoters previously defined by Field et al. (18).
We also found that nucleosomes in different dynamic classes showed specific associations with transcription-factor binding sites and loci bound by chromatin regulators upon stress (Fig. 4). First, we identified classes of nucleosomes that were found in the same promoters as a given cis-regulatory element more often than would have been expected by chance. Several classes of nucleosome gain were associated with PAC elements and ribosomal RNA-processing elements (RRPEs), which repress protein synthesis genes upon stress (6, 41, 46, 48, 82), and Rap1p sites that regulate RP genes (44). Nucleosomes depleted with different dynamics were found in association with several stress-activated transcription factors: all classes of nucleosome depletion were found within promoters containing the related Msn2p and Mig1p binding sites ([CCCCT] and [GCCCCV], respectively), while specific classes were found associated with Pdr3p, Yap1p, and Rpn4p binding sites at genes involved in redox response, oxidative stress, and proteasome expression, respectively.
Fig 4.
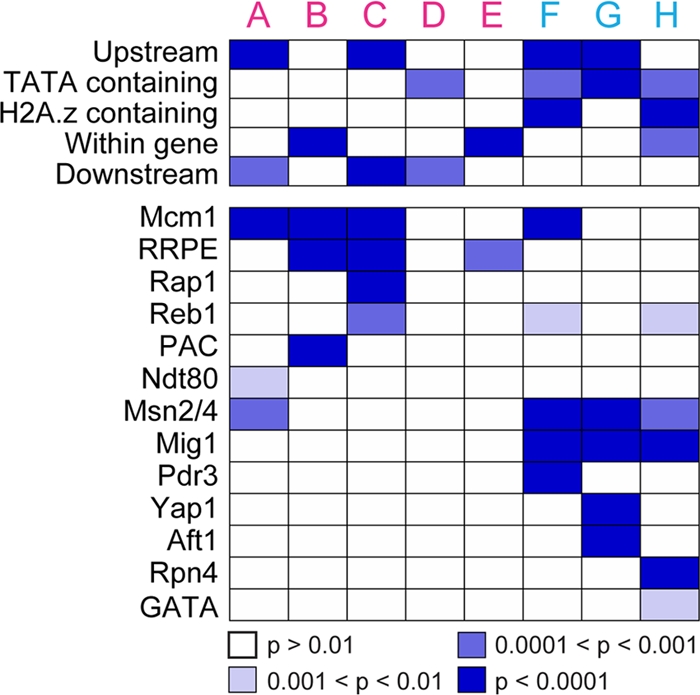
Nucleosome dynamics are associated with specific regulatory features. The enrichment for nucleosomes in each class within gene regions or overlapping with previously determined H2A.Z-containing nucleosomes or TATA-regulated genes was assessed, using the hypergeometric distribution to compare to all nucleosome positions. Association with transcription factor binding sites was assessed by scoring the overlap between genes that harbored upstream nucleosomes in each class and genes with an upstream instance of the denoted transcription factor binding site(s). The Bonferroni-corrected probability of enrichment is represented by colored boxes, according to the key. All enrichments remained significant after controlling for genes regulated by multiple, combinatorially acting regulators. See Materials and Methods for details.
We also compared our data to results from Venters et al. (67), who identified promoters bound by a compendium of regulators before and after heat shock. Several of our classes of nucleosome depletion were associated with genes to which ATP-dependent chromatin-remodeling enzymes (RSC, ISW, and SWI-SNF) and subunits of the histone acetylase SAGA (Spt-Ada-Gcn5-acetyltransferase complex)were recruited after heat shock (see Fig. S2 in the supplemental material). The recruitment of SAGA subunits is consistent with the groups' enrichment for TATA-containing genes, which are targeted by SAGA under stress conditions (77). Given the similarity of genomic expression responses to these stresses, it is likely that these chromatin regulators mediate the nucleosome rearrangements in response to H2O2 as well (see Discussion).
Different dynamic patterns are associated with distinct nucleosome positions.
Changes in transcription initiation are often associated with changes in nucleosome occupancy over and surrounding the TSS. To glean mechanistic insights into nucleosome dynamics, we scored the positional distribution around the TSS for nucleosomes in each class. The global distribution of all nucleosomes relative to TSSs confirmed that most genes display a well-positioned nucleosome overlapping the TSS (the “+1” position), preceded by an NDR and another well-positioned nucleosome in the so-called −1 position (Fig. 5). Several classes of nucleosome gain showed enrichment at and flanking the TSS, consistent with +1 and −1 positions around the NDR (Fig. 5, classes A and C).
Fig 5.

Distribution of nucleosomes lost with different dynamics. The distribution of nucleosomes (Nucs) surrounding TSSs for selected classes is shown. The position of each nucleosome in each class was identified (regardless of time points), and the fraction of nucleosomes in each class was calculated within 20-bp sliding bins with a step size of 10 bp. The y axis represents the fraction of nucleosomes from the denoted class in that region. Plots shown in magenta or blue correspond to classes of nucleosome gain or depletion, respectively. For reference, the distribution of all nucleosomes is represented in gray on each plot, centered on the means of the two profiles.
In contrast, we observed striking differences in positional bias for affected nucleosomes in other classes. Although all classes of nucleosome depletion were associated with stress-regulated genes, distinct differences in positional bias suggested functional differences. Nucleosomes depleted transiently after H2O2 treatment (class F) were enriched overlapping the TSS, while nucleosomes that were gradually depleted (class H) were found throughout the 5′ end of the gene (Fig. 5). In contrast, nucleosomes lost late (class G) were largely restricted to the upstream positions, where many transcription factor binding sites reside. These differences suggest that upstream loss may be related to transcription factor binding, whereas loss at and downstream of the TSS is associated with transcription (see Discussion).
Msn2p binding dynamics correlate with the timing of nucleosome depletion.
To relate nucleosome dynamics to transcription factor binding, we used chromatin immunoprecipitation and tiled microarrays (ChIP-chip) to measure genomic binding of myc-tagged Msn2p before and at 4, 12, 20, 40, and 60 min after H2O2 treatment (see Materials and Methods). We focused on loci that were bound in at least two time points and increased in occupancy in response to H2O2 (since Msn2p is largely excluded from the nucleus before stress [9, 26]). This identified 1,290 Msn2p-bound loci, strikingly more than the ∼300 known Msn2/4p targets (as identified in references 10 and 24). Forty percent of the bound loci (significantly more than expected; P < 10−5 by permutation test) contained one or more STREs, strongly suggesting direct binding by Msn2p.
As with changing nucleosome occupancy and gene expression, Msn2p binding occurred with multiple temporal patterns after H2O2 treatment. We identified four different dynamic classes of Msn2p binding using K-means clustering (Fig. 6). The largest class represented transient Msn2p binding (pattern M3), which was strongly associated with regions upstream of genes (P = 10−34 [hypergeometric distribution]). In contrast, persistent Msn2p binding (pattern M2) was more likely found within transcripts (P = 10−18), and late Msn2p binding (pattern M0) was enriched downstream of coding transcripts (P = 10−4). These enrichments remained significant after controlling for loci that could be assigned to both the upstream and downstream regions of adjacent genes.
Interestingly, the timing of Msn2p binding was associated with the timing of nucleosome depletion in the region. Loci bound transiently by Msn2p (M3 pattern) frequently harbored transiently depleted nucleosomes (class F; P = 5 × 10−39), while loci bound persistently by Msn2p (M2 pattern) displayed gradually decreasing nucleosome occupancy (class H; P = 10−10). In contrast to these specific associations, all of the loci bound by Msn2p showed strong enrichment for late nucleosome depletion (class G; P < 2 × 10⁻⁴), regardless of Msn2p binding dynamics.
Msn2p binding is required for late nucleosome loss over STREs.
Shivaswamy et al. previously showed that nucleosomes covering STREs are lost in response to heat shock (62) and argued that nucleosome loss may allow transcription factor binding and, consequently, transcriptional induction. We found that 42% of STREs within Msn2p-bound regions were unoccupied both before and after H2O2 exposure but that 26% of the STREs were occupied by a nucleosome before stress and became exposed after treatment. This fraction—over a quarter of all elements—was significantly more than that observed for STRE sequences outside Msn2p-bound loci, which were less likely to be functional (P = 10−24 [hypergeometric distribution]).
Although all of the classes of nucleosome depletion were associated with Msn2p-bound regions, nucleosomes covering STREs before stress were enriched only for those depleted late in the time course (class G; P = 10−15). In fact, most nucleosomes were lost significantly later than the observed time point of Msn2p binding: among the 191 STREs within Msn2p-bound loci and occupied by a nucleosome before stress, 138 (72%) were bound by Msn2p by 12 min after treatment but did not display maximal nucleosome depletion until 20 min or later. This strongly suggested that nucleosome loss was not a prerequisite for Msn2p binding but rather required Msn2p association.
To test this hypothesis, we used tiled genomic DNA microarrays to measure changes in global nucleosome occupancy in an msn2Δ msn4Δ strain responding to 0.4 mM H2O2 treatment for 20 min. The mutant strain displayed significantly smaller changes in nucleosome depletion over STREs within Msn2p-bound regions compared to wild-type cells; this was not seen for other nucleosomes outside Msn2p-bound regions (Fig. 7). We validated this result using quantitative PCR (qPCR), measuring nucleosome loss upstream of two known Msn2p targets, CTT1 and HSP26, over time after H2O2 treatment. Both upstream regions showed defective nucleosome depletion in the msn2Δ msn4Δ strain compared to the wild type. Thus, Msn2p and/or Msn4p are required for subsequent nucleosome loss over their binding sites in response to H2O2 stress.
Fig 7.

Msn2p and Msn4p are required for proper nucleosome loss in response to H2O2 treatment. (A) Box plots representing the distribution of log2 changes in nucleosome occupancy are shown for nucleosomes isolated from wild-type cells (W) or cells lacking MSN2 and MSN4 (Δ). Nucleosomes identified from the micrococcal-nuclease-prepared DNA deep sequencing (MNase-seq) experiment that occupied STREs in Msn2p-bound regions are shown on the left; a subset of nucleosomes that did not occlude an STRE, were not in Msn2p-bound regions, and were not near genes whose expression was affected in the msn2Δ msn4Δ strain are shown on the right. (B) Nucleosome occupancy was measured over time in wild-type cells (black) and cells lacking MSN2 and MSN4 (blue) responding to H2O2 treatment and followed by real-time PCR at loci upstream of CTT1 and HSP26. Sequences interrogated by qPCR are indicated by orange bars in the schematic, nucleosome positions are indicated by gray circles, and STRE sequences are represented by blue dots.
DISCUSSION
In this study, we compared the dynamics of nucleosome repositioning, transcription factor binding, and downstream transcript changes to explore the temporal relationship between these physiological processes. On a global scale, the timing of nucleosome change was not correlated with the timing of neighboring gene expression, at least on the time scale studied here. Our results instead suggest that the timing of nucleosome-occupancy change is dependent on distinct chromatin and transcription regulators and linked to functional differences at specific nucleosomes.
The dynamics of nucleosome depletion suggest a model for dynamic rearrangements. Transient nucleosome loss (class F) was seen primarily for nucleosomes at the TSS of induced genes, many of which are regulated by Msn2p-, SAGA-, and ATP-dependent remodelers upon stress (67) (see Fig. S2 in the supplemental material). In general, the timing of this loss (peaking at 12 to 20 min) occurred slightly after Msn2p binding to gene promoters (at 4 to 12 min) but before the peak induction of most Msn2p targets (20 to 40 min) and the transient burst of transcription upon H2O2 treatment (51). These nucleosomes were enriched for those containing H2A.Z, which poises nucleosomes for rapid loss upon transcriptional induction (2, 28, 58, 80). Thus, the transient loss of +1 nucleosomes is likely coupled to transient, Msn2p-dependent transcriptional induction.
In contrast, late depletion of nucleosomes in class G occurs after peak gene expression changes, after Msn2p binding, and in fact requires Msn2p for loss. Nucleosomes in this class were enriched upstream of the TSS and frequently occupied STREs before stress. Their loss is dependent on Msn2p binding, perhaps via recruitment of the Isw and NuA4 chromatin modifiers that associate with genes downstream of class G nucleosomes upon heat shock (see Fig. S2 in the supplemental material) and are known to affect expression of Msn2p targets (47).
The role of chromatin architecture in dynamic Msn2p binding.
We also observed several dynamic classes of Msn2p binding upon H2O2 treatment. The determinants of Msn2p binding kinetics are not entirely clear but may be affected by combinatorial transcriptional regulation, as suggested previously (53), and by chromatin architecture before stress. Previous studies showed that STRE sequences lose nucleosomes in response to heat shock and suggested that nucleosome occlusion may regulate transcription factor access (62). However, our results suggest a different situation: within the cell population, maximal nucleosome depletion over most obscured STREs occurred after Msn2p binding and in fact required Msn2p (Fig. 7). This confirms a prior study of the HSP12 promoter that showed that chromatin remodeling was dependent on the presence of Msn2p (16). Contrary to our expectation, Msn2p binding at constitutively exposed STREs did not occur more rapidly than binding to STREs covered by nucleosomes before stress, at least on the time scales studied here. In fact, loci with covered STREs actually showed a tighter distribution of peak binding times (P = 0.001; data not shown), and loci bound early with the M3 dynamic (Fig. 6) were enriched for pre-stress-occupied STREs, relative to other Msn2p binding classes (P = 0.0003). Together, these results strongly suggest that Msn2p binds to target loci before the nucleosome is completely lost from its binding site.
This raises important questions about how Msn2p binds the STRE in the presence of nucleosomes. One possibility is that the covered STRE is first partly exposed by nucleosome sliding or partial unwinding, which we are unable to score sensitively here. Indeed, several other factors, including the environmentally responsive yeast Gal4p and Pho4p, can bind to partially unwound nucleosomes (19, 56, 57, 60); thus, loss after apparent factor binding may hold for other factors beyond Msn2p. Alternatively, Msn2p may bind its short recognition sequence in the presence of a bound nucleosome. Several factors can co-occupy DNA with a nucleosome if the appropriate contacts can be made with the solvent-accessible groove or after partial nucleosome disassembly (69). An interesting example is the mammalian glucocorticoid receptor (GR), another stress-activated Cys2His2 factor capable of binding nucleosomal DNA (5, 52, 55). Both GR and Msn2p recruit the ATP-dependent Swi/Snf remodeling complex, which may catalyze nucleosome loss after or concurrently with transcription factor binding (16, 33). However, both factors are also degraded by the proteasome at promoters (11, 14, 37, 38, 65); thus, chromatin could also be influenced by nucleosome degradation rather than eviction.
Regardless of the mechanism, the function, if any, of late loss of STRE-obscuring nucleosomes is unclear. Chromatin changes after the initial transcriptional response could poise promoters for future induction (12, 36, 45, 54, 78). Alternatively, nucleosome loss after transcriptional activation could be required for promoter recovery after cells have acclimated to the stress. This possibility is especially intriguing, given that many genes with late upstream nucleosome depletion are bound by Isw and NuA4 subunits upon stress, factors previously shown to repress expression of Msn2p targets (47).
Conclusions.
Our results highlight the complexities of dynamic chromatin changes and their effects across the genome. An important avenue for future work is single-cell analysis of individual promoters, which is likely to uncover intricacies that cannot be captured at the population level. Dynamic considerations should be critical to dissecting the causes and effects of individual nucleosome rearrangements.
Supplementary Material
ACKNOWLEDGMENTS
We thank Mike Snyder for providing the Msn2-Myc strain, Frank Pugh for providing the list of transcript boundaries, Josh Hyman and the UW Biotechnology Center for sequencing support, and Jeff Lewis, Dana Wohlbach, and Jessica Clarke for technical help. We also thank Aseem Ansari and members of the Gasch laboratory for comments on the manuscript.
This work was supported by an NSF CAREER Award (0447887) and NIH NIGMS grant R01GM083989-01 to A.P.G., the Wisconsin Center of Excellence in Genomic Sciences (grant P50HG004952) through the NIH NHGRI, and grant HG03747 to S.K. D.J.H. was supported by an NIGMS grant to the Molecular Biosciences Training Program (T32GM007215).
D.J.H. and A.P.G. designed the experiments, D.J.H. performed all experimental techniques and computational analyses, P.-F.K. identified nucleosome positions, A.P.G. and S.K. supervised the experimental and/or statistical analyses, and D.J.H. and A.P.G. wrote the manuscript, with comments from all authors.
Footnotes
Supplemental material for this article may be found at http://mcb.asm.org/.
Published ahead of print 21 February 2012
REFERENCES
- 1. Adkins MW, Howar SR, Tyler JK. 2004. Chromatin disassembly mediated by the histone chaperone Asf1 is essential for transcriptional activation of the yeast PHO5 and PHO8 genes. Mol. Cell 14:657–666 [DOI] [PubMed] [Google Scholar]
- 2. Albert I, et al. 2007. Translational and rotational settings of H2A.Z nucleosomes across the Saccharomyces cerevisiae genome. Nature 446:572–576 [DOI] [PubMed] [Google Scholar]
- 3. Alejandro-Osorio AL, et al. 2009. The histone deacetylase Rpd3p is required for transient changes in genomic expression in response to stress. Genome Biol. 10:R57. [DOI] [PMC free article] [PubMed] [Google Scholar]
- 4. Almer A, Rudolph H, Hinnen A, Horz W. 1986. Removal of positioned nucleosomes from the yeast PHO5 promoter upon PHO5 induction releases additional upstream activating DNA elements. EMBO J. 5:2689–2696 [DOI] [PMC free article] [PubMed] [Google Scholar]
- 5. Archer TK, Cordingley MG, Wolford RG, Hager GL. 1991. Transcription factor access is mediated by accurately positioned nucleosomes on the mouse mammary tumor virus promoter. Mol. Cell. Biol. 11:688–698 [DOI] [PMC free article] [PubMed] [Google Scholar]
- 6. Badis G, et al. 2008. A library of yeast transcription factor motifs reveals a widespread function for Rsc3 in targeting nucleosome exclusion at promoters. Mol. Cell 32:878–887 [DOI] [PMC free article] [PubMed] [Google Scholar]
- 7. Bailey TL, et al. 2009. MEME SUITE: tools for motif discovery and searching. Nucleic Acids Res. 37:W202–W208 [DOI] [PMC free article] [PubMed] [Google Scholar]
- 8. Basehoar AD, Zanton SJ, Pugh BF. 2004. Identification and distinct regulation of yeast TATA box-containing genes. Cell 116:699–709 [DOI] [PubMed] [Google Scholar]
- 9. Beck T, Hall MN. 1999. The TOR signalling pathway controls nuclear localization of nutrient-regulated transcription factors. Nature 402:689–692 [DOI] [PubMed] [Google Scholar]
- 10. Berry DB, Gasch AP. 2008. Stress-activated genomic expression changes serve a preparative role for impending stress in yeast. Mol. Biol. Cell 19:4580–4587 [DOI] [PMC free article] [PubMed] [Google Scholar]
- 11. Bose S, Dutko JA, Zitomer RS. 2005. Genetic factors that regulate the attenuation of the general stress response of yeast. Genetics 169:1215–1226 [DOI] [PMC free article] [PubMed] [Google Scholar]
- 12. Brickner DG, et al. 2007. H2A. Z-mediated localization of genes at the nuclear periphery confers epigenetic memory of previous transcriptional state. PLoS Biol. 5:e81. [DOI] [PMC free article] [PubMed] [Google Scholar]
- 13. Causton HC, et al. 2001. Remodeling of yeast genome expression in response to environmental changes. Mol. Biol. Cell 12:323–337 [DOI] [PMC free article] [PubMed] [Google Scholar]
- 14. Chi Y, et al. 2001. Negative regulation of Gcn4 and Msn2 transcription factors by Srb10 cyclin-dependent kinase. Genes Dev. 15:1078–1092 [DOI] [PMC free article] [PubMed] [Google Scholar]
- 15. Durrin LK, Mann RK, Grunstein M. 1992. Nucleosome loss activates CUP1 and HIS3 promoters to fully induced levels in the yeast Saccharomyces cerevisiae. Mol. Cell. Biol. 12:1621–1629 [DOI] [PMC free article] [PubMed] [Google Scholar]
- 16. Erkina TY, Tschetter PA, Erkine AM. 2008. Different requirements of the SWI/SNF complex for robust nucleosome displacement at promoters of heat shock factor and Msn2- and Msn4-regulated heat shock genes. Mol. Cell. Biol. 28:1207–1217 [DOI] [PMC free article] [PubMed] [Google Scholar]
- 17. Ertel F, et al. 2010. In vitro reconstitution of PHO5 promoter chromatin remodeling points to a role for activator-nucleosome competition in vivo. Mol. Cell. Biol. 30:4060–4076 [DOI] [PMC free article] [PubMed] [Google Scholar]
- 18. Field Y, et al. 2008. Distinct modes of regulation by chromatin encoded through nucleosome positioning signals. PLoS Comput. Biol. 4:e1000216. [DOI] [PMC free article] [PubMed] [Google Scholar]
- 19. Floer M, et al. 2010. A RSC/nucleosome complex determines chromatin architecture and facilitates activator binding. Cell 141:407–418 [DOI] [PMC free article] [PubMed] [Google Scholar]
- 20. Fraley C, Raftery AE. 2002. Model-based clustering, discriminant analysis, and density estimation. J. Am. Stat. Assoc. 97:611–631 [Google Scholar]
- 21. Gasch AP. 2002. The environmental stress response: a common yeast response to environmental stresses. Springer-Verlag, Heidelberg, Germany [Google Scholar]
- 22. Gasch AP. 2002. Yeast genomic expression studies using DNA microarrays. Methods Enzymol. 350:393–414 [DOI] [PubMed] [Google Scholar]
- 23. Gasch AP, et al. 2004. Conservation and evolution of cis-regulatory systems in ascomycete fungi. PLoS Biol. 2:e398. [DOI] [PMC free article] [PubMed] [Google Scholar]
- 24. Gasch AP, et al. 2000. Genomic expression programs in the response of yeast cells to environmental changes. Mol. Biol. Cell 11:4241–4257 [DOI] [PMC free article] [PubMed] [Google Scholar]
- 25. Geng F, Laurent BC. 2004. Roles of SWI/SNF and HATs throughout the dynamic transcription of a yeast glucose-repressible gene. EMBO J. 23:127–137 [DOI] [PMC free article] [PubMed] [Google Scholar]
- 26. Görner W, et al. 1998. Nuclear localization of the C2H2 zinc finger protein Msn2p is regulated by stress and protein kinase A activity. Genes Dev. 12:586–597 [DOI] [PMC free article] [PubMed] [Google Scholar]
- 27. Gross DS, Adams CC, Lee S, Stentz B. 1993. A critical role for heat shock transcription factor in establishing a nucleosome-free region over the TATA-initiation site of the yeast HSP82 heat shock gene. EMBO J. 12:3931–3945 [DOI] [PMC free article] [PubMed] [Google Scholar]
- 28. Guillemette B, et al. 2005. Variant histone H2A.Z is globally localized to the promoters of inactive yeast genes and regulates nucleosome positioning. PLoS Biol. 3:e384. [DOI] [PMC free article] [PubMed] [Google Scholar]
- 29. Hager GL, McNally JG, Misteli T. 2009. Transcription dynamics. Mol. Cell 35:741–753 [DOI] [PMC free article] [PubMed] [Google Scholar]
- 30. Han M, Kim UJ, Kayne P, Grunstein M. 1988. Depletion of histone H4 and nucleosomes activates the PHO5 gene in Saccharomyces cerevisiae. EMBO J. 7:2221–2228 [DOI] [PMC free article] [PubMed] [Google Scholar]
- 31. Hogan GJ, Lee CK, Lieb JD. 2006. Cell cycle-specified fluctuation of nucleosome occupancy at gene promoters. PLoS Genet. 2:e158. [DOI] [PMC free article] [PubMed] [Google Scholar]
- 32. Jiang C, Pugh BF. 2009. A compiled and systematic reference map of nucleosome positions across the Saccharomyces cerevisiae genome. Genome Biol. 10:R109. [DOI] [PMC free article] [PubMed] [Google Scholar]
- 33. John S, et al. 2008. Interaction of the glucocorticoid receptor with the chromatin landscape. Mol. Cell 29:611–624 [DOI] [PubMed] [Google Scholar]
- 34. Kaplan N, et al. 2009. The DNA-encoded nucleosome organization of a eukaryotic genome. Nature 458:362–366 [DOI] [PMC free article] [PubMed] [Google Scholar]
- 35. Kuan PF, Huebert D, Gasch A, Keles S. 2009. A non-homogeneous hidden-state model on first order differences for automatic detection of nucleosome positions. Stat. Appl. Genet. Mol. Biol. 8: Article29 [DOI] [PMC free article] [PubMed] [Google Scholar]
- 36. Kundu S, Horn PJ, Peterson CL. 2007. SWI/SNF is required for transcriptional memory at the yeast GAL gene cluster. Genes Dev. 21:997–1004 [DOI] [PMC free article] [PubMed] [Google Scholar]
- 37. Lallet S, et al. 2006. Role of Gal11, a component of the RNA polymerase II mediator in stress-induced hyperphosphorylation of Msn2 in Saccharomyces cerevisiae. Mol. Microbiol. 62:438–452 [DOI] [PubMed] [Google Scholar]
- 38. Lallet S, Garreau H, Poisier C, Boy-Marcotte E, Jacquet M. 2004. Heat shock-induced degradation of Msn2p, a Saccharomyces cerevisiae transcription factor, occurs in the nucleus. Mol. Genet. Genomics 272:353–362 [DOI] [PubMed] [Google Scholar]
- 39. Langmead B, Trapnell C, Pop M, Salzberg SL. 2009. Ultrafast and memory-efficient alignment of short DNA sequences to the human genome. Genome Biol. 10:R25. [DOI] [PMC free article] [PubMed] [Google Scholar]
- 40. Lee CK, Shibata Y, Rao B, Strahl BD, Lieb JD. 2004. Evidence for nucleosome depletion at active regulatory regions genome-wide. Nat. Genet. 36:900–905 [DOI] [PubMed] [Google Scholar]
- 41. Lee MV, et al. 2011. A dynamic model of proteome changes reveals new roles for transcript alteration in yeast. Mol. Syst. Biol. 7:514. [DOI] [PMC free article] [PubMed] [Google Scholar]
- 42. Lee W, et al. 2007. A high-resolution atlas of nucleosome occupancy in yeast. Nat. Genet. 39:1235–1244 [DOI] [PubMed] [Google Scholar]
- 43. Li H, Ruan J, Durbin R. 2008. Mapping short DNA sequencing reads and calling variants using mapping quality scores. Genome Res. 18:1851–1858 [DOI] [PMC free article] [PubMed] [Google Scholar]
- 44. Lieb JD, Liu X, Botstein D, Brown PO. 2001. Promoter-specific binding of Rap1 revealed by genome-wide maps of protein-DNA association. Nat. Genet. 28:327–334 [DOI] [PubMed] [Google Scholar]
- 45. Light WH, Brickner DG, Brand VR, Brickner JH. 2010. Interaction of a DNA zip code with the nuclear pore complex promotes H2A.Z incorporation and INO1 transcriptional memory. Mol. Cell 40:112–125 [DOI] [PMC free article] [PubMed] [Google Scholar]
- 46. Liko D, Conway MK, Grunwald DS, Heideman W. 2010. Stb3 plays a role in the glucose-induced transition from quiescence to growth in Saccharomyces cerevisiae. Genetics 185:797–810 [DOI] [PMC free article] [PubMed] [Google Scholar]
- 47. Lindstrom KC, Vary JC, Parthun MR, Delrow J, Tsukiyama T. 2006. Isw1 functions in parallel with the NuA4 and Swr1 complexes in stress-induced gene repression. Mol. Cell. Biol. 26:6117–6129 [DOI] [PMC free article] [PubMed] [Google Scholar]
- 48. Lippman SI, Broach JR. 2009. Protein kinase A and TORC1 activate genes for ribosomal biogenesis by inactivating repressors encoded by Dot6 and its homolog Tod6. Proc. Natl. Acad. Sci. U. S. A. 106:19928–19933 [DOI] [PMC free article] [PubMed] [Google Scholar]
- 49. Liu CL, et al. 2005. Single-nucleosome mapping of histone modifications in S. cerevisiae. PLoS Biol. 3:e328. [DOI] [PMC free article] [PubMed] [Google Scholar]
- 50. Lohr D, Lopez J. 1995. GAL4/GAL80-dependent nucleosome disruption/deposition on the upstream regions of the yeast GAL1-10 and GAL80 genes. J. Biol. Chem. 270:27671–27678 [DOI] [PubMed] [Google Scholar]
- 51. Molina-Navarro MM, et al. 2008. Comprehensive transcriptional analysis of the oxidative response in yeast. J. Biol. Chem. 283:17908–17918 [DOI] [PubMed] [Google Scholar]
- 52. Nagaich AK, Walker DA, Wolford R, Hager GL. 2004. Rapid periodic binding and displacement of the glucocorticoid receptor during chromatin remodeling. Mol. Cell 14:163–174 [DOI] [PubMed] [Google Scholar]
- 53. Ni L, et al. 2009. Dynamic and complex transcription factor binding during an inducible response in yeast. Genes Dev. 23:1351–1363 [DOI] [PMC free article] [PubMed] [Google Scholar]
- 54. Ohsawa R, Adkins M, Tyler JK. 2009. Epigenetic inheritance of an inducibly nucleosome-depleted promoter and its associated transcriptional state in the apparent absence of transcriptional activators. Epigenetics Chromatin 2:11. [DOI] [PMC free article] [PubMed] [Google Scholar]
- 55. Perlmann T, Wrange O. 1988. Specific glucocorticoid receptor binding to DNA reconstituted in a nucleosome. EMBO J. 7:3073–3079 [DOI] [PMC free article] [PubMed] [Google Scholar]
- 56. Polach KJ, Widom J. 1995. Mechanism of protein access to specific DNA sequences in chromatin: a dynamic equilibrium model for gene regulation. J. Mol. Biol. 254:130–149 [DOI] [PubMed] [Google Scholar]
- 57. Polach KJ, Widom J. 1996. A model for the cooperative binding of eukaryotic regulatory proteins to nucleosomal target sites. J. Mol. Biol. 258:800–812 [DOI] [PubMed] [Google Scholar]
- 58. Raisner RM, et al. 2005. Histone variant H2A.Z marks the 5′ ends of both active and inactive genes in euchromatin. Cell 123:233–248 [DOI] [PMC free article] [PubMed] [Google Scholar]
- 59. Rando OJ, Ahmad K. 2007. Rules and regulation in the primary structure of chromatin. Curr. Opin. Cell Biol. 19:250–256 [DOI] [PubMed] [Google Scholar]
- 60. Ransom M, et al. 2009. FACT and the proteasome promote promoter chromatin disassembly and transcriptional initiation. J. Biol. Chem. 284:23461–23471 [DOI] [PMC free article] [PubMed] [Google Scholar]
- 61. Segal E, et al. 2006. A genomic code for nucleosome positioning. Nature 442:772–778 [DOI] [PMC free article] [PubMed] [Google Scholar]
- 62. Shivaswamy S, et al. 2008. Dynamic remodeling of individual nucleosomes across a eukaryotic genome in response to transcriptional perturbation. PLoS Biol. 6:e65. [DOI] [PMC free article] [PubMed] [Google Scholar]
- 63. Smyth G. 2004. Linear models and empirical Bayes methods for assessing differential expression in microarray experiments. Stat. Appl. Genet. Mol. Biol. 3: Article3 [DOI] [PubMed] [Google Scholar]
- 64. Song JS, et al. 2007. Model-based analysis of two-color arrays (MA2C). Genome Biol. 8:R178. [DOI] [PMC free article] [PubMed] [Google Scholar]
- 65. Stavreva DA, Muller WG, Hager GL, Smith CL, McNally JG. 2004. Rapid glucocorticoid receptor exchange at a promoter is coupled to transcription and regulated by chaperones and proteasomes. Mol. Cell. Biol. 24:2682–2697 [DOI] [PMC free article] [PubMed] [Google Scholar]
- 66. Storey JD, Tibshirani R. 2003. Statistical significance for genomewide studies. Proc. Natl. Acad. Sci. U. S. A. 100:9440–9445 [DOI] [PMC free article] [PubMed] [Google Scholar]
- 67. Venters BJ, et al. 2011. A comprehensive genomic binding map of gene and chromatin regulatory proteins in Saccharomyces. Mol. Cell 41:480–492 [DOI] [PMC free article] [PubMed] [Google Scholar]
- 68. Weiner A, Hughes A, Yassour M, Rando OJ, Friedman N. 2010. High-resolution nucleosome mapping reveals transcription-dependent promoter packaging. Genome Res. 20:90–100 [DOI] [PMC free article] [PubMed] [Google Scholar]
- 69. Wolffe AP. 1991. Activating chromatin. Curr. Biol. 1:366–368 [DOI] [PubMed] [Google Scholar]
- 70. Workman JL. 2006. Nucleosome displacement in transcription. Genes Dev. 20:2009–2017 [DOI] [PubMed] [Google Scholar]
- 71. Xu Z, et al. 2011. Antisense expression increases gene expression variability and locus interdependency. Mol. Syst. Biol. 7:468. [DOI] [PMC free article] [PubMed] [Google Scholar]
- 72. Xu Z, et al. 2009. Bidirectional promoters generate pervasive transcription in yeast. Nature 457:1033–1037 [DOI] [PMC free article] [PubMed] [Google Scholar]
- 73. Yassour M, et al. 2010. Strand-specific RNA sequencing reveals extensive regulated long antisense transcripts that are conserved across yeast species. Genome Biol. 11:R87. [DOI] [PMC free article] [PubMed] [Google Scholar]
- 74. Yoon OK, Brem RB. 2010. Noncanonical transcript forms in yeast and their regulation during environmental stress. RNA 16:1256–1267 [DOI] [PMC free article] [PubMed] [Google Scholar]
- 75. Yosef N, Regev A. 2011. Impulse control: temporal dynamics in gene transcription. Cell 144:886–896 [DOI] [PMC free article] [PubMed] [Google Scholar]
- 76. Yuan GC, et al. 2005. Genome-scale identification of nucleosome positions in S. cerevisiae. Science 309:626–630 [DOI] [PubMed] [Google Scholar]
- 77. Zanton SJ, Pugh BF. 2004. Changes in genomewide occupancy of core transcriptional regulators during heat stress. Proc. Natl. Acad. Sci. U. S. A. 101:16843–16848 [DOI] [PMC free article] [PubMed] [Google Scholar]
- 78. Zanton SJ, Pugh BF. 2006. Full and partial genome-wide assembly and disassembly of the yeast transcription machinery in response to heat shock. Genes Dev. 20:2250–2265 [DOI] [PMC free article] [PubMed] [Google Scholar]
- 79. Zawadzki KA, Morozov AV, Broach JR. 2009. Chromatin-dependent transcription factor accessibility rather than nucleosome remodeling predominates during global transcriptional restructuring in Saccharomyces cerevisiae. Mol. Biol. Cell 20:3503–3513 [DOI] [PMC free article] [PubMed] [Google Scholar]
- 80. Zhang H, Roberts DN, Cairns BR. 2005. Genome-wide dynamics of Htz1, a histone H2A variant that poises repressed/basal promoters for activation through histone loss. Cell 123:219–231 [DOI] [PMC free article] [PubMed] [Google Scholar]
- 81. Zhang L, Ma H, Pugh BF. 2011. Stable and dynamic nucleosome states during a meiotic developmental process. Genome Res. 21:875–884 [DOI] [PMC free article] [PubMed] [Google Scholar]
- 82. Zhu C, et al. 2009. High-resolution DNA-binding specificity analysis of yeast transcription factors. Genome Res. 19:556–566 [DOI] [PMC free article] [PubMed] [Google Scholar]
Associated Data
This section collects any data citations, data availability statements, or supplementary materials included in this article.