

Abstract
Uropathogenic Escherichia coli (UPEC) strains are capable of invading bladder epithelial cells (BECs) on the bladder luminal surface. Based primarily on studies in mouse models, invasion is proposed to trigger an intracellular uropathogenic cascade involving intracellular bacterial proliferation followed by escape of elongated, filamentous bacteria from colonized BECs. UPEC filaments on the mouse bladder epithelium are able to revert to rod-shaped bacteria, which are believed to invade neighboring cells to initiate new rounds of intracellular colonization. So far, however, these late-stage infection events have not been replicated in vitro. We have established an in vitro model of human bladder cell infection by the use of a flow chamber (FC)-based culture system, which allows investigation of steps subsequent to initial invasion. Short-term bacterial colonization on the FC-BEC layer led to intracellular colonization. Exposing invaded BECs to a flow of urine, i.e., establishing conditions similar to those faced by UPEC reemerging on the bladder luminal surface, led to outgrowth of filamentous bacteria similar to what has been reported to occur in mice. These filaments were capable of reverting to rods that could invade other BECs. Hence, under growth conditions established to resemble those present in vivo, the elements of the proposed uropathogenic cascade were inducible in a human BEC model system. Here, we describe the model and show how these characteristics are reproduced in vitro.
INTRODUCTION
Urinary tract infections (UTIs) are, by number, among the most important bacterial infectious diseases in industrialized countries (18). Denmark, with a population of 5.5 million, annually treats 200,000 to 300,000 cases of UTI (19), and comparable numbers are generally seen for other countries. One reason for the many UTIs is their high frequency of recurrence. A total of 20% to 40% of women treated for UTI experience at least one recurrence within 6 months after the initial infection (17, 28, 37). Furthermore, recurrent UTIs are often caused by the same clone (40), suggesting that uropathogens have mechanisms enabling them to evade host response and antibiotic treatment.
Uropathogenic Escherichia coli (UPEC) strains account for the vast majority of UTIs. It has been documented comprehensively that UPEC strains are capable of invading host bladder epithelial cells (BECs) (29, 31, 39), which is considered a possible cause of recurrent UTI (21). Based on studies of experimentally infected mouse bladders, a cyclic cascade of UPEC pathogenesis has been proposed in which intracellular UPEC proliferation is followed by bacterial escape from colonized BECs and seeding of new invasive events (22). Among the characteristics of this cascade are the morphological alterations undergone by UPEC, from rod shapes during invasion to coccoid shapes when intracellular and finally to highly elongated shapes during escape from and fluxing between BECs (23, 32). Identification of filaments and intracellularly colonized BECs in urine sampled from women with cystitis has provided support for the idea of the presence of such a cascade in humans as well (36). However, no in vitro evidence has been reported which shows UPEC progressing through these late-stage events in human BECs, and clinical studies have not yet resulted in a consensus on whether this cascade exists in humans (9).
UPEC adhesion to and initial invasion of cultured human BECs has been studied extensively, and molecular details of this early infection stage in human BECs are well described (11, 34). On the other hand, few studies have investigated the later stages of the proposed uropathogenic cascade, in particular, the exit from and transit between cells as well as secondary infection. One reason for this might be the limited experimental possibilities for investigating these steps in vitro. Mouse models yield valuable snapshots at specific time points during the progress of infection, but the complexity of the in vivo system also entails limitations when it comes to dissecting molecular pathways and details of the host-pathogen interaction. Conversely, infections of microtiter plate cultures are tightly controlled and therefore enable detailed molecular studies but the conditions of such infections are in many ways distinct from those present in vivo.
In order to study secondary infection and a putative uropathogenic cascade in UPEC-infected human BECs, we have developed a flow chamber (FC)-based cell infection model. When UPEC bacteria colonize the FC-BEC layer, they are challenged by a hydrodynamic environment, as they are in the bladder. Furthermore, continuous replenishment of flow medium maintains cocultures of UPEC-infected BEC layers for prolonged periods, and we found that this supported the progression to secondary surface colonization events. After limited exposure to bacterial surface growth, the FC-BEC layer became intracellularly colonized, often with tightly packed coccoid-shaped bacteria, similar to what has been observed in mice (22). When the invaded FC-BEC layer was exposed to a flow of human urine, UPEC bacteria escaping BECs were often highly filamentous, similar to what has been reported to occur during secondary infection in mice (22, 24, 32). The filamentous response was found to be dependent on urine concentration and was enhanced under the FC conditions. Filaments were capable of reverting to rod-shaped bacteria that could reinvade new FC-BECs. Hence, our model recapitulates, to our knowledge for the first time, all main events of the murine uropathogenic cascade in a human BEC culture system.
The induction of filamentation in escaping UPEC as observed in our model suggests that this morphological response is induced by the physical and chemical growth conditions in the bladder. An observed tight association of filaments with the BEC layer indicated that filaments are capable of adhering strongly to the uroepithelium, which would explain their accumulation under flow conditions and also suggests a function of filamentation in UPEC pathogenesis. The human BEC infection model opens up possibilities for detailed molecular studies of later stages of UPEC infection and fills an experimental gap between the contemporary microtiter plate cell culture infection models and animal UTI models.
MATERIALS AND METHODS
Bacteria, cells, and growth conditions.
As the model UPEC, we used E. coli UTI89, a cystitis-derived isolate of serotype O18:K1:H7 (32) used in several murine UTI model studies (see, e.g., references 22, 24, and 32). Additional E. coli strains used were NU14, 34476 (1), and ATCC 25922. Green fluorescent UTI89 was produced by transformation with pEGFP (Clontech). When appropriate, gfp expression was induced from the pEGFP plasmid by addition of 1 mM IPTG (isopropyl-β-d-thiogalactopyranoside) to the growth medium. UTI89ΔsulA and UTI89ΔfimH deletion mutants were constructed using the lambda Red recombination method (10). Bacterial strains were grown overnight on LB agar plates at 37°C, suspended in phosphate-buffered saline (PBS) to an optical density (600 nm) of 0.2, and used directly as a seeding suspension. The bladder epithelium cell used was the virus-immortalized PD07i cell line, which retains a number of important characteristics of the native bladder cell, such as inflammatory response and apoptosis (6, 26). PD07i cells were cultured in Epilife medium containing 60 μM calcium (Invitrogen) supplemented with 1% human keratinocyte growth medium (Invitrogen), and sterile cultures were maintained by supplementation with penicillin and streptomycin (Pen-Strep; Invitrogen). Static cell cultures and FC cultures were grown at 37°C in 5% CO2.
FC cell infection model.
Cell infections were performed in custom-built FCs based on a previously described principle (1). A four-chamber setup was used in each experiment, with each chamber consisting of a polycarbonate (PC) top disc, a bottom glass plate with a confluent PD07i layer, and a 0.5-mm-thick silicone gasket with a central 20-by-3-mm slit sandwiched between the PC disc and the glass plate. In this arrangement, the silicone gasket slit defines the flow channel dimensions and medium is brought to and moved through this channel by internal connecting pipes drilled in the PC disc (see Fig. 1A for details). Flow is maintained with an extremely low-pulsation roller pump (Ismatec IPC-N4; Glattbrugg, Switzerland) attached to the exit tubing of the chambers.
Fig 1.

(A) Diagram of flow chamber with uroepithelium cell culture. Flow to and from the substratum surface is maintained through the upper polycarbonate disc (mark 1) machined with connecting pipes and inner channels. Ongoing infection is observed in situ through the polycarbonate disc. A silicone gasket (mark 2) with central slit (mark 3) defines the flow channel dimensions on a cell cultured glass slide. (B) Uropathogenic cascade in vitro. The scheme outlines the complete cycle of UPEC intracellular infection induced in vitro. UPEC bacteria are seeded onto an FC-BEC culture (upper left) and subsequently induced to colonize the surface (upper right). During coculturing of bacteria and BEC, single bacteria invade BECs and initiate intracellular colonization (lower right). After elimination of extracellular bacteria and during continuing coculture of the BEC layer with intracellular bacteria, some cells become extensively colonized, leading to their eruption (lower left). During escape from colonized, loosely attached BECs (indicated with arrows in the lower left panel), a secondary colonization initiates in the form of distinct aggregates of filamentous bacteria associated with the BEC (lower left) or of loosely dispersed bacteria, depending on the urine concentration. The filamentous UPEC bacteria can revert to single cells capable of reinvasion, which may lead to subsequent rounds of the uropathogenic cascade. Upper images and lower left image are from in situ FC microscopy, showing the undisturbed bacterial colonization. UGM, uroepithelium growth medium; pep, peptone; glu, glucose; genta, gentamicin. Bars, 100 μm (black) and 10 μm (white).
FCs were assembled around the PD07i cultured glass slides, which were then further cultured in-chamber for 24 h under conditions of a continuous flow of antibiotic-supplemented Epilife. Before infection, the flow system was flushed with Epilife without antibiotics for 1 h at a flow rate of 100 μl/min to remove all traces of antibiotics. Infection was initiated by shifting to a flow of PBS-suspended bacteria for 20 min at 100 μl/min. The flow was then shifted back to sterile Epilife without antibiotics but supplemented with 0.5% peptone and 0.5% glucose, the latter supplements for induction of UPEC surface colonization (1). Attached bacteria were cultured on the cell layer for a period of 9 h in continuous flow. Gentamicin (and 100 mM IPTG when using UTI89-pEGFP) was then added to the flow medium to reach a final concentration of 100 μg/ml, and the FC culture continued for an additional 20 h. Intracellular bacterial colonization was assessed at this point by terminating and disassembling chambers for inspection of the PD07i-cultured glass slides by fluorescence microscopy or confocal laser scanning microscopy (CLSM). FC cultures that continued to secondary infection were connected to a flow of either gentamicin-free Epilife with 0.5% peptone and 0.5% glucose or urine. Experiments with urine flow were continued for 24 h, during which visible surface growth slowly emerged after 18 to 20 h. Secondary colonizing bacteria were eluted directly from the chambers by detaching the pump and elevating the medium flask to increase flow by hydrostatic pressure and manually tapping the inlet tubing to tear off bacteria by shearing force.
Urine used as flow medium was prepared by filtering through a tea filter, a cellulose prefilter, and 0.45-μm- and 0.2-μm-pore-size filters in succession. Next, the sample was briefly heated to 70°C to ensure sterility and to deactivate potential immune components and then stored at 4°C until use. This procedure did not affect the chemical characteristics of the urine sample or bacterial growth. Urine concentration was measured as urine specific gravity (USG), which equals the density (wt/vol).
During growth periods, a flow rate of 0.9 ml/h was used, which equals a wall shear rate of 2 s−1 as calculated from the chamber dimensions specified above and the volumetric flow rate (4). The calculation is valid under laminar flow conditions, which are indicated by a Reynolds number of 0.07, calculated from the volumetric flow rate, chamber dimensions, and the absolute viscosity, the latter of which is estimated to be 1 × 10⁻³ kg m−1 s−1 (4). The shear rate of 2 s−1 is low and probably reflects the lower shear rates present in vivo, such as during rest. This was applied to ensure that the phenomena observed during bacterial surface colonization did not result from disproportionately high shear compared to the in vivo situation. Based on in situ microscopic observation, the applied flow rate generated a viscous drag sufficient to remove nonattached bacteria, hence preventing static bacterial deposition but supporting colonization of adherent bacteria only. With the applied flow rate, the chamber bulk-phase fluid was replaced each 2 min, ensuring continuous replacement of nutrient medium.
Fluorescence microscopy.
Glass slides from terminated FC experiments were stained with Acti-stain 555 phalloidin (Cytoskeleton Inc.) to visualize BEC cytoskeleton, and anti-type 1 pilus antibody-mediated immunostaining was used to visualize type 1 pili on UTI89 infecting the BECs. BEC cytoskeleton staining was performed by washing the slides in PBS and fixing with 3.7% paraformaldehyde for 10 min followed by cell membrane permeabilization for 5 min with 0.5% Triton X-100. Cells were then stained for 30 min at room temperature with 100 nM Acti-stain 555 phalloidin. Slides were rinsed and mounted for CLSM.
For type 1 pilus immunostaining of infecting bacteria, cell layers were fixed and permeabilized as described above and a freshly prepared 2% solution of bovine serum albumin (BSA)–PBS was added for 15 min to block nonspecific signals. Next, cell layers were incubated with polyclonal rabbit antibodies raised against purified type 1 pili (27) at a 1:200 dilution in 2% BSA for 1 h at room temperature. This was followed by two washes with PBS and incubation with Alexa Fluor 488-labeled goat anti-rabbit secondary antibody at a 1:200 dilution in 2% BSA for 1 h at room temperature, with 100 nM Acti-stain 555 phalloidin added for the last 30 min of incubation.
Harvested filamentous bacteria were membrane stained with FM4-64 dye (1 μg/ml) for 15 min followed by DAPI (4′,6′diamidino-2-phenylindole) (1 μg/ml) for 30 s as a nuclear stain with an intervening wash with PBS. Samples were analyzed by CLSM or on a Leica DMRE fluorescence microscope. Contrast and lighting were corrected using ImageJ software or Adobe Photoshop Elements.
CLSM.
A Zeiss LSM 510 Meta confocal microscope, coupled with a femtosecond Ti:Sa laser (Broadband Mai Tai XF-W2S with 10-W Millennia pump laser, tunable; Spectra Physics, Mountain View, CA), was used for the CLSM. The Acti-stain 555 phalloidin was imaged using a 543-nm excitation laser and was detected through a 565-to-615-nm band pass filter. The green fluorescent protein (GFP) was imaged using a 488-nm laser as the excitation source and was detected using a 500-to-550-nm band pass filter. Confocal reflection microscopy images were collected simultaneously with the GFP images using a 480-to-500-nm band pass filter. Z-stacks were generated using the Zeiss LSM Image Browser.
Flow cytometry.
The degree of filamentation was quantified by means of flow cytometry, a technique previously proven applicable for this purpose (20). In flow cytometry, forward scatter (FSC) signals are mainly generated at the cell surface and hence contain information about the outer proportions of cells. The width of the FSC signal (FSC-W) indicates the duration of the FSC pulse, i.e., the duration of a particle passing through the laser beam. Assuming passage at right angles to the beam, the FSC-W value is an estimate of bacterial length. To account for bacteria or filaments not passing through the laser fully stretched or at right angles to the beam, we collected the FSC area (FSC-A; the integral of the FSC pulse), which further includes the signal intensity, to enable separation of data representing highly elongated filaments as well. Harvested bacteria were pelleted by centrifugation at 1,150 × g for 5 min, resuspended in PBS, and analyzed on a BD FACSAria II flow cytometer (Becton, Dickinson and Company). Data from 105 events per sample were collected and analyzed using BD FACSDiva software (Becton, Dickinson and Company). Time course measurements of filament reversal were done by incubating samples in 50% Epilife and 50% PBS at 37°C, with flow cytometric analyses performed on these samples consecutively each 30 min. Comparisons of mean values were done using unpaired t tests and P values calculated with GraphPad software.
RESULTS
Uropathogenic cascade in vitro.
In previous in vitro studies, UPEC invasion of BECs was induced under static conditions and bacterium-cell contact obtained via centrifugation (6, 7, 12–14, 16, 29, 30, 32, 38). Here, we investigated the course of UPEC infection of human BECs under in vivo-like growth conditions that incorporated the hydrodynamic environment present in the bladder and urinary tract. This was accomplished by infecting BECs in parallel-plate FCs, constructed as shown in Fig. 1A. The semiclosed system of FC-BEC cultures and later FC-BEC/UPEC cocultures was maintained and controlled by adding components to the flow or shifting between the media perfused through the FCs. The progress of initial and secondary surface colonization was monitored through the upper polycarbonate disc by in situ microscopy (Fig. 1B).
After in-chamber infection and incubation overnight in gentamicin to eliminate extracellular bacteria, intracellular colonization was confirmed by fluorescence microscopy or CLSM (Fig. 1B, lower right; further results are described below under “bladder cell invasion”). In the current study, infection was carried out for 9 h, during which time adherent bacteria briefly reached a state of initial surface colonization (Fig. 1B, upper right). Invasion could be observed using sterile flow incubation times down to 2 h but with fewer (<10) invaded cells per chamber (data not shown). The BEC layer appeared undamaged after exposure to bacterial surface colonization and despite ongoing intracellular infection, which allowed us to continue the coculture. Shifting to peptone-glucose-supplemented cell medium without gentamicin led to a second round of surface colonization arising from intracellular survival of the bacteria. The emerging bacterial population consisted of rod-shaped bacteria distributed evenly over the cell layer in a manner similar to that seen in the initial infection depicted in the upper right panel of Fig. 1B. We found that the PD07i cell layer could tolerate a limited, 24-h exposure to urine and still maintain viability, as indicated by the ability to continue culturing the cells after shifting to penicillin-streptomycin-supplemented Epilife (data not shown). This was exploited to study the intracellular UPEC escaping into a hydrodynamic urine milieu similar to what is present on the bladder luminal surface.
As observed by in situ microscopy, exposing invaded, gentamicin-treated BEC layers to urine flow gave rise to de novo surface colonization beginning after 18 to 20 h. The bacterial surface colonies either were evenly dispersed or emerged as distinct bacterial aggregates (the latter shown in Fig. 1B, lower left), depending on the urine specimen used. On closer inspection, the bacterial aggregates on the FC-BEC layer were often observed to be associated with a single, loosely attached cell (Fig. 1B, lower left; see also Figure S1 in the supplemental material), presumably the late-stage colonized host cell from which the bacteria emerged. Interestingly, bacteria in these aggregates were highly filamentous. Filamentous bacteria were observed only when using moderately to highly concentrated urine, with an increasing degree of filamentation observed with higher urine concentrations.
As further described below, the filamentous UPEC strains were capable of restoring cell division and reverting to their original rod shapes, as has also been reported for mouse bladder filaments (22). Infecting new FC-BEC layers with this population showed that the reverted bacteria could invade other cells (data not shown). Hence, the in vitro FC-based model of human bladder cell infection presented here (Fig. 1) reproduces the main steps of the cyclic, intracellular cascade observed in mice.
Bladder cell invasion.
Studies of statically infected BECs and infected mouse bladders have shown that invading UPEC bacteria are taken up into membrane-bound compartments, where they either stay and enter a quiescent, nonreplicative state or break out into the cytoplasm, at which point they replicate into large intracellular colonies, ultimately leading to host cell death (15, 39). A further characteristic of the intracellular colonies observed in mouse bladders is a distinct coccoid shape adopted by UPEC (22). In order to establish whether invasion occurred in our FC-BEC infection model and whether these intracellular lifestyle characteristics were present after FC infection, we analyzed the infected FC cultures by fluorescence microscopy and CLSM. At 20 h postinfection, the majority of PD07i cells were observed to harbor one or more bacteria. Fewer (5 to 10%) cells were observed to contain intracellular colonies appearing either as cytosolic aggregates (Fig. 2A) or as tightly packed bacteria enclosed in what appeared to be vacuolar compartments (Fig. 2B). Actin staining indicated the outer cell membrane boundary and clearly showed that bacteria were intracellular (Fig. 2A). Often, intracellular bacteria with a diminished, coccoid shape were observed (Fig. 2A, inset). Extensive cytosolic colonization was occasionally observed (Fig. 2C; see also Fig. 4E), although these cells were relatively rare, probably because of the flow conditions in the FC, which continuously remove detached, dying cells. Bacteria in such heavily colonized cells appeared to have regained their original rod shape (Fig. 2C; see also Fig. 4E). Overall, these results show that invasion occurs under the FC conditions and that the same visual characteristics are present as had been reported from murine UTI models and static cell culture infection assays.
Fig 2.

Intracellular colonization of FC-PD07i cell layers. PD07i cell layers were infected with UTI89-pEGFP in FCs as described in the text, with subsequent gentamicin treatment followed by inspection with CLSM (A and B) or fluorescence phase-contrast microscopy (C). For the CLSM images, cytoskeleton and membrane boundaries were visualized by Acti-stain 555 and cell nuclei were visualized using the background laser signal (red). (A) Invaded binuclear PD07i cell with cytosolic UTI89-pEGFP. Bacteria were coccoid in shape, as shown in the inset. Vertical and horizontal cross-sections of the Z-stack are shown. (B) Invading UTI89-pEGFP appears to be localized to vesicle compartments. The image at the right shows the actin stain alone, indicating vesicle boundaries (arrows). (C) late-stage intracellularly colonized PD07i cell. Bars, 10 μm.
Fig 4.

Filament enrichment on FC-BEC layers correlates with observed increased filament adhesion. (A) Examples showing the difference in filamentation after 24 h of FC secondary surface colonization (black columns) compared to that seen after 24 h of UTI89 static suspension growth (gray columns) in highly and moderately concentrated urine. Mean values representing the results of two independent FC experiments and three static experiments are shown; P = 0.0023 and 0.0051, respectively (two-sample t test). (B) Microscopy of UTI89 statically grown for 24 h in the most concentrated urine tested in FCs (compare with Fig. 3H). (C) PD07i cell obtained during filament harvest, showing tight association with filaments. (D) Fluorescence micrograph showing type 1 pili on a harvested filament. (E) CLSM analysis of UPEC type 1 pilus expression in an extensively colonized, partly degraded cell in the FC-BEC layer. The left image shows type 1 pilus-expressing UTI89 in the BEC cytoplasm next to a distorted cell nucleus. The middle and right images are scans made at positions of successively increasing heights (indicated with symbols), showing type 1 pilus-expressing UTI89 in the upper part of the cell (middle image) and filamentous UTI89 bacteria at the cell membrane that express type 1 pili along their lengths (right image). Bars, 10 μm (C, D, and E) and 20 μm (B).
Filamentation.
Filamentous UPEC outgrowth from invaded uroepithelium cells observed in murine models (22, 24, 32) has to our knowledge never been replicated in vitro and was therefore never investigated in detail, despite its suggested role in the pathogenesis of secondary infection and evasion of host response (20, 24). The filamentous response observed in our model (Fig. 1B, lower left, and Fig. 3A and B) was therefore elucidated further with respect to inducing factors and cellular characteristics. Membrane-specific staining showed that the filaments were not bacterial chains but rather true filamentous bacteria with unconstricted cell membranes, although preformed, partial septa were often observed at variable distances along the filament length (Fig. 3C), similar to what was previously reported for filaments observed in the mouse bladder (32). DAPI staining showed that DNA in filamentous bacteria was often partly segregated as shown in Fig. 3C, but filaments with evenly distributed DNA were also observed (data not shown).
Fig 3.
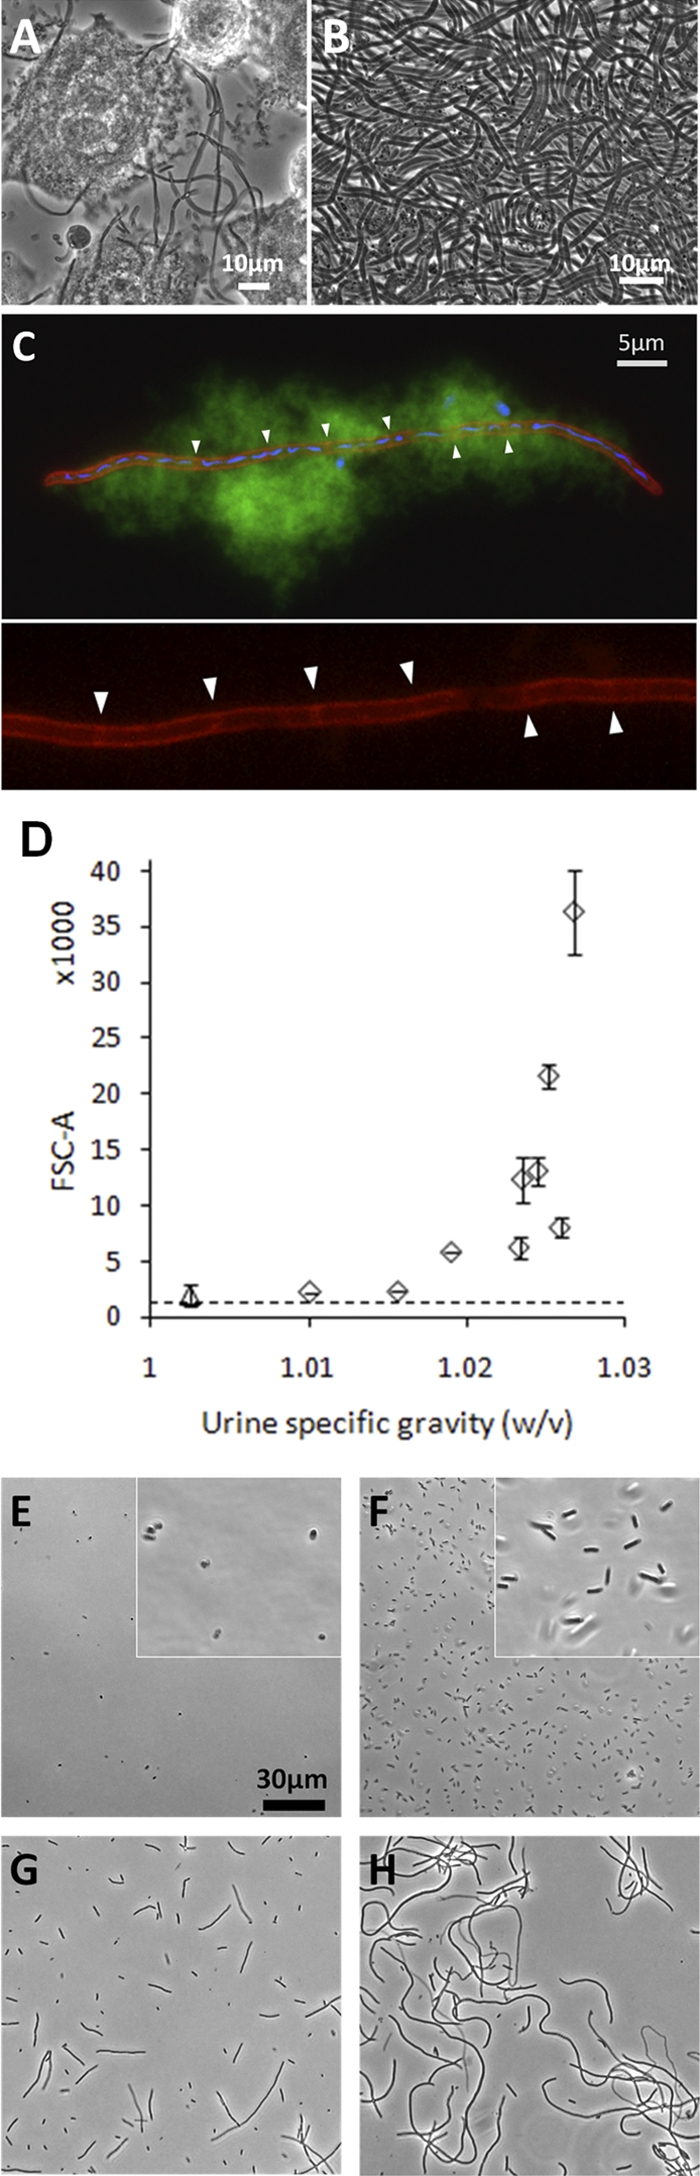
UPEC filamentation during secondary infection in vitro. (A) Phase-contrast microscopy of a PD07i cell layer after FC infection with UTI89 and secondary surface colonization in moderately concentrated urine. (B) Bacterial harvest after secondary surface colonization in highly concentrated urine showed an essentially 100% filamentous population. (C) Membrane and DNA visualized in harvested filament by the use of FM4-64 and DAPI dyes, respectively. As is characteristic for sessile growth, the filament is embedded in biofilm slime, as visualized by its autofluorescence in the green channel. Partial septa are indicated with arrowheads in the magnified inset in the lower panel, showing the red channel only. (D) FSC-A values measured for bacteria harvested after secondary surface colonization in urine specimens at 10 different concentrations. Counts (105) were collected for each sample, and each point in the graph indicates the mean value of the results of two independent experiments with ±1 SD. The dotted line indicates the mean FSC-A value for agar-plated UTI89. Data from samples obtained using the most dilute urine differentiated from the other points in that those samples did not originate from visible surface colonization (see text) and hence are marked with a triangle. (E to H) Phase-contrast images of UTI89 harvested after secondary surface colonization in urine specimens with USG values of 1.0025 (E), 1.0156 (F), 1.0235 (G), and 1.0268 (H).
Experiments performed with different urine samples yielded different degrees of filamentation and suggested a dependence on urine concentration. To elucidate such a potential relationship, we investigated the filamentous response after infection of FC-BEC layers and secondary surface colonization in 10 urine samples of different concentrations (USG values) within the normal human range of 1.002 to 1.03 (Fig. 3D to H). The degree of filamentation was quantified by means of flow cytometry, with the FSC-A value indicating mean bacterial length. Figure 3D shows increasing FSC-A values for bacteria escaping the BEC layer in urine specimens of increasing concentrations (FSC-W values are shown in Fig. S2 in the supplemental material). The increases in FSC-A values with increasing urine concentrations corresponded well with microscopic observations (Fig. 3E to H). Urine concentrations with USG values up to 1.016 yielded nonfilamentous bacteria (Fig. 3E and F) with FSC-A values below 5,000, which was similar to values measured for agar-plated UTI89 (Fig. 3D, dashed line). Urine specimens with USG values of 1.019 to 1.027 all yielded some degree of filamentation, with increasing filamentation observed and measured with increasing USG values, except for an outlier at USG = 1.026, which yielded only slight filamentation with a corresponding relatively low FSC-A value (Fig. 3D).
Exposing the invaded FC-BEC layer to the most dilute urine specimen tested (USG = 1.0025) did not support secondary surface colonization, as observed by in situ microscopy (data not shown). Bacteria could, however, be harvested from these chambers, and they exhibited a diminished, coccoid shape (Fig. 3E). The FSC-A values determined for these samples did not differ from those determined for agar-plated UTI89; however, FSC-W measurements corresponded to the microscopic examination results and showed lower values (see Fig. S2 in the supplemental material), most likely due to a higher sensitivity of the FSC-W signal for small particles. The size of the bacteria observed was reminiscent of that of the coccoid, intracellular bacteria (Fig. 2A and B), suggesting they might have been intracellular UPEC bacteria released from BECs that erupted when increased hydrodynamic force were exerted during harvesting.
To keep unknown variables at a minimum in tests of the influence of urine concentration, the urine samples used for the flow cytometric measurements were obtained from the same healthy donor, and each sample was from one individual urination. Corresponding filamentous responses were also observed with urine specimens from three other healthy donors (data not shown). The filamentation observed was not a result of chemical decomposition or other alterations of the urine sample during storage or preparation, since corresponding filamentous responses were observed also when using fresh urine samples connected to FCs immediately after sampling and sterile filtration.
Previous studies on the elucidation of the proposed uropathogenic cascade were carried out by infecting mice with the UTI89 UPEC strain, which we also used in the current study. To establish whether the observed behavior could be induced in other strains, we tested two other UPEC strains, NU14 and a clinical UPEC isolate from our own laboratory, 34476 (1), as well as the nonpathogenic ATCC 25922 strain. Static invasion assays indicated that all three strains were invasive (data not shown). After FC infection, overnight gentamicin treatment, and application of urine flow, NU14 and 34476, but not ATCC 25922, were able to proceed to secondary surface colonization. During secondary surface colonization in a flow of concentrated urine (USG = 1.0263), NU14 exhibited strong filamentation (FSC-A = 27.382; standard deviation [SD] = 3.118) comparable to that seen with UTI89. Under these conditions, 34476 also exhibited filamentous growth, albeit the effect was somewhat less pronounced (FSC-A = 13.368; SD = 3.911). As with UTI89 infection, cells with sprouting filaments were observed during NU14 secondary surface colonization, and NU14 as well as 34476 filaments were capable of reverting to single cells (data not shown). Hence, the behavior characteristic of UTI89 during infection of bladder cells occurs with other UPEC strains as well.
It was previously suggested that the filamentation observed in mouse bladders is triggered by SulA, a cell division inhibitor associated with the SOS response (24). To elucidate the possible involvement of SulA in the filamentation observed in our FCs, we constructed a UTI89 sulA deletion mutant and tested the filamentation capacity of this strain. We found that the UTI89ΔsulA mutant filamented to a degree similar to that seen with the wild type (data not shown), indicating that this process is independent of the bacterial SOS response.
Filament adhesion to BECs.
The nearly 100% filamentation shown in Fig. 3B and H occurred only during the FC-controlled secondary infection and not in static cultures in the same urine specimens (Fig. 4A and B). Static incubations in highly concentrated urine did, however, induce some elongation and slight filamentation of bacteria (Fig. 4B), suggesting that urine characteristics, as well as the physical growth conditions on the FC-BEC layer, influence filamentation.
It was previously proposed that the extended length of filamentous UPEC provides a more secure attachment to the uroepithelium through additional adhesin contact points, thus explaining the apparent difficulty faced by phagocytes in clearing filaments from the bladder surface (24). Increased adhesion potential would also be an advantage in resisting urine shear forces. In our model, we observed spotwise growth and little bacterial dispersal of the filamentous colonization (Fig. 1B, lower left), indicating a tight association of the filaments with the initial focus of colonization. Furthermore, when we retrieved the presumed host cells observed in the emerging aggregates (Fig. 1B, lower left), the filaments appeared tightly associated with these cells (Fig. 4C). Finally, filaments in direct contact with the FC-BEC layer were difficult to remove and resisted liquid shear forces at levels more than 50 times those applied during growth (data not shown).
If filaments exhibit increased adhesion via increased contact points, a likely candidate for such contact points would be the E. coli type 1 pilus, which, via its tip adhesin, FimH, establishes specific contact with the uroepithelium in vivo (39). Immunostaining of harvested filaments showed that type 1 pili are distributed abundantly along the filament membrane (Fig. 4D). In accordance with previous observations of UTI89-invaded mouse bladder cells (3), UTI89 in the cytoplasm of late-stage-infected PD07i cells expressed type 1 pili (Fig. 4E). The filamentous bacteria at the erupting cell membrane (Fig. 4E, right) appear to have continued this pilus expression, as they elongated when exposed to the urine flow conditions on the cell exterior.
The abundant type 1 pili on filaments might increase adhesion in vivo and in the current model. It is, however, possible that the contribution of specific FimH adhesion to the PD07i cells is different, since it is presently unknown to what extent the FimH receptor, uroplakin (39), is presented on the surface of these cells. We found that, upon infection of FC-BEC layers with a UTI89 fimH deletion mutant and treatment with gentamicin, secondary surface colonization occurred, indicating that initial adhesion and invasion of the BECs are not completely abolished in the absence of FimH. This is in accordance with a previous report by Berry and coworkers (6). Current methods, however, did not allow us to precisely quantify the adhesion strength of this mutant.
Filament reversal.
In order to retain reinvasion capacity, filaments should be capable of reverting to the original rod shape. Reversal has been previously observed to occur for filaments in infected mouse bladders (22). The majority of filaments generated in our FC-BEC infection model were observed also to revert partially or completely when removed from the FC conditions and inspected microscopically (Fig. 5A and B, see also Fig. S3 and S4 in the supplemental material). When observed at room temperature, filament reversal typically started within 0.5 to 1 h after harvest and continued for the following 3 to 4 h. Even filaments well above 100 μm in length retained their capacity to fully revert to normally shaped rods (see Fig. S3 in the supplemental material), demonstrating that filaments contain high numbers of viable single cells. Reversal of longer filaments appeared to occur in two steps. When observed at room temperature, a few initial, relatively short-duration (<1 h) divisions yielded ∼20-μm-long subfilaments. These slowly divided into normally shaped rods after an additional 3 h (see Fig. S3 in the supplemental material).
Fig 5.

UTI89 filament reversal to rod-shaped bacteria. (A) A filament adhering to a PD07i cell undergoes reversal. (B) Reversal of a harvested filament. (C) Time course measurements of FSC-A values of three samples exhibiting different initial degrees of filamentation. The samples were harvested after secondary surface colonization in urine specimens with the USG values indicated in the graph. (D) Histogram overlay showing the time-dependent shift in FSC-A of the sample with highest initial FSC-A value from the experiment in which the urine with USG = 1.0252 was used. Pink, red, green, and blue histograms in the overlay refer to time points 0, 30, 60, and 90 min after harvest.
To quantify the reversal phenomenon, filamentous UPEC samples were allowed to revert in suspension at 37°C and FSC-A values were recorded every 30 min. Figure 5C shows the results of representative time course measurements of three harvests obtained after secondary surface colonization in urine specimens of three different concentrations. The samples showed gradually decreasing FSC-A values and reached levels corresponding to 100% rod-shaped populations after 90 to 180 min. The most filamentous sample appeared to reach the lower baseline in two steps, interrupted by a plateau between 100 and 160 min (Fig. 5C). This possibly reflects the two-step reversal process observed microscopically, particularly for long filaments (see Fig. S3 in the supplemental material). Figure 5D shows a histogram overlay of the results of analysis of the sample with the highest initial mean FSC-A value in Fig. 5C. In addition to showing the general trend toward lower values, the histogram illustrates the change from an initially wide distribution of bacteria lengths to a subsequent uniform population of rods.
The results in Fig. 5C and D represent the reversal process in BEC culture medium. Similar results were obtained using dilute urine or PBS, with a main difference being a slower drop in FSC values and an inability to completely revert in PBS alone (data not shown), presumably due to the lack of an energy source to drive the reversal process.
DISCUSSION
The ability of UPEC to invade and proliferate in murine BECs is well established. Investigation based mainly on the murine model of UTI has led to the formulation of the hypothesis of a complex intracellular uropathogenic cascade in which invading UPEC bacteria alternate between intracellular and extracellular life to circumvent host defense mechanisms (reviewed in references 8, 21, 23, 25, 33 and 42). UPEC invasion of microtiter plate-cultured human BECs can be induced (29), and this method has been used extensively to study initial invasion events, primarily in the bladder carcinoma cell line 5637 (7, 11–14, 16, 29, 30, 32, 38, 41) and recently also in the virus-immortalized uroepithelial cell line PD07i (6). Clinical studies have not yet been able to determine the extent of invasion and whether this uropathogenic cascade is involved in human recurrent UTI (9). However, in support of the idea of the existence of a cascade in humans, intracellular bacterial communities and bacterial filaments have been identified in the urine specimens of UTI patients (36). To further elucidate the steps of the uropathogenic cascade and its putative role in human UTI, in vitro bladder cell models are needed. Here, we report an in vitro model that enables reproduction of infection steps downstream of initial invasion. The model extends the standard microtiter plate adhesion-invasion assay by incorporating the hydrodynamic conditions present in the bladder and urinary tract and allows controlled, sessile colonization on the BEC layer surface similar to what would occur in vivo.
It has been shown that E. coli exhibits considerably altered global gene expression when cultured on a surface compared to planktonic broth culture results (5). This emphasizes the importance of incorporating surface culturing and near-physiological conditions in in vitro models. To further substantiate this, O'Toole and coworkers, using an airway epithelial infection model, recently showed that the human pathogen Pseudomonas aeruginosa cultured on epithelial cells was distinct from its planktonically grown counterpart. Moreover, P. aeruginosa behaved differently when grown on the epithelium surface compared to an abiotic surface (2). In the current report, we show that even under physiological surface colonization conditions, UPEC invades human uroepithelial cells and the visual characteristics of the invasive bacteria observed in static assays are present in the FC-BEC infection model.
Removal of the extracellular gentamicin inhibition allowed a second round of surface colonization by bacteria surviving in intracellular niches. When a flow of concentrated urine was applied during secondary surface colonization by escaping UTI89, the bacteria emerged in a highly filamentous shape. Using flow cytometry and microscopy to estimate the degrees of filamentation during secondary surface colonization in different urine specimens, we found that filamentation depended on urine concentration, with close to 100% filamentation induced using highly concentrated urine specimens. One urine sample (USG = 1.0259) reproducibly gave rise to an atypically low degree of filamentation, suggesting that parameters other than overall solute concentration might influence induction of filamentation. We did not find any correlation between urine pH and filamentation (data not shown). Instead, the content of specific, as-yet-unknown components of urine may be the inducer of filamentation, with variations in the urine composition resulting in the divergences observed.
Interestingly, static incubations of UTI89 in the same urine specimens did not give rise to the same degree of filamentation as that seen with UTI89 reemerging from FC-cultured BECs. This suggests an influence of the BEC layer or the sessile growth mode on filamentation. During the secondary surface colonization by escaping UTI89, we observed that bacteria seeded from the cell surface colony onto the polycarbonate lid filamented to a degree similar to that seen with those residing on the BEC layer (data not shown), suggesting that substratum properties have little influence on filamentation. Instead, the high degree of filamentation of the surface-colonizing UPEC could result from increased adhesion capacity. This finding is in agreement with the speculation by Young that bacterial elongation and filamentation might provide a selective advantage during growth on surfaces exposed to liquid shear (43). Observations in the current study indicated that filaments stay firmly attached to the host cell from which they escape and that surface-attached filaments appear to resist strong liquid shear forces. It is therefore probable that filamentous UPEC bacteria obtain a selective advantage through increased adhesion capacity in the hydrodynamic environment. Septation is delayed or inhibited in a subpopulation of the infecting UPEC bacteria by the stress of growing in concentrated urine, as observed during static growth. These elongating bacteria establish more contact points with respect to the surface and thus exhibit an advantage in coping with liquid shear. The selective advantage of bacteria suppressing cell division ultimately leads to surface colonies of extremely filamentous bacteria. Although this hypothesis requires further experimental evidence, it suggests that the UPEC filamentous response might not be strictly linked to the putative intracellular uropathogenic cascade but might occur as a general response to the various physical and chemical growth conditions in the bladder.
It is reasonable to suggest that the filament induction observed in our model also occurs in vivo and is likely to be the same response that causes the filamentation observed in mouse bladders (22, 24, 32) and in human urine samples (36). A putative correlation to the filamentous response in mouse bladders is emphasized by the fact that mouse urine is more concentrated than human urine, with USG values ranging between 1.045 and 1.064 (35), which in our model would be expected to yield extensive filamentation. The prevalence of UPEC filamentation in mice compared to the presence of filaments in less than half of the urine specimens from UTI patients (36) may be explained by the differences in the typical concentrations of murine and human urine.
Although the suggested urine stress-adhesion pathway to filamentation is likely to contribute significantly to filamentation in vivo, the possibility cannot be ruled out that other pathways stimulate filamentation in vivo as well. Justice et al. reported the absence of UPEC filaments in mice deficient in Toll-like receptor 4 (TLR-4) (22), which suggests that the host innate immune response is involved in filament induction. In addition, the cell division inhibitor SulA, which is induced as part of the SOS stress response, was suggested to be responsible for UPEC filamentation in the mouse model, since expression of a gfp-sulA reporter could be detected in situ in filamentous bacteria (24). Moreover, bacterial filaments were reported to be absent in mouse bladders infected by a UTI89ΔsulA strain, although it was noted that the general bacterial load during secondary infection with this strain was much lower than during wild-type infection (24). In our system, filamentation was not depressed in a UTI89ΔsulA strain and our results therefore did not confirm the involvement of SulA. The explanation for this discrepancy is presently unclear; however, it might be that the generally low bacterial count in mice infected with the UTI89ΔsulA strain hinders the detection of filaments.
Different functions have been attributed to filamentation. The elongated shape of filaments has been shown to provide protection against phagocyte killing (20). Furthermore, Mulvey and colleagues reported that filaments in mouse bladders appeared to form bridges between adjacent cells (32), suggesting that filamentation helps bacteria to reach neighboring cells before the host cell exfoliates (36). Correspondingly, we often observed exfoliated cells trapped inside the emerging aggregate of filamentous UPEC bacteria, indicating that the mesh of filaments serves to anchor not only the filaments themselves but also exfoliating, colonized BECs to the site of infection.
Overall, it is plausible that filamentation increases the chance for UPEC to successfully infect the bladder. This potential role of UPEC filamentation, together with the dependence on urine concentration demonstrated here, provides a rationale for the general advice given to cystitis patients to drink plenty of water. The general belief is that the resulting higher urinary output increases the flushing out of colonizing bacteria. In light of the current results, another explanation could be that filamentation is prevented in the dilute urine, which decreases the adhesion capacity and the overall pathogenic potential of UPEC, leading to its faster clearance.
In conclusion, we have established an in vitro model of bladder cell infection that enabled us to replicate the elements of the proposed uropathogenic cascade by the use of human bladder cells and urine as well as FC-controlled hydrodynamic conditions. As in the murine model of UTI, we observed the characteristic morphological transitions of UPEC going through this cycle, from an intracellular, coccoid shape to a highly filamentous shape during cellular exit followed by reversion to the typical rod shape. The transitions to and from the filamentous form were, however, dependent on urine concentrations and surface colonization and were not induced by an inflammatory response, which has been proposed to play a role in filamentation in the murine model (20, 22, 24). Filamentation during escape from uroepithelium cells is commonly discussed and depicted in models of the uropathogenic cascade (8, 21, 23, 25, 33, 42). However, filamentation of escaping wild-type UPEC has never been replicated in vitro; thus, the molecular details of this response are still unclear. The model reported here provides an opportunity to further investigate this response. Furthermore, we observed and monitored the time course of filament reversal. The capacity of filaments to revert to rod-shaped bacteria of normal length shows that filamentation is not a result of lethal damage but is rather a transitory state in which the pathogenic potential of the bacteria remains. The filamentation observed in our model was found to be independent of the typical SulA-mediated inhibition of cell division; hence, the molecular mechanisms triggering the formation as well as the reversal of these filaments are unknown and may involve novel molecular pathways in E. coli. These underlying mechanisms controlling the steps of late and secondary UPEC infection and their potential role in recurrent UTI await further study.
Supplementary Material
ACKNOWLEDGMENTS
We thank David J. Klumpp for generously donating the PD07i cell line.
This work was supported by the Danish Natural Science Research Council.
Footnotes
Published ahead of print 21 February 2012
Supplemental material for this article may be found at http://iai.asm.org/.
REFERENCES
- 1. Andersen TE, et al. 2010. A flow chamber assay for quantitative evaluation of bacterial surface colonization used to investigate the influence of temperature and surface hydrophilicity on the biofilm forming capacity of uropathogenic Escherichia coli. J. Microbiol. Methods 81:135–140 [DOI] [PubMed] [Google Scholar]
- 2. Anderson GG, Moreau-Marquis S, Stanton BA, O'Toole GA. 2008. In vitro analysis of tobramycin-treated Pseudomonas aeruginosa biofilms on cystic fibrosis-derived airway epithelial cells. Infect. Immun. 76:1423–1433 [DOI] [PMC free article] [PubMed] [Google Scholar]
- 3. Anderson GG, et al. 2003. Intracellular bacterial biofilm-like pods in urinary tract infections. Science 301:105–107 [DOI] [PubMed] [Google Scholar]
- 4. Bakker DP, van der Plaats A, Verkerke GJ, Busscher HJ, van der Mei HC. 2003. Comparison of velocity profiles for different flow chamber designs used in studies of microbial adhesion to surfaces. Appl. Environ. Microbiol. 69:6280–6287 [DOI] [PMC free article] [PubMed] [Google Scholar]
- 5. Beloin C, et al. 2004. Global impact of mature biofilm lifestyle on Escherichia coli K-12 gene expression. Mol. Microbiol. 51:659–674 [DOI] [PubMed] [Google Scholar]
- 6. Berry RE, Klumpp DJ, Schaeffer AJ. 2009. Urothelial cultures support intracellular bacterial community formation by uropathogenic Escherichia coli. Infect. Immun. 77:2762–2772 [DOI] [PMC free article] [PubMed] [Google Scholar]
- 7. Bishop BL, et al. 2007. Cyclic AMP-regulated exocytosis of Escherichia coli from infected bladder epithelial cells. Nat. Med. 13:625–630 [DOI] [PubMed] [Google Scholar]
- 8. Cegelski L, Marshall GR, Eldridge GR, Hultgren SJ. 2008. The biology and future prospects of antivirulence therapies. Nat. Rev. Microbiol. 6:17–27 [DOI] [PMC free article] [PubMed] [Google Scholar]
- 9. Czaja CA, et al. 2009. Prospective cohort study of microbial and inflammatory events immediately preceding Escherichia coli recurrent urinary tract infection in women. J. Infect. Dis. 200:528–536 [DOI] [PMC free article] [PubMed] [Google Scholar]
- 10. Datsenko KA, Wanner BL. 2000. One-step inactivation of chromosomal genes in Escherichia coli K-12 using PCR products. Proc. Natl. Acad. Sci. U. S. A. 97:6640–6645 [DOI] [PMC free article] [PubMed] [Google Scholar]
- 11. Dhakal BK, Mulvey MA. 2009. Uropathogenic Escherichia coli invades host cells via an HDAC6-modulated microtubule-dependent pathway. J. Biol. Chem. 284:446–454 [DOI] [PMC free article] [PubMed] [Google Scholar]
- 12. Duncan MJ, Li G, Shin JS, Carson JL, Abraham SN. 2004. Bacterial penetration of bladder epithelium through lipid rafts. J. Biol. Chem. 279:18944–18951 [DOI] [PubMed] [Google Scholar]
- 13. Eto DS, Gordon HB, Dhakal BK, Jones TA, Mulvey MA. 2008. Clathrin, AP-2, and the NPXY-binding subset of alternate endocytic adaptors facilitate FimH-mediated bacterial invasion of host cells. Cell. Microbiol. 10:2553–2567 [DOI] [PubMed] [Google Scholar]
- 14. Eto DS, Jones TA, Sundsbak JL, Mulvey MA. 2007. Integrin-mediated host cell invasion by type 1 piliated uropathogenic Escherichia coli. PLoS Pathog. 3:e100 doi:10.1371/journal.ppat.0030100 [DOI] [PMC free article] [PubMed] [Google Scholar]
- 15. Eto DS, Mulvey MA. 2007. Flushing bacteria out of the bladder. Nat. Med. 13:531–532 [DOI] [PubMed] [Google Scholar]
- 16. Eto DS, Sundsbak JL, Mulvey MA. 2006. Actin-gated intracellular growth and resurgence of uropathogenic Escherichia coli. Cell. Microbiol. 8:704–717 [DOI] [PubMed] [Google Scholar]
- 17. Foxman B. 2002. Epidemiology of urinary tract infections: incidence, morbidity, and economic costs. Am. J. Med. 113(Suppl. 1A):5S–13S [DOI] [PubMed] [Google Scholar]
- 18. Foxman B. 2003. Epidemiology of urinary tract infections: incidence, morbidity, and economic costs. Dis. Mon. 49:53–70 [DOI] [PubMed] [Google Scholar]
- 19. Frimodt-Møller N. 2006. Urinvejsinfektioner, p 107–119 In Kjeldsen K, Nielsen LP, Peterslund NA. (ed), Infektionssygdomme og mikrobiologi. Akademisk Forlag, Copenhagen, Denmark [Google Scholar]
- 20. Horvath J, et al. 2011. Morphological plasticity promotes resistance to phagocyte killing of uropathogenic Escherichia coli. Microbes Infect. 13:426–437 [DOI] [PMC free article] [PubMed] [Google Scholar]
- 21. Hunstad DA, Justice SS. 2010. Intracellular lifestyles and immune evasion strategies of uropathogenic Escherichia coli. Annu. Rev. Microbiol. 64:203–221 [DOI] [PubMed] [Google Scholar]
- 22. Justice SS, et al. 2004. Differentiation and developmental pathways of uropathogenic Escherichia coli in urinary tract pathogenesis. Proc. Natl. Acad. Sci. U. S. A. 101:1333–1338 [DOI] [PMC free article] [PubMed] [Google Scholar]
- 23. Justice SS, Hunstad DA, Cegelski L, Hultgren SJ. 2008. Morphological plasticity as a bacterial survival strategy. Nat. Rev. Microbiol. 6:162–168 [DOI] [PubMed] [Google Scholar]
- 24. Justice SS, Hunstad DA, Seed PC, Hultgren SJ. 2006. Filamentation by Escherichia coli subverts innate defenses during urinary tract infection. Proc. Natl. Acad. Sci. U. S. A. 103:19884–19889 [DOI] [PMC free article] [PubMed] [Google Scholar]
- 25. Kau AL, Hunstad DA, Hultgren SJ. 2005. Interaction of uropathogenic Escherichia coli with host uroepithelium. Curr. Opin. Microbiol. 8:54–59 [DOI] [PubMed] [Google Scholar]
- 26. Klumpp DJ, et al. 2001. Uropathogenic Escherichia coli potentiates type 1 pilus-induced apoptosis by suppressing NF-kappa B. Infect. Immun. 69:6689–6695 [DOI] [PMC free article] [PubMed] [Google Scholar]
- 27. Krogfelt KA, Klemm P. 1988. Investigation of minor components of Escherichia coli type 1 fimbriae—protein chemical and immunological aspects. Microb. Pathog. 4:231–238 [DOI] [PubMed] [Google Scholar]
- 28. Mabeck CE. 1972. Treatment of uncomplicated urinary-tract infection in nonpregnant women. Postgrad. Med. J. 48:69–75 [PMC free article] [PubMed] [Google Scholar]
- 29. Martinez JJ, Mulvey MA, Schilling JD, Pinkner JS, Hultgren SJ. 2000. Type 1 pilus-mediated bacterial invasion of bladder epithelial cells. EMBO J. 19:2803–2812 [DOI] [PMC free article] [PubMed] [Google Scholar]
- 30. Martinez JJ, Hultgren SJ. 2002. Requirement of Rho-family GTPases in the invasion of type 1-piliated uropathogenic Escherichia coli. Cell. Microbiol. 4:19–28 [DOI] [PubMed] [Google Scholar]
- 31. Mulvey MA, et al. 1998. Induction and evasion of host defenses by type 1-piliated uropathogenic Escherichia coli. Science 282:1494–1497 [DOI] [PubMed] [Google Scholar]
- 32. Mulvey MA, Schilling JD, Hultgren SJ. 2001. Establishment of a persistent Escherichia coli reservoir during the acute phase of a bladder infection. Infect. Immun. 69:4572–4579 [DOI] [PMC free article] [PubMed] [Google Scholar]
- 33. Mulvey MA, Schilling JD, Martinez JJ, Hultgren SJ. 2000. Bad bugs and beleaguered bladders: interplay between uropathogenic Escherichia coli and innate host defenses. Proc. Natl. Acad. Sci. U. S. A. 97:8829–8835 [DOI] [PMC free article] [PubMed] [Google Scholar]
- 34. Nielubowicz GR, Mobley HLT. 2010. Host-pathogen interactions in urinary tract infection. Nat. Rev. Urol. 7:430–441 [DOI] [PubMed] [Google Scholar]
- 35. Parfentjev IA, Perlzweig WA. 1933. The composition of the urine of white mice. J. Biol. Chem. 100:551–555 [Google Scholar]
- 36. Rosen DA, Hooton TM, Stamm WE, Humphrey PA, Hultgren SJ. 2007. Detection of intracellular bacterial communities in human urinary tract infection. PLoS Med. 4:e329. [DOI] [PMC free article] [PubMed] [Google Scholar]
- 37. Russo TA, Stapleton A, Wenderoth S, Hooton TM, Stamm WE. 1995. Chromosomal restriction-fragment-length-polymorphism analysis of Escherichia coli strains causing recurrent urinary-tract infections in young women. J. Infect. Dis. 172:440–445 [DOI] [PubMed] [Google Scholar]
- 38. Schilling JD, Mulvey MA, Vincent CD, Lorenz RG, Hultgren SJ. 2001. Bacterial invasion augments epithelial cytokine responses to Escherichia coli through a lipopolysaccharide-dependent mechanism. J. Immunol. 166:1148–1155 [DOI] [PubMed] [Google Scholar]
- 39. Sivick KE, Mobley HLT. 2010. Waging war against uropathogenic Escherichia coli: winning back the urinary tract. Infect. Immun. 78:568–585 [DOI] [PMC free article] [PubMed] [Google Scholar]
- 40. Skjøt-Rasmussen L, et al. 2011. Persisting clones of Escherichia coli isolates from recurrent urinary tract infection in men and women. J. Med. Microbiol. 60:550–554 [DOI] [PubMed] [Google Scholar]
- 41. Song J, et al. 2009. TLR4-mediated expulsion of bacteria from infected bladder epithelial cells. Proc. Natl. Acad. Sci. U. S. A. 106:14966–14971 [DOI] [PMC free article] [PubMed] [Google Scholar]
- 42. Wiles TJ, Kulesus RR, Mulvey MA. 2008. Origins and virulence mechanisms of uropathogenic Escherichia coli. Exp. Mol. Pathol. 85:11–19 [DOI] [PMC free article] [PubMed] [Google Scholar]
- 43. Young KD. 2006. The selective value of bacterial shape. Microbiol. Mol. Biol. Rev. 70:660–703 [DOI] [PMC free article] [PubMed] [Google Scholar]
Associated Data
This section collects any data citations, data availability statements, or supplementary materials included in this article.