

Abstract
We studied how conduction delays of action potentials in an unmyelinated axon depended on the history of activity and how this dependence was changed by the neuromodulator dopamine (DA). The pyloric dilator axons of the stomatogastric nervous system in the lobster, Homarus americanus, exhibited substantial activity-dependent hyperpolarization and changes in spike shape during repetitive activation. The conduction delays varied by several milliseconds per centimeter, and, during activation with realistic burst patterns or Poisson-like patterns, changes in delay occurred over multiple timescales. The mean delay increased, whereas the resting membrane potential hyperpolarized with a time constant of several minutes. Concomitantly with the mean delay, the variability of delay also increased. The variability of delay was not a linear or monotonic function of instantaneous spike frequency or spike shape parameters, and the relationship between these parameters changed with the increase in mean delay. Hyperpolarization was counteracted by a hyperpolarization-activated inward current (Ih), and the magnitude of Ih critically determined the temporal fidelity of spike propagation. Pharmacological block of Ih increased the change in delay and the variability of delay, and increasing Ih by application of DA diminished both. Consequently, the temporal fidelity of pattern propagation was substantially improved in DA. Standard measurements of changes in excitability or delay with paired stimuli or tonic stimulation failed to capture the dynamics of spike conduction. These results indicate that spike conduction can be extremely sensitive to the history of axonal activity and to the presence of neuromodulators, with potentially important consequences for temporal coding.
Introduction
The dynamics of neural communication are typically assessed using electrophysiological recordings from proximal neuronal compartments, and the subsequent propagation of spikes along axons is assumed to be relatively faithful. However, numerous studies have reported activity-dependent changes in conduction velocity (Debanne, 2004; Bucher and Goaillard, 2011; Debanne et al., 2011). As a result, a temporal neural code can be altered between spike initiation and transmitter release onto postsynaptic neurons. The presence of voltage-gated ion channels with different gating properties can lead to a highly nonlinear relationship between spiking history and propagation speed. Although the original description of axonal excitability was based on only two voltage-gated conductances (Hodgkin and Huxley, 1952), most axons have a diverse selection of voltage-gated ion channels along their entire path (Krishnan et al., 2009; Bucher and Goaillard, 2011). During repetitive activity, these channels affect excitability and conduction velocity at different timescales.
One prominent slow effect of repetitive activity in many axons is slow afterhyperpolarization (sAHP), caused by either cumulative effects of slow potassium currents (Miller et al., 1995; Burke et al., 2001) or the activation of the sodium/potassium ATPase (Na+/K+ pump) (Van Essen, 1973; Barrett and Barrett, 1982; Gordon et al., 1990; Robert and Jirounek, 1998; Baker, 2000). The sAHP is often balanced by a hyperpolarization-activated inward current (Ih) (Grafe et al., 1997; Robert and Jirounek, 1998; Soleng et al., 2003; Baginskas et al., 2009). The relative contribution of these currents determines the degree to which an axon hyperpolarizes during repetitive activity (Kiernan et al., 2004). The sAHP is often implicated in a general slowing of conduction (Bostock and Grafe, 1985; Grafe et al., 1997; Moalem-Taylor et al., 2007). However, changes in membrane potential have ambiguous effects, because they alter the activation and inactivation states of fast currents. For example, a hyperpolarized membrane potential is farther away from the activation threshold of sodium channels and should therefore slow spike propagation. Conversely, it accelerates recovery from inactivation and limits spike slowing during high-frequency activity. Therefore, depending on the history of activity, the temporal structure of spike patterns can be affected in complex ways during propagation (Weidner et al., 2002; Bucher and Goaillard, 2011).
We recently described the properties and membrane dynamics of a crustacean motor axon. During rhythmic activity, this axon exhibits prominent changes in spike shape and substantial variability of conduction delay over the course of a burst (Ballo and Bucher, 2009). Both a prominent sAHP and inward rectification through Ih are present (Ballo and Bucher, 2009; Ballo et al., 2010). Low concentrations of dopamine (DA) depolarize the axon through a cAMP-mediated increase in Ih (Bucher et al., 2003; Ballo et al., 2010). We now show that Ih is a critical determinant of temporal fidelity in this axon. In control saline, conduction delay increased slowly with activity, was highly variable, and was not well correlated with instantaneous spike frequency or spike shape parameters. These effects were accentuated with blockers of Ih. In contrast, DA dramatically reduced variability in conduction delay and therefore increased temporal fidelity.
Materials and Methods
Experimental preparation.
Experiments were conducted on the stomatogastric nervous system (STNS) of adult lobsters (∼500 g), Homarus americanus, of either sex. Animals were purchased from Yankee Lobster and kept in flow-through filtered sea water tanks at 10–13°C. Before dissection, animals were anesthetized in ice for at least 15 min. The STNS was then dissected from the stomach and transferred into a transparent Sylgard-lined (Dow Corning) dish in physiological saline. The saline composition was as follows (in mm): 479.12 NaCl, 12.74 KCl, 13.67 CaCl2, 10 MgSO4, 3.91 Na2SO4, and 10 HEPES, pH 7.4–7.5.
All experiments were performed on the peripheral motor axons of the pyloric dilator (PD) neurons. The stomatogastric ganglion (STG) contains two PD neurons, and their axons project bilaterally toward two sets of dilator muscles in the intact stomach, a ventral and a dorsal one. Figure 1 shows schematics of the isolated STNS, depicting one of the two PD neurons. As described previously (Ballo and Bucher, 2009), for our experiments, the anterior commissural ganglia, the unpaired esophageal ganglion, and the STG, and the nerves connecting them, were kept intact along with some of the peripheral motor nerves. The PD axons project through the single dorsal ventricular nerve (dvn) that leaves the STG, then branch into the two bilaterally symmetric lateral ventricular nerves (lvn), and branch again into dorsal and ventral lateral ventricular nerves (dlvn and vlvn). The dlvn projects toward the dorsal dilator muscles in the intact animal and was not used for recordings in most of our experiments. Instead, we concentrated on the ventral branch that runs without additional branching through the vlvn into the pyloric dilator nerve (pdn). In animals of the size used in this study, the path length of the PD axons from the STG to the proximal pdn is ∼5 cm. However, in the intact animal, the pdn continues to run along the length of the several centimeters long ventral dilator muscles (Maynard and Dando, 1974). The conduction delay values reported here for the distance between the dvn and pdn (4–5 cm) therefore are likely similar to the total delay between STG and proximal neuromuscular synapses but significantly smaller than delay to distal synapses.
Figure 1.

Schematic of recording arrangements. A, The STNS during normal ongoing pyloric activity. Intracellular axon recordings were obtained from the dvn, 0.5–2 cm distal to the STG. PD axons were identified by their characteristic waveform and correspondence of spike patterns with a distal extracellular recording from the pdn. Only one of the two bilaterally projecting PD neurons is shown. CoG, Commissural ganglion; OG, esophageal ganglion. B, Antidromic stimulation and quantification of spike waveform parameters. For patterned stimulation and quantification of delay and waveform parameters, centrally generated rhythmic activity was blocked by applying 1 μm TTX to a petroleum jelly well built around the STG. Spikes were then elicited by electrically stimulating the pdn through the extracellular electrodes. The example trace indicates the measurements taken. Peaks were detected as voltage maxima in the intracellular recording, and the delay from stimulation to peak was measured. Troughs were detected as voltage minima between spikes or immediately before a spike. Voltage values of both peaks and troughs, as well as the spike duration (at of the amplitude) were measured.
Electrophysiological recording and stimulation.
During recordings, preparations were continuously superfused with cooled saline (12°C). Extracellular recordings of PD axon activity were obtained by building petroleum jelly wells (diameter of ∼1 mm) around motor nerves and placing one lead of a pair of stainless steel wire electrodes into a well and the other lead into the bath. Signals were differentially amplified and filtered using an A-M Systems alternating current amplifier (model 1700).
Intracellular recordings from the PD axon were obtained from the dvn, ∼0.5–2 cm distal to the STG. At this distance, the PD axons are electrotonically separated from the STG by several length constants, so the recorded voltage trajectories do not reflect centrally generated subthreshold events (Ballo and Bucher, 2009). To facilitate access to the axons, the dvn was mechanically desheathed using pins cut from small-diameter tungsten wire (California Fine Wire). Sharp glass microelectrodes were filled with 3 m KCl and had resistances between 20 and 30 MΩ. Penetration of the axon membrane was achieved by tapping the micromanipulator (Leica) lightly with the back end of dissection forceps. Recordings showing initial resting membrane potentials more depolarized than −55 mV were discarded. The PD axons were identified by their characteristic waveform during bursts and the correspondence of their spike patterns with the extracellular pdn recording. Identification was done during ongoing pyloric activity generated in the STG (Fig. 1A). After identification, centrally generated activity was blocked by applying 1 μm tetrodotoxin (TTX; Sigma) in saline to a petroleum jelly well built around the STG (Fig. 1B). PD axon activity was then evoked by antidromic stimulation from the pdn. Nerve stimulation was performed using the same stainless steel wire electrodes as for recording, connected to an isolated pulse stimulator (model 2100; A-M Systems). Pulse durations were usually ∼200 μs but sometimes had to be longer to achieve successful repeated stimulation. However, care was taken that they never exceeded 500 μs, to ensure submillisecond accuracy in measuring conduction delay.
Data were acquired using a micro 1401 digitizing board and Spike2 versions 6 and 7 software (Cambridge Electronic Design). Stimulations with different temporal patterns were achieved using either the time settings of the stimulator or the sequencer interface of the digital-to-analog converter of the micro 1401 board.
Data analysis.
Primary data analysis to extract spike timing and voltage trajectory parameters was performed using custom programs written in the Spike2 script language. Figure 1B shows an example stimulation and recording trace indicating which parameters were measured. Spike 2 analysis scripts extracted the delay between the pdn stimulation and the peak of the spike response in the dvn. In addition, three spike shape parameters were automatically measured for each spike in the intracellular dvn recording. These included the voltage at the peak of the spike (peak in millivolts), the voltage minimum between two spikes or right before the onset of the spike (trough in millivolts), and the duration at one-sixth of the difference between peak and trough (duration in milliseconds). Secondary analyses and statistical tests, as well as all graphs, were generated using SigmaPlot (version 11; Systat Software), StatView (version 5; SAS Institute), and Grapher (version 4; Golden Software). Final figure layout and labeling was done in Canvas (version 11; ACD Systems). Statistical tests used were regression analysis, paired t tests, and ANOVA for repeated measurements, with subsequent Fisher's PLSD post hoc tests when appropriate. Significance was assumed at p < 0.05.
Drug applications.
To manipulate the contribution of Ih to axonal excitability, CsCl (Acros Organics) in saline and DA (3-hydroxytyramine hydrochloride; Sigma) in saline were bath applied to the entirety of peripheral motor nerves. Unless explicitly stated otherwise, the sequence of applications was control saline, 5 mm CsCl, 1 nm DA, 1 μm DA, and saline wash. CsCl at 5 mm effectively blocks Ih in the PD axons (Ballo et al., 2010) and washes rapidly, which is why we preferred it over more specific blockers. However, to confirm the specificity of observed effects on temporal fidelity, in some experiments, we also used 100 μm ZD7288 (4-ethylphenylamino-1,2-dimethyl-6-methylaminopyrimidinium chloride) (Tocris Bioscience), which also blocks Ih in the PD axons (Ballo et al., 2010). Each drug was washed in for ≥10 min before we started nerve stimulations. CsCl was washed out for 30 min before application of DA. According to our previous experience, washout of DA effects can take several hours. We were not able to maintain stable intracellular recordings over such long periods of time in many experiments. Therefore, we only obtained data from 30 min to 1 h partial saline wash after DA in a subset of experiments.
Axon staining and microscopy.
To reveal the morphology of PD axon branch points, we used iontophoretic dye injection through the intracellular glass microelectrode. Electrode tips were backfilled with Alexa Fluor 568 hydrazide, sodium salt (10 mm in 200 mm KCl; Invitrogen). Dye was passed by applying −10 to −20 nA direct current. Axons were filled for 10–30 min, until they appeared dark red under normal illumination. The electrode was then removed, and the dye was allowed to diffuse for 15–30 h. The nerves were fixed in 4% paraformaldehyde (Electron Microscopy Sciences) for 20–30 min, rinsed several times in 0.1 m phosphate buffer (pH 7.3–7.4), and mounted in 60% glycerol in buffer. Specimens were imaged using a Leica confocal microscope (Leica TCS SP5 II), equipped with a 40× oil-immersion objective (numerical aperture, 1.25). Projection views were generated and measurements taken in Amira (ResolveRT version 4; Mercury Computer Systems).
Results
During ongoing bursting activity in normal saline, the PD axons display a large variability of conduction delay over the course of a single burst (Ballo and Bucher, 2009). Repetitive activity also leads to several changes in voltage trajectory (Ballo and Bucher, 2009). Spike peak voltage decreases with increasing spike frequency, presumably because of inactivation of fast voltage-gated sodium channels. Spike duration increases over repetitive activation, presumably because of inactivation of voltage-gated (A-type) potassium channels. Because of the relatively slow spike repolarization, repetitive activity at higher frequencies also leads to summation, i.e., the membrane potential from which each spike is fired changes over the course of a burst. The reduction in spike amplitude and the summation can be seen in the example trace shown in Figure 1B. At a slower timescale, repetitive activation leads to a hyperpolarization of the “resting” membrane potential. The ionic basis of this sAHP is not known, but it is likely to be balanced by inward rectification through Ih (Ballo and Bucher, 2009). The contribution of Ih may play an important role for the control of conduction delay for two reasons. First, the magnitude of hyperpolarization does not just determine overall conduction velocity but should affect the activation state of other voltage-gated channels, as well as the inactivation state of transient currents, such as fast sodium and A-type potassium. Therefore, the dynamics of spike shape and conduction velocity during repetitive activity and bursting should be affected. Second, Ih is the target of DA modulation. Around the resting membrane potential, DA increases Ih (Ballo et al., 2010), i.e., the balance between sAHP and inward rectification should also depend on modulatory state. To investigate the contribution of Ih to the temporal fidelity of axonal spike conduction, we used several stimulation protocols in control saline, Ih blockers, and DA.
Recovery cycle measurements
First, we tested the contribution of Ih with standard measurements of the “recovery cycle.” In three experiments, we stimulated the pdn with either pairs of pulses, a conditioning pulse and a subsequent test pulse at varying intervals, or a 10 s/10 Hz train of conditioning pulses and a subsequent test pulse at varying intervals. Such measurements have historically been used to describe activity-dependent changes in axon excitability and conduction delay (Adrian, 1921; Bullock, 1951; Raymond, 1979) and are still widely used as a diagnostic tool for peripheral neuropathies (Bostock et al., 1998; Krishnan et al., 2009). Because DA even at 1 nm concentration reliably elicits peripheral spike initiation at ∼5 Hz in the PD axon (Bucher et al., 2003), quiescent test intervals of up to several seconds could not be achieved in DA. We therefore performed these experiments only in control saline and CsCl. Figure 2A shows an overlay of PD axon recordings from paired-pulse stimulations, aligned at the spike elicited by the conditioning pulse (gray). Only intervals up to 250 ms are shown. Figure 2B shows the corresponding traces from a train conditioning. Only the last three spikes elicited by conditioning pulses are shown. In both cases, note that, at small intervals, spike amplitude was reduced and spikes were fired before repolarization of the last conditioning spike was complete. Figure 2C shows the mean change in delay (Davg) across experiments (n = 3) between the spike responses to the conditioning pulses and the response to the test pulses as a function of interval. We report these values as percentage of the delay of the conditioning spike because absolute values were fairly different across experiments. The delay of the conditioning spike was obtained from either the sole one in the paired-pulse protocol or the first one in the train-pulse protocol. The oscillatory changes in delay are collectively termed “the recovery cycle,” and the proposed underlying ionic mechanisms referred to in the following have been reviewed in detail by Krishnan et al. (2009) and Bucher and Goaillard (2011). Responses to paired-pulse stimulations were very similar in control saline and CsCl. At intervals smaller than 10 ms, Davg was increased for the response to the test pulse. This is usually referred to as the relative refractory period and most likely attributable to incomplete recovery from sodium channel inactivation and incomplete deactivation of potassium channels. The relative refractory period is followed by a period of decreased Davg, usually referred to as the supernormal period, between intervals of 10 and 200 ms. In other systems, this effect has been attributed to afterdepolarization caused by extracellular potassium accumulation, passive capacitive charging, or persistent sodium currents. At intervals >200 ms, Davg was not changed compared with conditioning pulses. When axons are stimulated with a conditioning train, they often show a subnormal period of increased delay (decreased excitability) after the supernormal period, usually attributed to sAHP attributable to slow potassium currents and/or the Na+/K+ pump. In the case of the PD axons, Davg was increased at all intervals, but the oscillatory nature of Davg changes was maintained, i.e., there was a minimum at the same intervals as the supernormal period during paired-pulse stimulations. Surprisingly, this overall shift to larger Davg values was more pronounced in control saline than in CsCl. We tested whether the changes in Davg during the recovery cycle were well correlated with changes in voltage parameters. Figure 2D–F shows the changes in trough voltage, peak voltage, and duration as a function of stimulation interval. The relative refractory period, i.e., the small interval range at which Davg was larger than in conditioning pulses, coincided with increased troughs (spikes that are fired before the repolarization of the preceding spike is complete) and with diminished peak voltages. In both cases, there were no substantial differences between paired-pulse and train stimulation protocols. Spike duration was maximally increased during the supernormal period, and this increase was much larger during train stimulations. Overall, there was no obvious relationship between voltage parameters and changes in Davg over all phases of the recovery cycle. In addition, these results demonstrate that recovery cycle measurements are not sufficient to capture slower dynamics of excitability changes. Delay clearly depended on more than just the last preceding interval, but conditioning trains and test pulses do not allow inferences about how whole patterns of spikes may be altered during propagation.
Figure 2.

Recovery cycle measurements. A, Overlaid traces from paired-pulse stimulation with different intervals in control saline. Conditioning pulses are shown in gray. B, Overlaid traces from conditioning trains and test pulses at different intervals in control saline. Only the last three conditioning pulses from a 10 s/10 Hz stimulation are shown in gray. C, Percentage change in delay (Δ Davg) as a function of interval for paired pulses and conditioning trains in control saline and 5 mm CsCl (n = 3). 100% is the delay value for the conditioning pulse in the paired-pulse protocol and the first pulse in the train protocol. D–F, Difference in voltage spike shape parameters as a function of stimulus interval.
Tonic stimulation
Because of the limitations of recovery cycle measurements, we probed the history dependence of conduction delay in the PD axons with different stimulation modes. We did so under different pharmacological conditions that manipulated the amount of Ih to test the contribution of that current to temporal fidelity. First, we stimulated tonically with different frequencies. We used 10 s stimulus trains at 10, 20, and 40 Hz, frequencies that are sufficient to overcome peripheral spike initiation in DA and can be maintained by the axon for tens of seconds (Ballo and Bucher, 2009). We repeated these protocols in control saline, 5 mm CsCl, 1 nm DA, and 1 μm DA. DA at 1 nm is at the low end of concentrations that reliably elicit axonal responses (Bucher et al., 2003; Ballo and Bucher, 2009). DA at 1 μm reliably elicits very strong responses (Bucher et al., 2003; Ballo and Bucher, 2009; Ballo et al., 2010) but is still one or two orders of magnitude lower than the concentrations used to characterize DA effects in the STG (Harris-Warrick et al., 1998). Figure 3A shows an example of PD axon responses to 10 s of tonic stimulation with 40 Hz in control saline and 1 μm DA. In both conditions, there was a clear hyperpolarization of the resting membrane potential and a marked reduction in spike peak voltage over the course of the stimulation. Note that, in DA, the resting membrane potential was depolarized and the axon was spiking tonically at a low frequency before the stimulation. However, higher-frequency propagating spikes inhibit peripheral spike initiation (Bucher et al., 2003), and antidromic stimulation at the frequencies used here in all cases was sufficient to eliminate peripheral spikes. Figure 3B shows the change in Davg over the course of the stimulations with three different frequencies in control saline, CsCl, 1 nm DA, and 1 μm DA (n = 5). We report these values as percentage of the first spike delay because absolute values were fairly different across experiments as a result of anatomical variability and the locations of the recording electrodes. At all frequencies in control saline and CsCl, Davg initially was decreased for the first 5–20 spikes before increasing steadily over the course of the rest of the stimulation. The initial decrease in delay was very brief in 1 nm DA and absent in 1 μm DA. Differences in initial Davg between different treatments were on the order of maximally 2 ms and not statistically significant (ANOVA, p = 0.13). Within each treatment, Davg increased more with higher stimulation frequencies. Across treatments, the change in Davg appeared largest in 1 μm DA. Two-way ANOVA revealed that there was a significant effect of stimulation frequency (p < 0.0001). However, there was no significant effect of pharmacological treatment (p = 0.1830).
Figure 3.

Conduction delay changes during tonic stimulation. A, Example traces from 10 s/40 Hz stimulations in control saline and 1 μm DA. B, Plots of mean change in delay (Δ Davg) over the 10 s stimulation for three different tonic stimulation frequencies (10, 20, 40 Hz) in control, CsCl, and the two DA concentrations (n = 5). For legibility, only one in eight error bars are shown. C, Delay as a function of spike shape (example plots from 1 experiment in control saline). Gray shading indicates time bins from 1–10 s. Values from the first stimulus are plotted as larger dots and labeled “1st.” Lines represent linear fits from regression analysis, and R2 and p values are given in the figure. For the correlation between peak voltage and delay, and spike duration and delay, only data from the 2nd to 10th second were used (dashed box).
Figure 3C shows plots of delay as a function of spike shape parameters for an example experiment (stimulation at 40 Hz in control saline). Except for the first spike (larger dot), there was a linear relationship between delay and the membrane potential from which each spike was fired (line, R2 and p values in the left panel). Delay increased with hyperpolarization. Delay did not change monotonically with peak voltage, because peak voltage initially increased before decreasing concomitantly with increasing delay. Delay increased monotonically but not linearly with spike duration. However, the nonlinearity of the relationship between peak voltage and delay, and spike duration and delay, was attributable entirely to the first second of stimulation. For seconds 2–10, both relationships were very linear (Fig. 3C, hatched boxes, regression lines, and values). Even without excluding data from the beginning of the stimulation, delay was relatively well correlated with spike shape parameters across all five experiments. We used linear regression analysis for all stimulations at 40 Hz. Each trial in each experiment showed significant slope values (p < 0.0001 in all cases) and R2 values between 0.60 and 0.99. Mean slope and R2 values were not dependent on pharmacological treatment (repeated-measures ANOVA, p > 0.05 in all cases). We therefore report slope and R2 values as means across treatments. Delay was well correlated with trough potential (mean ± SEM, slope, −5.04 ± 0.82; R2 = 0.84 ± 0.04), peak voltage (mean ± SEM, slope, −1.48 ± 0.08; R2 = 0.91 ± 0.02), and spike duration (mean ± SEM, slope, 7.32 ± 0.50; R2 = 0.83 ± 0.02).
Overall, the data obtained from tonic stimulations show that propagation delay changes depended on stimulation frequency. However, manipulating Ih did not lead to dramatic effects over the time range of 10 s. In addition, changes in spike shape parameters correlated relatively well with changes in propagation delay. Figure 3B clearly shows that 10 s stimulations are not sufficient to capture the slow dynamics of changes, because Davg was still rapidly changing at the end of stimulation. Furthermore, tonic stimulations do not allow gauging the effect of varying instantaneous frequencies. We therefore conducted experiments with much longer stimulations and varying instantaneous frequencies.
Stimulation with realistic burst patterns
To stimulate the axon with a pattern as realistic as possible, we designed a protocol that mimicked ongoing pyloric activity. Both the burst timing and the spike interval structure of PD have been described in detail in H. americanus (Bucher et al., 2005, 2006; Ballo and Bucher, 2009). The 5 min protocol consisted of 300 trains at 1 Hz train frequency. Each train was 360 ms long and consisted of 19 pulses (indexed 1–19). The trains were designed to mimic the parabolic frequency structure of PD bursts (Szucs et al., 2003; Ballo and Bucher, 2009), with instantaneous frequencies increasing from 32 Hz at the beginning to 63 Hz at the middle of the train and then decreasing to 32 Hz again toward the end. Figure 4 shows data from a representative experiment. The left panel in Figure 4A shows intracellular PD axon recordings of responses to the first and last stimulus train under all pharmacological conditions. Dashed lines, indicating the resting membrane potential in control saline before stimulation, show a hyperpolarization of the resting potential attributable to the axonal stimulation. Hyperpolarization from first to last burst was increased in CsCl and decreased in DA compared with control saline. At this timescale, changes in the spike patterns within the burst are not obvious, with the exception of the substantial decrease of the first spike interval in the last burst in CsCl (asterisk). The middle panel of Figure 4A shows the same data as stacked multiple sweeps triggered from the pdn stimulation. In these plots, the variability of conduction delays becomes apparent. At the 300th burst, this variability was primarily increased in control saline and CsCl. Particularly apparent was the much larger delay of the first spike in the burst, which took >10% longer to reach the intracellular recording site in control saline and ∼40% longer in CsCl (asterisk). This increased delay of the first spike was absent in both DA concentrations. The right panel of Figure 4A shows the delays as a function of time over the burst for all 300 bursts in each treatment. The variability in delays built up gradually from the first to the 300th burst, as mean delay was increasing. In DA, both the total increase in delay and the variability of delays within each burst were substantially reduced.
Figure 4.
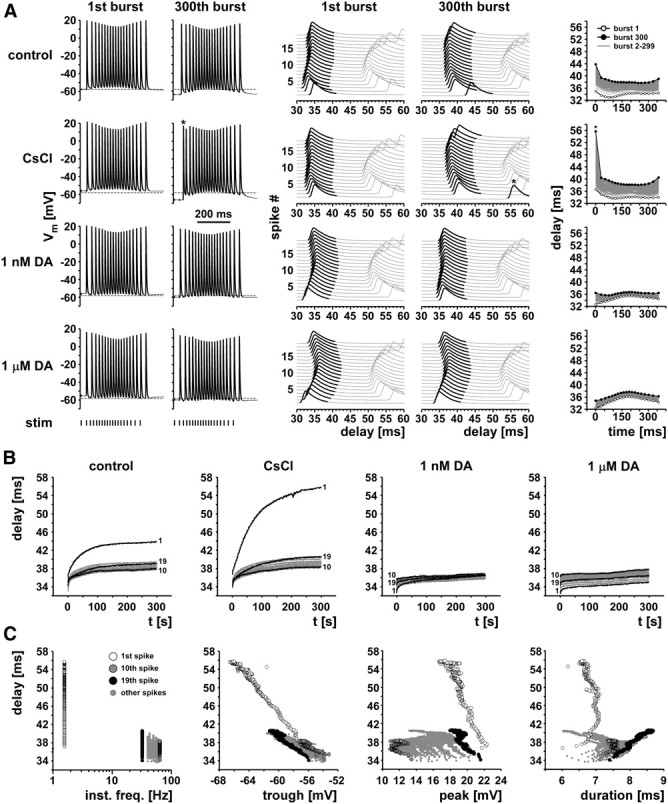
Delay changes during realistic burst stimulations. A, Example traces from one experiment. The left panel shows the first and 300th burst of 5 min stimulations with a realistic burst pattern (19 pulses, parabolic instantaneous frequency structure). Note the differences in baseline hyperpolarization from the 1st to 300th burst across control, CsCl, and the two DA concentrations. The middle panel shows the same data as staggered multiple sweeps, triggered at the stimulus time. Note the substantial change in delay over the course of the 300th burst in control and CsCl, particularly for the first spike (asterisk in the CsCl traces). The right panel shows plots of delay over burst time for all 300 bursts in each treatment. B, Delay over time of the entire 5 min stimulation for the same experiment shown in A. The 1st, 10th, and 19th spike are shown in black, and all others are in gray. C, Delay as a function of instantaneous frequency and spike shape parameters in CsCl. Different symbols indicate different spike indices.
Figure 4B shows the delays over the entire 300 s of stimulation, sorted by spike index (1–19). In control saline and CsCl, the gradual increase in delay was maximal for the first spikes in the bursts and minimal for the spikes at the highest instantaneous frequency in the middle of the burst. In both DA concentrations, the increase in delay was substantially reduced, and absolute delay was maximal for the middle spikes and minimal for the first spikes.
Figure 4C shows the relationships between delay and instantaneous spike frequency, as well as between delay and voltage trajectories, for the stimulation in CsCl. Delay and variability of delay were maximal at lowest instantaneous frequencies, which represent the interval between the first spike and the last spike of the preceding burst. Delay was a fairly linear function of both trough potential and peak voltage for the first spikes, but this relationship was not consistent between different spike indices. Spike duration, however, was not well correlated with delay.
Figure 5 shows the mean values for burst stimulation results (n = 9). Values were calculated as means for each burst and means for each burst index (1–300) across experiments. Maintaining stable recordings during a long wash after DA application was only possible in five experiments. Data from stimulations after wash are shown in Figure 5 to indicate that, in all cases, values were restored to similar ranges compared with control but were excluded from statistical analysis.
Figure 5.

Mean values for burst stimulation results (n = 9, n = 5 for wash). For legibility, only one in five error bars are shown in all plots. A, Change of trough voltage over the 5 min stimulation. B, Change of Davg over the 5 min stimulation. C, Change of CV-D over the 5 min stimulation. CV-D was calculated for each burst separately, including the delays of all spikes. D, The change of the temporal pattern of the 300th burst in each treatment. The original pulse structure at stimulation is shown in gray. For each spike index, the mean latency to the intracellular recording site is shown. Note the substantial increase in spike frequency at the beginning of the burst in control and CsCl.
Consistent with previous findings (Ballo and Bucher, 2009; Ballo et al., 2010), the different pharmacological treatments had a significant effect on the resting membrane potential before stimulation (ANOVA, p < 0.0001). Initial resting membrane potential was not significantly different between control and CsCl (Fisher's PLSD, p = 0.086) but depolarized by an average ± SEM of 4.0 ± 1.4 mV in 1 nm DA compared with control (Fisher's PLSD, p = 0.0033) and by 6.5 ± 1.6 mV in 1 μm DA (Fisher's PLSD, p < 0.0001). Figure 5A shows the mean hyperpolarization (Δ trough) during the 5 min stimulation. The degree to which the membrane hyperpolarized was significantly different between treatments (ANOVA, p < 0.0001). In control, the PD axon was hyperpolarized by 5.5 ± 1.0 mV (mean ± SEM) at the end of the stimulation. In CsCl, hyperpolarization was significantly larger by 2.5 mV (Fisher's PLSD, p = 0.0312), smaller by 1.5 mV in 1 nm DA (Fisher's PLSD, p = 0.047), and smaller by 3.5 mV in 1 μm DA (Fisher's PLSD, p = 0.0037). After wash, hyperpolarization returned to a value similar to control (5.9 mV). The initial mean delay (Davg) was significantly dependent on pharmacological treatment (ANOVA, p = 0.049). It was not different between control and CsCl (Fisher's PLSD, p = 0.3295) but significantly reduced by 1.9 ms (5.5%) in 1 nm DA compared with control (Fisher's PLSD, p = 0.0238) and by 2.0 ms (5.9%) in 1 μm DA compared with control (Fisher's PLSD, p = 0.0160). Figure 5B shows the increase in Davg over the course of the stimulation under all pharmacological conditions. The degree to which Davg increased from the first to the last burst was significantly dependent on pharmacological treatment (ANOVA, p < 0.0001). In control, Davg increased by 4.2 ± 0.2 ms (mean ± SEM). In CsCl, Davg increased by 5.5 ± 0.3 ms (mean ± SEM), which was significantly more than in control (Fisher's PLSD, p = 0.0033). In 1 nm DA, Davg increased by 2.9 ± 0.4 ms (mean ± SEM), which was significantly less than in control (Fisher's PLSD, p = 0.0026). In 1 μm DA, Davg increased by only 1.8 ± 0.3 ms (mean ± SEM), which was significantly less than in control (Fisher's PLSD, p < 0.0001) and also significantly less than in 1 nm DA (Fisher's PLSD, p = 0.0177). After wash, the increase in Davg was larger again (3.1 ± 0.5 ms, mean ± SEM) but not quite at the level of control.
In addition to Davg, we also analyzed the variability of delays within bursts. To provide an ostensive measure of how large this variability was, we first calculated the percentage difference in delay between the slowest and fastest spike in the first and last bursts. This difference was modest in the first burst under all pharmacological conditions (mean ± SEM, 6.4 ± 0.4% in control, 7.4 ± 1.0% in CsCl, 7.5 ± 0.6% in 1 nm DA, and 13.0 ± 1.1% in 1 μm DA). However, by the 300th burst, the difference was substantially larger in control (19.1 ± 1.0%, mean ± SEM) and more than fivefold larger in CsCl (41.6 ± 3.0%) as a result of the pronounced slowing of the first spike in the burst shown in Figure 4. In contrast, the difference remained small in the 300th burst in 1 nm DA (10.0 ± 2.2%, mean ± SEM) and 1 μm DA (8.6 ± 1.3%). For statistical comparison, we measured the actual variance in delay among all spikes in a burst by calculating the coefficient of variation of delay (CV-D) for each burst. Figure 5C shows the mean values of CV-D for all treatments over the 300 bursts. The CV-D of the first burst was dependent on pharmacological treatment (ANOVA, p < 0.0001) but only significantly different from control in 1 μm DA (Fisher's PLSD, p < 0.0001). For all treatments but 1 μm DA, there was an initial drop in CV-D during the first two to three bursts, followed by a steady increase. By the 300th burst, CV-D was increased in control and CsCl but decreased in 1 nm DA and 1 μm DA. CV-D was significantly dependent on pharmacological treatment (ANOVA, p < 0.0001). It was larger in CsCl compared with control (Fisher's PLSD, p < 0.0001) and smaller in both 1 nm DA (Fisher's PLSD, p = 0.0010) and 1 μm DA (Fisher's PLSD, p = 0.0186). Therefore, the temporal fidelity of axonal spike propagation was decreased in the absence of Ih and increased in the presence of DA. Figure 5D illustrates the transformation of the interval structure of a realistic PD burst during propagation for all pharmacological treatments. The mean spike times in the pdn (error bars not shown) are plotted for the 300th burst. Because of the slower propagation after the interval between two bursts, spike intervals were shortened at the beginning of the burst in control saline and CsCl. This effect essentially disappeared in both concentrations of DA.
Because of potential lack of selectivity of CsCl, we stimulated the pdn in three additional experiments with the same pattern in the presence of the Ih blocker ZD7288. We observed similar changes as in CsCl, including the large increase in the delay of the first spikes (data not shown). The membrane potential hyperpolarized by 13.9 ± 1.3 mV (mean ± SEM) in ZD7288 compared with only 5.2 ± 1.2 mV in control saline. The mean ± SEM increase in delay in ZD7288 was 8.5 ± 1.4 ms compared with only 4.7 ± 1.0 ms in control saline. CV-D increased from 0.0223 ± 0.0035 to 0.0940 ± 0.0086 (mean ± SEM) in ZD7288 and from 0.0212 ± 0.0008 to only 0.0318 ± 0.0035 in control saline. Because of the similarity of these effects to our data obtained in CsCl, we conclude that the effects of CsCl are attributable to a relative specific block of Ih.
Orthodromic stimulation and axon branch points
One possible concern about the data presented so far is that we used antidromic stimulation. Morphological inhomogeneities, i.e., changes in axon diameter, can affect spike conduction, particularly at branch points (Rall, 1959; Goldstein and Rall, 1974; Manor et al., 1991; Bucher and Goaillard, 2011). In conjunction with activity-dependent excitability changes, morphological inhomogeneities can significantly alter conduction reliability and delay and render them dependent on spike history (Debanne et al., 1997, 2011; Debanne, 2004). Because the sequence of geometric changes encountered by a propagating spike usually is different between orthodromic and antidromic propagation, conduction delay may be affected differentially. However, single electrotonically isolated branch points produce only minor changes in conduction, unless the geometric ratio (GR) between parent and daughter branches is very large (Manor et al., 1991). The “3/2 power rule” (Rall, 1959) describes the GR in the following way: GR = (d13/2 + d23/2)/dp3/2, where d1 and d2 are the diameters of the daughter branches, and dp is the diameter of the parent branch. If GR = 1 (for example, if the diameter of both daughter branches is 63% of that of the parent branch), then propagation is unaffected. If GR > 1 or GR < 1, then propagation speed is decreased or increased, respectively. The PD axons have two electrotonically isolated branch points, one from the dvn to both lvn branches, and one from the lvn to the dlvn and vlvn. We stained the PD axon in three preparations from the dvn into both lvn branches (Fig. 6A). The diameter of the PD axon in the dvn usually is ∼10 μm (Bucher et al., 2007). In all three preparations, the diameters of the axons in the lvn branches were 70–80% of the diameter in the dvn. Therefore, the GR is ∼1.1–1.4 for orthodromic propagation and ∼2.4–2.7 for antidromic propagation. Such changes should only have very minor effects on conduction velocity. However, because gradual changes in diameter as well as inhomogeneous excitability could also affect orthodromic and antidromic conduction differentially, we wanted to test whether the activity-dependent changes in delay are similar between both modes of propagation and whether they occur gradually over the length of the axon or at distinct locations. To this end, we performed two sets of experiments. In four preparations, we injected 1 Hz sinusoidal current into a PD soma and recorded spikes extracellularly from several sites along the peripheral motor nerves. We did not manage to achieve consistent spiking activity at similar rates and patterns as used for antidromic stimulation with this stimulation regimen. However, activity-dependent changes in conduction delay over the course of bursts at “steady state” were similar to those seen during antidromic stimulation and developed gradually over the propagation distance (data not shown). In a second set of experiments (n = 5), we directly drove the axon in the dvn with brief depolarizing current pulses through the intracellular electrode in the same pattern as during antidromic burst stimulation. Reliable spike initiation required longer stimulation pulses (2–5 ms) than during extracellular pdn stimulation. Figure 6B shows the stimulation and recording arrangement with extracellular recording wells placed behind dvn–lvn and lvn–vlvn branch points (asterisks) and at the pdn. Figure 6C shows intracellular (PDdvn) and extracellular (lvn, vlvn, pdn) recording traces of the 300th burst in control saline from a representative experiment. Note that the intracellular recording is not balanced for current injection but clearly shows spike peaks in the PDdvn trace. Figure 6D shows plots of the delay from the PDdvn recording for each spike in the same burst at the different recording sites. Data are from the same experiment as Figure 6C. The pattern was very similar to the one shown for antidromic stimulations (Fig. 4A). Furthermore, the differential increase in delay for different spikes in the burst accumulated over the distance, including the region between vlvn and pdn recording sites, which does not include a branch point. All five experiments showed similar results. We therefore conclude that all results from antidromic stimulations are a good approximation of the activity-dependent dynamics of orthodromic conduction delay.
Figure 6.

Changes in delay during orthodromic propagation. A, Confocal image of the dvn/lvn branch point of the PD axon. The axon was stained with Alexa Fluor 568 hydrazide several millimeters proximal to the branch point. B, Schematic of the recording arrangement for intracellular stimulation from the dvn and extracellular recordings along the motor nerves. Axon branch points are indicated by asterisks. C, The 300th burst of a 5 min stimulation protocol identical to those shown in Figures 4 and 5, evoked by brief depolarizing pulses through the intracellular electrode. The intracellular recording was not balanced for current injection but clearly shows the peaks of evoked spikes. The delays to the spikes in the extracellular recordings show the propagation direction from dvn to pdn. D, Propagation delay between dvn and the three extracellular recording sites for all spikes in the 300th burst. Measurements were taken from the recording traces shown in C. Note that there is a branch point between dvn and lvn and another branch point between lvn and vlvn but none between vlvn and pdn.
Poisson-like stimulation
Finally, we wanted to test whether the slow dynamics of changes in conduction delay observed during burst stimulation was specific for that pattern. To this end, we used “unpatterned” Poisson-like stimulation trains with different mean frequencies: 5, 10, and 19 Hz. Trains lasted 5 min, and instantaneous stimulation frequencies did not exceed 80 Hz. Nineteen hertz was selected as the highest mean frequency to match the mean frequency used in the burst stimulation experiments.
Overall, activity- and treatment-dependent changes in delay were very similar compared with stimulations with burst patterns. Figure 7 shows that hyperpolarization, delay, and variance of delay increased over the 5 min stimulation. These increases were larger at higher mean stimulation frequencies, most pronounced when Ih was blocked, and minimal in the presence of DA. Figure 7A shows a short section of an intracellular recording during stimulation with a mean frequency of 19 Hz. Note the slow repolarization time and the differences in trough and peak potentials. Figure 7B shows a plot of trough potentials over the 5 min stimulation time in CsCl, from the same example shown in Figure 7A. The axon showed an initial rapid hyperpolarization (black arrow) and then additional hyperpolarization with a time constant of several minutes (white arrow). Variability increased substantially with hyperpolarization. Figure 7C shows the changes in delay from the same data. Again, there was an initial rapid change (black arrow) and then a slow increase in delay accompanied by a substantial increase in variability (white arrow).
Figure 7.
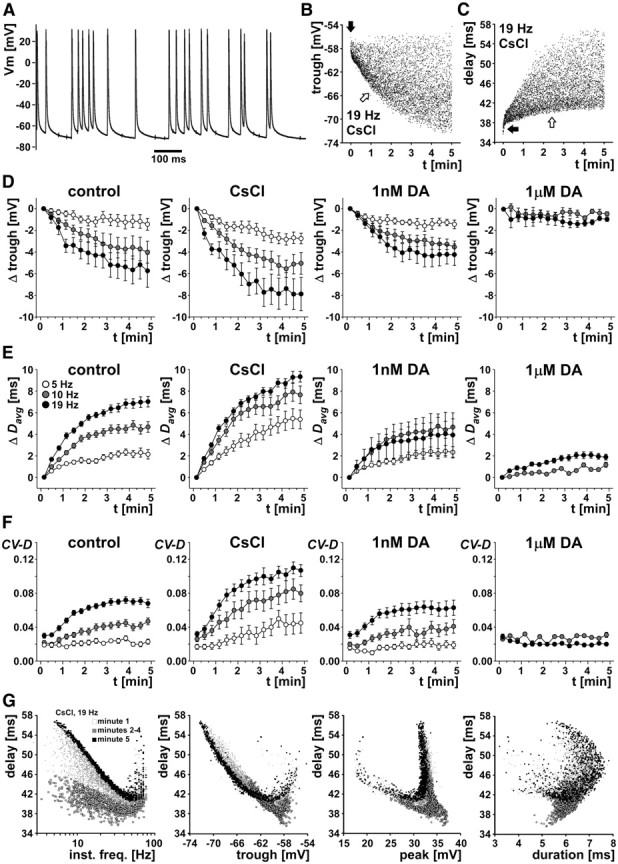
Randomized (Poisson-like) stimulations. A, Section of an intracellular recording of a PD axon in the dvn, stimulated with a Poisson-like pattern for 5 min. B, Trough voltage values for an example experiment for 5 min stimulation time with a mean frequency of 19 Hz in CsCl. Trough voltage showed an initial rapid hyperpolarization (black arrow), followed by slower hyperpolarization (white arrow). C, Delay values over stimulation time for the same experiment. Delay showed an initial rapid increase (black arrow), followed by a slower increase (white arrow). D, E, Change in mean trough voltage and Davg for three mean stimulation frequencies (5, 10, and 19 Hz). Data are from five experiments, and points from each experiment were obtained by calculating mean values from 20 s bins. Because of substantial spontaneous peripheral spike initiation in 1 μm DA, no data were obtained for 5 Hz mean stimulation frequency. F, CV-D over time. G, Delay as a function of instantaneous stimulation frequency and spike shape parameters. Data shown are from the same experiment and treatment as in B and C. Different symbols indicate different times during the stimulation protocol. Note the absence of any linear or monotonic relationships.
Figure 7D–F shows mean data from all experiments (n = 5). Data points from each experiment were obtained by calculating mean values from 20 s bins. In 1 μm DA, 5 Hz stimulation was not sufficient to overcome the substantial peripheral spike initiation (Bucher et al., 2003). We therefore could not obtain these data. We tested the effects of stimulation frequency and pharmacological treatment first by omitting all data from treatment with 1 μm DA and then by omitting all data from 5 Hz stimulations. Figure 7D shows the change in trough voltages for all treatments and mean stimulation frequencies. When all data from treatment with 1 μm DA were excluded, the magnitude of hyperpolarization at the end of the stimulation was both dependent on stimulation frequency (p = 0.0453) and treatment (p = 0.0170). The magnitude of hyperpolarization was significantly larger at 19 Hz than at 5 Hz (Fisher's PLSD, p = 0.0150) but not different between 5 and 10 Hz (Fisher's PLSD, p = 0.1320) and 10 and 19 Hz (Fisher's PLSD, p = 0.2460). It was also larger in CsCl compared with control (Fisher's PLSD, p = 0.0056) but not different between control and 1 nm DA (Fisher's PLSD, p = 0.3562). When all data from stimulation at 5 Hz were excluded, the magnitude of hyperpolarization was only dependent on pharmacological treatment (p < 0.0001) but not on stimulation frequency (p = 0.3009). The magnitude of hyperpolarization was larger in CsCl compared with control (Fisher's PLSD, p = 0.0198), smaller in 1 μm DA than in control (Fisher's PLSD, p = 0.0047), but not different between control and 1 nm DA (Fisher's PLSD, p = 0.3422).
Figure 7E shows the change in mean delay (Davg) for all treatments and mean stimulation frequencies. When all data from treatment with 1 μm DA were excluded, Davg at the end of the stimulation was dependent on both stimulation frequency (p = 0.0103) and treatment (p < 0.0001). Davg was significantly larger at 10 Hz than at 5 Hz (Fisher's PLSD, p = 0.0289) and significantly larger at 19 Hz than at 5 Hz (Fisher's PLSD, p = 0.0035) but not different between 19 and 10 Hz (Fisher's PLSD, p = 0.2751). Davg was also larger in CsCl compared with control (Fisher's PLSD, p < 0.0001) but not different between control and 1 nm DA (Fisher's PLSD, p = 0.1378). When all data from stimulation at 5 Hz were excluded, Davg was only dependent on pharmacological treatment (p < 0.0001) but not on stimulation frequency (p = 0.2832). Davg was larger in CsCl compared with control (Fisher's PLSD, p = 0.0014), smaller in 1 μm DA than in control (Fisher's PLSD, p < 0.0001), but not different between control and 1 nm DA (Fisher's PLSD, p = 0.0544).
We also analyzed the increase in CV-D over the course of the stimulations. Figure 7F shows the change of CV-D for all treatments and mean stimulation frequencies. When all data from treatment with 1 μm DA were excluded, CV-D at the end of the stimulation was both dependent on stimulation frequency (p = 0.0002) and treatment (p < 0.0001). CV-D was significantly larger at 10 Hz than at 5 Hz (Fisher's PLSD, p = 0.0289) and significantly larger at 19 Hz than at 10 Hz (Fisher's PLSD, p = 0.0211). CV-D was also larger in CsCl compared with control (Fisher's PLSD, p < 0.0001) but not different between control and 1 nm DA (Fisher's PLSD, p = 0.2731). When all data from stimulation at 5 Hz were excluded, CV-D was only dependent on pharmacological treatment (p < 0.0001) but not on stimulation frequency (p = 0.0789). CV-D was larger in CsCl compared with control (Fisher's PLSD, p < 0.0001), smaller in 1 μm DA than in control (Fisher's PLSD, p < 0.0001), but not different between control and 1 nm DA (Fisher's PLSD, p = 0.2874).
Finally, we analyzed the possible dependence of conduction delay of individual spikes on instantaneous stimulation frequency (i.e., the reciprocal of the time between a spike and the one preceding it) and the three spike shape parameters. Figure 7G shows data from a representative experiment, stimulated with 19 Hz mean frequency in CsCl. Data from stimulations in control saline and DA showed similar relationships, albeit with smaller changes in delay. As in the case of burst stimulations (Fig. 4C), delay was maximal at the lowest instantaneous frequencies. However, this relationship was not monotonic, because delay also was increased at highest instantaneous frequencies. The relationships between delay and voltage parameters also appeared to be similar to those during burst stimulations. Neither of the voltage parameters was a good predictor of delay. All the observed relationships were nonlinear and non-monotonic and clearly changed over the course of the 5 min stimulation protocol.
Discussion
We show here that an axon displays slow dynamics affecting the temporal fidelity of spike propagation. Propagation delay changes in an activity-dependent manner. These changes are dependent on the conductance level of hyperpolarization-activated channels, which are targeted by DA modulation. The magnitude and variance of delay changes is substantial in control saline and particularly in the absence of Ih. Mean delay changes by several milliseconds over a distance of a few centimeters, and delays during a short time interval such as a single burst can vary by >40%. In consequence, spike patterns change substantially from the initiation site to distal presynaptic sites. The changes build up slowly over several minutes. Therefore, experimental assays using paired pulses at different intervals, or short repetitive stimulations, cannot possibly capture these dynamics.
Potential ionic mechanisms of propagation dynamics
Activity-dependent changes in axonal excitability and conduction velocity are often probed with measurements of the recovery cycle and explained on the basis of specific ionic mechanisms. These mechanisms are often manifest in specific voltage trajectories, e.g., a reduction in spike amplitude and depolarizing or hyperpolarizing afterpotentials (Krishnan et al., 2009; Bucher and Goaillard, 2011). This approach fails for our measurements, and the failure is attributable not just to the slow time constants involved. The changes in propagation delay were not well correlated with changes in voltage trajectories either. The presence of multiple voltage-gated currents with diverse time constants and voltage dependencies can make it non-intuitive and complex to map specific conductances to membrane behavior (Taylor et al., 2009). In addition, membrane behavior can be very dependent on the history of activity, at timescales exceeding the largest time constant present in the underlying ionic mechanisms (Tal et al., 2001; Gilboa et al., 2005; Drew and Abbott, 2006; Gal et al., 2010). In an axon with constant diameter, capacitance, and cytosolic resistance, conduction velocity primarily depends on the membrane resistance and, accordingly, on its inverse, the total membrane conductance (Matsumoto and Tasaki, 1977). The overlapping activation of opposing inward and outward currents means that membrane potential is a poor predictor of total conductance. In an axon with a complex set of currents with different gating properties, a high degree of nonlinearity in membrane behavior during repetitive activity is therefore to be expected. Pharmacological and biophysical characterization of the PD axon ionic currents has revealed A-type potassium currents and Ih in addition to fast sodium and delayed rectifier potassium currents (Ballo and Bucher, 2009; Ballo et al., 2010). Furthermore, the prominent sAHP of unknown origin plays an important role in slow changes of resting membrane potentials (Ballo and Bucher, 2009). The PD axon displays both fast and slow activity-dependent dynamics. Examples of fast dynamics are changes in spike amplitude (most likely attributable to sodium channel inactivation) and changes in spike duration (most likely attributable to potassium channel inactivation). The slow hyperpolarization of the resting membrane potential during repetitive activity does not just lead to overall slowing of spike propagation but also changes the faster dynamics, most likely because activation and inactivation states of currents such as fast sodium and A-type potassium change even in subthreshold membrane potential ranges. Such interactions would explain why propagation delay is a very nonlinear function of spike history and voltage trajectories. In addition, it would explain why Ih, by counteracting the sAHP, can eliminate most of the variance in delay. However, we have no intuitive explanation for the specific transformations of interval structure in the PD axon, e.g., the substantial slowing at larger intervals. The understanding of these phenomena would require a detailed computational model of the axon that allows monitoring the fluctuations of each individual conductance and total conductance at any point in time and space.
Complex complements of voltage-gated ion channels in axons are the rule and not the exception (Krishnan et al., 2009; Bucher and Goaillard, 2011). Most axons express multiple potassium channels, including those responsible for transient currents (Connor, 1975; Connor et al., 1977; Wang et al., 1993; Trimmer and Rhodes, 2004; Shu et al., 2007; Buniel et al., 2008) and for slow currents (Dubois, 1981; Baker et al., 1987; Eng et al., 1988; Devaux et al., 2004; Schwarz et al., 2006; Vervaeke et al., 2006; Buniel et al., 2008). In addition, persistent sodium currents (French et al., 1990; Stys et al., 1993; McIntyre et al., 2002; Tokuno et al., 2003) and calcium currents (Brown et al., 2001; Jackson et al., 2001; Le et al., 2006; Zhang et al., 2006) are also found in axons. Of particular relevance here, Ih is common in the axon trunk and has been proposed to function in balancing afterhyperpolarization (Grafe et al., 1997; Robert and Jirounek, 1998; Soleng et al., 2003; Baginskas et al., 2009). It is therefore to be expected that, in many axons, Ih plays a prominent role in controlling temporal fidelity.
The potential contribution of propagation dynamics to neural coding
Changes in propagation delay dependent on spike history potentially affect neural coding. Temporal codes are dependent on spike latencies, interval patterns, or firing phase (Theunissen and Miller, 1995; Lestienne, 2001; Cessac et al., 2010; Panzeri et al., 2010), all of which can be altered by changes in axonal propagation. During repetitive activation, even the temporal relationship of converging inputs onto neurons could change and significantly affect coding strategies depending on coincidence of presynaptic firing (Carr and Konishi, 1988; Izhikevich, 2006). It is easy to imagine that the interval structure of presynaptic spiking affects postsynaptic integration. In the muscles postsynaptic to the PD axons, the increase in instantaneous frequencies at the beginning of the burst should result in an increase in summation. These muscles show graded slow contraction responses, and, in some cases, their activation predominantly depends on spike numbers, whereas in others it depends on spike frequencies (Morris and Hooper, 1997).
Ultimately, how big a role the dynamics of interval structures can play for coding in any system depends on how much it relies on temporal versus rate coding schemes. In some systems, activity-dependent changes in propagation delay may just reflect the absence of a need for temporal precision, whereas in others dynamics may be used for coding. Although the functional role of the slow changes in spike propagation in the PD axons is not clear, similar history dependence in other systems may represent a form of intrinsic short-term plasticity. Particularly interesting in this respect is that slow hyperpolarization by the Na+/K+ pump has been suggested to serve as a cellular short-term memory, particularly during rhythmic activity (Pulver and Griffith, 2010). Although in many systems slow integrative mechanisms are considered only in the context of synaptic integration and spike generation, there are some examples of slow axon dynamics. In hippocampal pyramidal cells, changes in baseline membrane potential affect the inactivation state of axonal A-currents and subsequently conduction velocity and the probability of spike failures (Debanne et al., 1997). In some hippocampal interneurons, repeated activation leads to long-lasting ectopic axonal spike initiation, which effectively uncouples output activity from somatodendritic signal integration (Sheffield et al., 2011). In human C-fibers, Weidner et al. (2002) showed that, over a propagation distance of tens of centimeters, bursts of identical interval structure at the stimulation site can be differentially transformed dependent on burst repeat rates. The cellular mechanisms underlying this phenomenon are not known, but this type of slow dynamics is very reminiscent of the one we describe here.
Neuromodulation of axonal propagation
One argument for the potential role of axons in shaping the neural code is that, in many systems, axonal excitability can be changed by transmitters or neuromodulators. Both ionotropic and metabotropic receptors are found in nonsynaptic axonal membrane, including GABAA, GABAB, AMPA, nicotinic acetylcholine, and amine receptors (Kocsis and Sakatani, 1995; Bucher and Goaillard, 2011). In many cases, only extreme effects, such as ectopic spike initiation or spike failures, are described. For example, shunting or ectopic spike initiation by activation of GABAA receptors is a common phenomenon in mammalian central and peripheral axons (Pinault, 1995; Avoli et al., 1998; Keros and Hablitz, 2005). In hippocampal pyramidal cells, GABA-mediated ectopic axonal spike initiation has been suggested to play a role in network oscillations and memory formation (Papatheodoropoulos, 2008; Bähner et al., 2011). Amine-mediated ectopic axonal spike initiation has been found in several neurons in the STNS (Meyrand et al., 1992; Goaillard et al., 2004; Daur et al., 2009). In the PD axons, DA elicits peripheral ectopic spikes, but only in the absence of centrally generated bursting activity (Bucher et al., 2003). However, because the pyloric rhythm is continuously active (Marder and Bucher, 2007), DA modulation more likely controls temporal fidelity. In general, the presence of axonal modulation means that the degree to which spike patterns are changed depends on the presence of signaling molecules that are either systemic or released by other neurons. This represents a novel way by which the neural code can be changed conditional on axonal excitability. To our knowledge, the work presented here shows for the first time in detail that, even in the absence of spike failures or ectopic spike initiation, temporal fidelity of axonal spike propagation can be subject to neuromodulation.
Footnotes
This work was supported by National Institute of Neurological Disorders and Stroke Grant NS058825 (D.B.) and National Institute of Mental Health Grant MH060605 (F.N.).
References
- Adrian ED. The recovery process of excitable tissues. Part II. J Physiol. 1921;55:193–225. doi: 10.1113/jphysiol.1921.sp001963. [DOI] [PMC free article] [PubMed] [Google Scholar]
- Avoli M, Methot M, Kawasaki H. GABA-dependent generation of ectopic action potentials in the rat hippocampus. Eur J Neurosci. 1998;10:2714–2722. doi: 10.1046/j.1460-9568.1998.00275.x. [DOI] [PubMed] [Google Scholar]
- Baginskas A, Palani D, Chiu K, Raastad M. The H-current secures action potential transmission at high frequencies in rat cerebellar parallel fibers. Eur J Neurosci. 2009;29:87–96. doi: 10.1111/j.1460-9568.2008.06566.x. [DOI] [PubMed] [Google Scholar]
- Bähner F, Weiss EK, Birke G, Maier N, Schmitz D, Rudolph U, Frotscher M, Traub RD, Both M, Draguhn A. Cellular correlate of assembly formation in oscillating hippocampal networks in vitro. Proc Natl Acad Sci U S A. 2011;108:E607–E616. doi: 10.1073/pnas.1103546108. [DOI] [PMC free article] [PubMed] [Google Scholar]
- Baker MD. Axonal flip-flops and oscillators. Trends Neurosci. 2000;23:514–519. doi: 10.1016/s0166-2236(00)01645-3. [DOI] [PubMed] [Google Scholar]
- Baker M, Bostock H, Grafe P, Martius P. Function and distribution of three types of rectifying channel in rat spinal root myelinated axons. J Physiol. 1987;383:45–67. doi: 10.1113/jphysiol.1987.sp016395. [DOI] [PMC free article] [PubMed] [Google Scholar]
- Ballo AW, Bucher D. Complex intrinsic membrane properties and dopamine shape spiking activity in a motor axon. J Neurosci. 2009;29:5062–5074. doi: 10.1523/JNEUROSCI.0716-09.2009. [DOI] [PMC free article] [PubMed] [Google Scholar]
- Ballo AW, Keene JC, Troy PJ, Goeritz ML, Nadim F, Bucher D. Dopamine modulates Ih in a motor axon. J Neurosci. 2010;30:8425–8434. doi: 10.1523/JNEUROSCI.0405-10.2010. [DOI] [PMC free article] [PubMed] [Google Scholar]
- Barrett EF, Barrett JN. Intracellular recording from vertebrate myelinated axons: mechanism of the depolarizing afterpotential. J Physiol. 1982;323:117–144. doi: 10.1113/jphysiol.1982.sp014064. [DOI] [PMC free article] [PubMed] [Google Scholar]
- Bostock H, Grafe P. Activity-dependent excitability changes in normal and demyelinated rat spinal root axons. J Physiol. 1985;365:239–257. doi: 10.1113/jphysiol.1985.sp015769. [DOI] [PMC free article] [PubMed] [Google Scholar]
- Bostock H, Cikurel K, Burke D. Threshold tracking techniques in the study of human peripheral nerve. Muscle Nerve. 1998;21:137–158. doi: 10.1002/(sici)1097-4598(199802)21:2<137::aid-mus1>3.0.co;2-c. [DOI] [PubMed] [Google Scholar]
- Brown AM, Westenbroek RE, Catterall WA, Ransom BR. Axonal L-type Ca2+ channels and anoxic injury in rat CNS white matter. J Neurophysiol. 2001;85:900–911. doi: 10.1152/jn.2001.85.2.900. [DOI] [PubMed] [Google Scholar]
- Bucher D, Goaillard JM. Beyond faithful conduction: short-term dynamics, neuromodulation, and long-term regulation of spike propagation in the axon. Prog Neurobiol. 2011;94:307–346. doi: 10.1016/j.pneurobio.2011.06.001. [DOI] [PMC free article] [PubMed] [Google Scholar]
- Bucher D, Thirumalai V, Marder E. Axonal dopamine receptors activate peripheral spike initiation in a stomatogastric motor neuron. J Neurosci. 2003;23:6866–6875. doi: 10.1523/JNEUROSCI.23-17-06866.2003. [DOI] [PMC free article] [PubMed] [Google Scholar]
- Bucher D, Prinz AA, Marder E. Animal-to-animal variability in motor pattern production in adults and during growth. J Neurosci. 2005;25:1611–1619. doi: 10.1523/JNEUROSCI.3679-04.2005. [DOI] [PMC free article] [PubMed] [Google Scholar]
- Bucher D, Taylor AL, Marder E. Central pattern generating neurons simultaneously express fast and slow rhythmic activities in the stomatogastric ganglion. J Neurophysiol. 2006;95:3617–3632. doi: 10.1152/jn.00004.2006. [DOI] [PubMed] [Google Scholar]
- Bucher D, Johnson CD, Marder E. Neuronal morphology and neuropil structure in the stomatogastric ganglion of the lobster, Homarus americanus. J Comp Neurol. 2007;501:185–205. doi: 10.1002/cne.21169. [DOI] [PubMed] [Google Scholar]
- Bullock TH. Facilitation of conduction rate in nerve fibers. J Physiol. 1951;114:89–97. doi: 10.1113/jphysiol.1951.sp004605. [DOI] [PMC free article] [PubMed] [Google Scholar]
- Buniel M, Glazebrook PA, Ramirez-Navarro A, Kunze DL. Distribution of voltage-gated potassium and hyperpolarization-activated channels in sensory afferent fibers in the rat carotid body. J Comp Neurol. 2008;510:367–377. doi: 10.1002/cne.21796. [DOI] [PMC free article] [PubMed] [Google Scholar]
- Burke D, Kiernan MC, Bostock H. Excitability of human axons. Clin Neurophysiol. 2001;112:1575–1585. doi: 10.1016/s1388-2457(01)00595-8. [DOI] [PubMed] [Google Scholar]
- Carr CE, Konishi M. Axonal delay lines for time measurement in the owl's brainstem. Proc Natl Acad Sci U S A. 1988;85:8311–8315. doi: 10.1073/pnas.85.21.8311. [DOI] [PMC free article] [PubMed] [Google Scholar]
- Cessac B, Paugam-Moisy H, Viéville T. Overview of facts and issues about neural coding by spikes. J Physiol Paris. 2010;104:5–18. doi: 10.1016/j.jphysparis.2009.11.002. [DOI] [PubMed] [Google Scholar]
- Connor JA. Neural repetitive firing: a comparative study of membrane properties of crustacean walking leg axons. J Neurophysiol. 1975;38:922–932. doi: 10.1152/jn.1975.38.4.922. [DOI] [PubMed] [Google Scholar]
- Connor JA, Walter D, McKown R. Neural repetitive firing: modifications of the Hodgkin-Huxley axon suggested by experimental results from crustacean axons. Biophys J. 1977;18:81–102. doi: 10.1016/S0006-3495(77)85598-7. [DOI] [PMC free article] [PubMed] [Google Scholar]
- Daur N, Nadim F, Stein W. Regulation of motor patterns by the central spike-initiation zone of a sensory neuron. Eur J Neurosci. 2009;30:808–822. doi: 10.1111/j.1460-9568.2009.06866.x. [DOI] [PMC free article] [PubMed] [Google Scholar]
- Debanne D. Information processing in the axon. Nat Rev Neurosci. 2004;5:304–316. doi: 10.1038/nrn1397. [DOI] [PubMed] [Google Scholar]
- Debanne D, Guérineau NC, Gähwiler BH, Thompson SM. Action-potential propagation gated by an axonal I(A)-like K+ conductance in hippocampus. Nature. 1997;389:286–289. doi: 10.1038/38502. [DOI] [PubMed] [Google Scholar]
- Debanne D, Campanac E, Bialowas A, Carlier E, Alcaraz G. Axon physiology. Physiol Rev. 2011;91:555–602. doi: 10.1152/physrev.00048.2009. [DOI] [PubMed] [Google Scholar]
- Devaux JJ, Kleopa KA, Cooper EC, Scherer SS. KCNQ2 is a nodal K+ channel. J Neurosci. 2004;24:1236–1244. doi: 10.1523/JNEUROSCI.4512-03.2004. [DOI] [PMC free article] [PubMed] [Google Scholar]
- Drew PJ, Abbott LF. Models and properties of power-law adaptation in neural systems. J Neurophysiol. 2006;96:826–833. doi: 10.1152/jn.00134.2006. [DOI] [PubMed] [Google Scholar]
- Dubois JM. Evidence for the existence of three types of potassium channels in the frog Ranvier node membrane. J Physiol. 1981;318:297–316. doi: 10.1113/jphysiol.1981.sp013865. [DOI] [PMC free article] [PubMed] [Google Scholar]
- Eng DL, Gordon TR, Kocsis JD, Waxman SG. Development of 4-AP and TEA sensitivities in mammalian myelinated nerve fibers. J Neurophysiol. 1988;60:2168–2179. doi: 10.1152/jn.1988.60.6.2168. [DOI] [PubMed] [Google Scholar]
- French CR, Sah P, Buckett KJ, Gage PW. A voltage-dependent persistent sodium current in mammalian hippocampal neurons. J Gen Physiol. 1990;95:1139–1157. doi: 10.1085/jgp.95.6.1139. [DOI] [PMC free article] [PubMed] [Google Scholar]
- Gal A, Eytan D, Wallach A, Sandler M, Schiller J, Marom S. Dynamics of excitability over extended timescales in cultured cortical neurons. J Neurosci. 2010;30:16332–16342. doi: 10.1523/JNEUROSCI.4859-10.2010. [DOI] [PMC free article] [PubMed] [Google Scholar]
- Gilboa G, Chen R, Brenner N. History-dependent multiple-time-scale dynamics in a single-neuron model. J Neurosci. 2005;25:6479–6489. doi: 10.1523/JNEUROSCI.0763-05.2005. [DOI] [PMC free article] [PubMed] [Google Scholar]
- Goaillard JM, Schulz DJ, Kilman VL, Marder E. Octopamine modulates the axons of modulatory projection neurons. J Neurosci. 2004;24:7063–7073. doi: 10.1523/JNEUROSCI.2078-04.2004. [DOI] [PMC free article] [PubMed] [Google Scholar]
- Goldstein SS, Rall W. Changes of action potential shape and velocity for changing core conductor geometry. Biophys J. 1974;14:731–757. doi: 10.1016/S0006-3495(74)85947-3. [DOI] [PMC free article] [PubMed] [Google Scholar]
- Gordon TR, Kocsis JD, Waxman SG. Electrogenic pump (Na+/K+-ATPase) activity in rat optic nerve. Neuroscience. 1990;37:829–837. doi: 10.1016/0306-4522(90)90112-h. [DOI] [PubMed] [Google Scholar]
- Grafe P, Quasthoff S, Grosskreutz J, Alzheimer C. Function of the hyperpolarization-activated inward rectification in nonmyelinated peripheral rat and human axons. J Neurophysiol. 1997;77:421–426. doi: 10.1152/jn.1997.77.1.421. [DOI] [PubMed] [Google Scholar]
- Harris-Warrick RM, Johnson BR, Peck JH, Kloppenburg P, Ayali A, Skarbinski J. Distributed effects of dopamine modulation in the crustacean pyloric network. Ann N Y Acad Sci. 1998;860:155–167. doi: 10.1111/j.1749-6632.1998.tb09046.x. [DOI] [PubMed] [Google Scholar]
- Hodgkin AL, Huxley AF. A quantitative description of membrane current and its application to conduction and excitation in nerve. J Physiol. 1952;117:500–544. doi: 10.1113/jphysiol.1952.sp004764. [DOI] [PMC free article] [PubMed] [Google Scholar]
- Izhikevich EM. Polychronization: computation with spikes. Neural Comput. 2006;18:245–282. doi: 10.1162/089976606775093882. [DOI] [PubMed] [Google Scholar]
- Jackson VM, Trout SJ, Brain KL, Cunnane TC. Characterization of action potential-evoked calcium transients in mouse postganglionic sympathetic axon bundles. J Physiol. 2001;537:3–16. doi: 10.1111/j.1469-7793.2001.0003k.x. [DOI] [PMC free article] [PubMed] [Google Scholar]
- Keros S, Hablitz JJ. Ectopic action potential generation in cortical interneurons during synchronized GABA responses. Neuroscience. 2005;131:833–842. doi: 10.1016/j.neuroscience.2004.12.010. [DOI] [PubMed] [Google Scholar]
- Kiernan MC, Lin CS, Burke D. Differences in activity-dependent hyperpolarization in human sensory and motor axons. J Physiol. 2004;558:341–349. doi: 10.1113/jphysiol.2004.063966. [DOI] [PMC free article] [PubMed] [Google Scholar]
- Kocsis JD, Sakatani K. Modulation of axonal excitability by neurotransmitter receptors. In: Waxman SG, Kocsis JD, Stys PK, editors. The axon. Structure, function and pathophysiology. New York: Oxford UP; 1995. [Google Scholar]
- Krishnan AV, Lin CS, Park SB, Kiernan MC. Axonal ion channels from bench to bedside: a translational neuroscience perspective. Prog Neurobiol. 2009;89:288–313. doi: 10.1016/j.pneurobio.2009.08.002. [DOI] [PubMed] [Google Scholar]
- Le T, Verley DR, Goaillard JM, Messinger DI, Christie AE, Birmingham JT. Bistable behavior originating in the axon of a crustacean motor neuron. J Neurophysiol. 2006;95:1356–1368. doi: 10.1152/jn.00893.2005. [DOI] [PubMed] [Google Scholar]
- Lestienne R. Spike timing, synchronization and information processing on the sensory side of the central nervous system. Prog Neurobiol. 2001;65:545–591. doi: 10.1016/s0301-0082(01)00019-3. [DOI] [PubMed] [Google Scholar]
- Manor Y, Koch C, Segev I. Effect of geometrical irregularities on propagation delay in axonal trees. Biophys J. 1991;60:1424–1437. doi: 10.1016/S0006-3495(91)82179-8. [DOI] [PMC free article] [PubMed] [Google Scholar]
- Marder E, Bucher D. Understanding circuit dynamics using the stomatogastric nervous system of lobsters and crabs. Annu Rev Physiol. 2007;69:291–316. doi: 10.1146/annurev.physiol.69.031905.161516. [DOI] [PubMed] [Google Scholar]
- Matsumoto G, Tasaki I. A study of conduction velocity in nonmyelinated nerve fibers. Biophys J. 1977;20:1–13. doi: 10.1016/S0006-3495(77)85532-X. [DOI] [PMC free article] [PubMed] [Google Scholar]
- Maynard DM, Dando MR. The structure of the stomatogastric neuromuscular system in Callinectes sapidus, Homarus americanus and Panulirus argus (Decapoda Crustacea) Philos Trans R Soc Lond B Biol Sci. 1974;268:161–220. doi: 10.1098/rstb.1974.0024. [DOI] [PubMed] [Google Scholar]
- McIntyre CC, Richardson AG, Grill WM. Modeling the excitability of mammalian nerve fibers: influence of afterpotentials on the recovery cycle. J Neurophysiol. 2002;87:995–1006. doi: 10.1152/jn.00353.2001. [DOI] [PubMed] [Google Scholar]
- Meyrand P, Weimann JM, Marder E. Multiple axonal spike initiation zones in a motor neuron: serotonin activation. J Neurosci. 1992;12:2803–2812. doi: 10.1523/JNEUROSCI.12-07-02803.1992. [DOI] [PMC free article] [PubMed] [Google Scholar]
- Miller TA, Kiernan MC, Mogyoros I, Burke D. Activity-dependent changes in impulse conduction in normal human cutaneous axons. Brain. 1995;118:1217–1224. doi: 10.1093/brain/118.5.1217. [DOI] [PubMed] [Google Scholar]
- Moalem-Taylor G, Lang PM, Tracey DJ, Grafe P. Post-spike excitability indicates changes in membrane potential of isolated C-fibers. Muscle Nerve. 2007;36:172–182. doi: 10.1002/mus.20793. [DOI] [PubMed] [Google Scholar]
- Morris LG, Hooper SL. Muscle response to changing neuronal input in the lobster (Panulirus interruptus) stomatogastric system: spike number- versus spike frequency-dependent domains. J Neurosci. 1997;17:5956–5971. doi: 10.1523/JNEUROSCI.17-15-05956.1997. [DOI] [PMC free article] [PubMed] [Google Scholar]
- Panzeri S, Brunel N, Logothetis NK, Kayser C. Sensory neural codes using multiplexed temporal scales. Trends Neurosci. 2010;33:111–120. doi: 10.1016/j.tins.2009.12.001. [DOI] [PubMed] [Google Scholar]
- Papatheodoropoulos C. A possible role of ectopic action potentials in the in vitro hippocampal sharp wave-ripple complexes. Neuroscience. 2008;157:495–501. doi: 10.1016/j.neuroscience.2008.09.040. [DOI] [PubMed] [Google Scholar]
- Pinault D. Backpropagation of action potentials generated at ectopic axonal loci: hypothesis that axon terminals integrate local environmental signals. Brain Res Brain Res Rev. 1995;21:42–92. doi: 10.1016/0165-0173(95)00004-m. [DOI] [PubMed] [Google Scholar]
- Pulver SR, Griffith LC. Spike integration and cellular memory in a rhythmic network from Na+/K+ pump current dynamics. Nat Neurosci. 2010;13:53–59. doi: 10.1038/nn.2444. [DOI] [PMC free article] [PubMed] [Google Scholar]
- Rall W. Branching dendritic trees and motoneuron membrane resistivity. Exp Neurol. 1959;1:491–527. doi: 10.1016/0014-4886(59)90046-9. [DOI] [PubMed] [Google Scholar]
- Raymond SA. Effects of nerve impulses on threshold of frog sciatic nerve fibres. J Physiol. 1979;290:273–303. doi: 10.1113/jphysiol.1979.sp012771. [DOI] [PMC free article] [PubMed] [Google Scholar]
- Robert A, Jirounek P. Axonal and glial currents activated during the post-tetanic hyperpolarization in non-myelinated nerve. Pflugers Arch. 1998;436:529–537. doi: 10.1007/s004240050668. [DOI] [PubMed] [Google Scholar]
- Schwarz JR, Glassmeier G, Cooper EC, Kao TC, Nodera H, Tabuena D, Kaji R, Bostock H. KCNQ channels mediate IKs, a slow K+ current regulating excitability in the rat node of Ranvier. J Physiol. 2006;573:17–34. doi: 10.1113/jphysiol.2006.106815. [DOI] [PMC free article] [PubMed] [Google Scholar]
- Sheffield ME, Best TK, Mensh BD, Kath WL, Spruston N. Slow integration leads to persistent action potential firing in distal axons of coupled interneurons. Nat Neurosci. 2011;14:200–207. doi: 10.1038/nn.2728. [DOI] [PMC free article] [PubMed] [Google Scholar]
- Shu Y, Yu Y, Yang J, McCormick DA. Selective control of cortical axonal spikes by a slowly inactivating K+ current. Proc Natl Acad Sci U S A. 2007;104:11453–11458. doi: 10.1073/pnas.0702041104. [DOI] [PMC free article] [PubMed] [Google Scholar]
- Soleng AF, Chiu K, Raastad M. Unmyelinated axons in the rat hippocampus hyperpolarize and activate an H current when spike frequency exceeds 1 Hz. J Physiol. 2003;552:459–470. doi: 10.1113/jphysiol.2003.048058. [DOI] [PMC free article] [PubMed] [Google Scholar]
- Stys PK, Sontheimer H, Ransom BR, Waxman SG. Noninactivating, tetrodotoxin-sensitive Na+ conductance in rat optic nerve axons. Proc Natl Acad Sci U S A. 1993;90:6976–6980. doi: 10.1073/pnas.90.15.6976. [DOI] [PMC free article] [PubMed] [Google Scholar]
- Szucs A, Pinto RD, Rabinovich MI, Abarbanel HD, Selverston AI. Synaptic modulation of the interspike interval signatures of bursting pyloric neurons. J Neurophysiol. 2003;89:1363–1377. doi: 10.1152/jn.00732.2002. [DOI] [PubMed] [Google Scholar]
- Tal D, Jacobson E, Lyakhov V, Marom S. Frequency tuning of input-output relation in a rat cortical neuron in-vitro. Neurosci Lett. 2001;300:21–24. doi: 10.1016/s0304-3940(01)01534-8. [DOI] [PubMed] [Google Scholar]
- Taylor AL, Goaillard JM, Marder E. How multiple conductances determine electrophysiological properties in a multicompartment model. J Neurosci. 2009;29:5573–5586. doi: 10.1523/JNEUROSCI.4438-08.2009. [DOI] [PMC free article] [PubMed] [Google Scholar]
- Theunissen F, Miller JP. Temporal encoding in nervous systems: a rigorous definition. J Comput Neurosci. 1995;2:149–162. doi: 10.1007/BF00961885. [DOI] [PubMed] [Google Scholar]
- Tokuno HA, Kocsis JD, Waxman SG. Noninactivating, tetrodotoxin-sensitive Na+ conductance in peripheral axons. Muscle Nerve. 2003;28:212–217. doi: 10.1002/mus.10421. [DOI] [PubMed] [Google Scholar]
- Trimmer JS, Rhodes KJ. Localization of voltage-gated ion channels in mammalian brain. Annu Rev Physiol. 2004;66:477–519. doi: 10.1146/annurev.physiol.66.032102.113328. [DOI] [PubMed] [Google Scholar]
- Van Essen DC. The contribution of membrane hyperpolarization to adaptation and conduction block in sensory neurones of the leech. J Physiol. 1973;230:509–534. doi: 10.1113/jphysiol.1973.sp010201. [DOI] [PMC free article] [PubMed] [Google Scholar]
- Vervaeke K, Gu N, Agdestein C, Hu H, Storm JF. Kv7/KCNQ/M-channels in rat glutamatergic hippocampal axons and their role in regulation of excitability and transmitter release. J Physiol. 2006;576:235–256. doi: 10.1113/jphysiol.2006.111336. [DOI] [PMC free article] [PubMed] [Google Scholar]
- Wang H, Kunkel DD, Martin TM, Schwartzkroin PA, Tempel BL. Heteromultimeric K+ channels in terminal and juxtaparanodal regions of neurons. Nature. 1993;365:75–79. doi: 10.1038/365075a0. [DOI] [PubMed] [Google Scholar]
- Weidner C, Schmelz M, Schmidt R, Hammarberg B, Orstavik K, Hilliges M, Torebjörk HE, Handwerker HO. Neural signal processing: the underestimated contribution of peripheral human C-fibers. J Neurosci. 2002;22:6704–6712. doi: 10.1523/JNEUROSCI.22-15-06704.2002. [DOI] [PMC free article] [PubMed] [Google Scholar]
- Zhang CL, Wilson JA, Williams J, Chiu SY. Action potentials induce uniform calcium influx in mammalian myelinated optic nerves. J Neurophysiol. 2006;96:695–709. doi: 10.1152/jn.00083.2006. [DOI] [PubMed] [Google Scholar]