

Abstract
Glioblastoma multiforme (GBM) are the most frequent and aggressive primary brain tumors in adults. Uncontrolled proliferation and abnormal cell migration are two prominent spatially and temporally disassociated characteristics of GBMs. In this study, we investigated the role of the receptor tyrosine kinase EphB2 in controlling the proliferation/migration dichotomy of GBM. We studied EphB2 gain-of-function and loss-of function in glioblastoma-derived stem-like neurospheres (GBM-SCs), whose in vivo growth pattern closely replicates human GBM. EphB2 expression stimulated GBM neurosphere cell migration and invasion, and inhibited neurosphere cell proliferation in vitro. In parallel, EphB2 silencing increased tumor cell proliferation and decreased tumor cell migration. EphB2 was found to increase tumor cell invasion in vivo using an internally controlled dual-fluorescent xenograft model. Xenografts derived from EphB2 overexpressing GBM neurospheres also showed decreased cellular proliferation. The non-receptor tyrosine kinase focal adhesion kinase (FAK) was found to be co-associated with and highly activated by EphB2 expression and FAK activation facilitated focal adhesion formation, cytoskeleton structure change and cell migration in EphB2-expression GBM neurosphere cells. Taken together, our findings indicate that EphB2 has pro-invasive and anti-proliferative actions in GBM stem-like neurospheres mediated, in part, by interactions between EphB2 receptors and FAK. These novel findings suggest that tumor cell invasion can be therapeutically targeted by inhibiting EphB2 signaling and that optimal anti-tumor responses to EphB2 targeting may require the concurrent use of anti-proliferative agents.
Keywords: Glioblastoma-derived stem-like neurospheres, Orthotopic xenograft, EphB2, Proliferation/Migration dichotomy, Invasion, Focal adhesion kinase
Introduction
Gliomas are the most common primary tumors of the central nervous system. Glioblastoma multiforme (GBM), the most predominant and most malignant form of glioma, comprises ~10,000 new cases annually in the United States. Despite considerable progress made in modern anti-tumor therapy, the 2-year survival rate for patients diagnosed with GBM is still only ~28% (1). A major challenge when treating GBM is the propensity for tumor cells to invade adjacent brain tissues, which inevitably leads to tumor recurrence. Histopathological analysis of clinical GBMs reveals that uncontrolled proliferation and tumor cell invasion, two characteristics of GBMs, are spatially and temporarily disassociated behaviors with tumor cores, containing highly proliferation population and cells within the more invasive periphery displaying low proliferation rates (2, 3).
Molecular determinants of GBM invasion are only now beginning to be understood, holding promise for the development of new therapeutic approaches. Recent clinical observations in patients and studies in preclinical models suggest that a more invasive tumor phenotype emerges in response to VEGF pathway inhibitors (4). This highlights the increasing need to understand mechanisms of tumor cell invasion and develop effective anti-invasion therapies. The paucity of intracranial human GBM models that recapitulate the extensively invasive features of GBMs has been a major obstacle for studying tumor invasion and developing anti-invasive therapeutics (5). New model systems derived from glioblastoma stem-like cells, established as neurospheres under serum-free conditions, recapitulate the genetic and histopathological features of clinical GBMs and provide excellent models for tumor invasion studies (6). Incorporating these invasive tumor models into drug development regimens should enhance current efforts towards developing effective anti-invasion therapy for glioblastoma.
We recently found that the receptor tyrosine kinase EphB2 is significantly up-regulated during the differentiation of GBM-derived stem-like neurospheres (7). Eph receptors and their transmembrane bound ligand ephrins form the largest subfamily of the receptor tyrosine kinase. There are 9 members of EphA and 5 members of EphB receptors in mammals that specifically bind to their cognate ligands (ephrin-As and ephrin-Bs, respectively) with few exceptions (8, 9). Eph receptors and ephrins lead to bi-directional signaling, from ligand to receptor (forward) and from receptor to ligand (reverse), to transduce signals in a cell-cell contact-dependent fashion, thereby coordinating cell repulsion or attraction (8, 9). Eph and ephrin interactions are implicated in diverse developmental and neurological functions including cell attachment, migration, axon guidance, vasculogenesis, and cell motility (10).
The effects of the Eph/ephrin system in cancer are complex and sometimes controversial due to their diverse nature (9, 11). Accumulating in vitro studies demonstrate that Eph receptors and ephrins can both promote and inhibit tumorigenicity. Little is known about how the Eph/ephrin system balances these contrasting activities. It has been reported that Eph signaling can elicit a tumor-suppressing effect by inhibiting cancer cell-substrate adhesion, migration, invasion, and growth (12-15). Ligand-induced forward Eph signaling is associated with the inhibition of oncogenic signaling pathways, such as HRAS-Erk, PI3K-AKT and Abl-Crk in colon, breast and prostate cancers (15-17). Conversely, Eph receptors have been found to promote migration, invasion, metastasis and angiogenesis in certain tumor models including glioma, breast cancer and hepatocellular carcinomas (18-21). Eph receptor can also crosstalk with other RTKs such as fibroblast growth factor receptor 1 (FGFR1), epidermal growth factor receptor (EGFR), and the hepatocyte growth factor receptor c-Met and thereby increase cancer cell malignancy (22-24). A considerable limitation in our understanding of Eph/ephrin function is that the majority of conclusions are based on in vitro studies, rendering their relevance to in vivo contexts uncertain.
EphB2 is expressed in cells of epithelial origin (21, 25), has strong affinity for ephrin-B1 and ephrin-B2, and weak affinity for ephrin-B3 and ephrin-A5. Like other members in Eph family, EphB2 elicits both tumor-promoting and tumor-suppressing effects. EphB2 mutant or EphB2 silencing has been identified in human prostate and colorectal tumors, suggesting a tumor suppressing function for EphB2 forward signaling in these cancers (26, 27). Yet, in colorectal cancers, EphB2/ephrin signaling is able to inhibit tumor expansion and invasion through repulsive mechanisms (12, 28). These disparate context-dependent EphB2 functions make it of great interest to study its role in GBM-derived stem-like neurospheres, whose orthotopic xenografts recapitulate with high fidelity the histopathological and invasive phenotypes of clinical GBM. Using a comprehensive array of in vitro and in vivo methods including internally controlled dual-fluorescence GBM xenografts, we found that EphB2 promotes cell invasion and inhibits proliferation in GBM, essentially recapitulating the balance between migration/proliferation dichotomy observed in human tumors. We further determined that interactions between EphB2 receptor and the non-receptor tyrosine kinase focal adhesion kinase (FAK) mediate EphB2 function in GBM neurospheres.
Results
EphB2 gain-of-function promotes GBM neurosphere cell migration and invasion
Human GBM stem-like neurosphere cell lines, HSR-GBM1A and HSR-GBM1B, have been extensively characterized by us and others (7, 29-32). Both lines generate infiltrative xenografts that recapitulate the histopathological features of clinical GBM when injected intracranially in mouse cortical regions. We examined the expression of EphB2 in HSR-GBM1A and HSR-GBM1B. Immunoblot analysis reveals that in contrast to non-neoplastic human neural progenitors, EphB2 is upregulated in HSR-GBM1A and HSR-GBM1B lines (Fig. 1A). Reverse-transcriptase PCR shows that EphB2 ligands, ephrin-B1, B2 and B3 but not ephrin-A5, are expressed by HSR-GBM1A and HSR-GBM1B cells (Fig. 1B).
Figure 1. EphB2 overexpression promotes GBM neurosphere cell migration.

(A). Western blot analysis showed that EphB2 expression in GBM neurosphere lines HSR-GBM1A and GBM1B was elevated compared to that in normal neurospheres from fetal brain. (B). Reverse transcripase-PCR detected expression of EphB2 ligands, ephrin-B1, B2, B3, but not ephrin-A5, in HSR-GBM1A and HSR-GBM1B cells. (C). Immunoblot analysis showed that compared to control transfected cells (Ploc), there was a ~2 fold increase in EphB2 expression in GBM-1A cells transfected with EphB2 cDNA (EphB2-OVE). (D). Phase contrast and fluorescent images of GBM neurospheres transfected with control plasmid ploc and labeled with RFP (upper panels) or with EphB2 cDNA and labeled with GFP (lower panels). Bar=100 μm. (E). Ploc and EphB2-OVE cells were treated with EphB2 ligand ephrin-B1/Fc (1μg/ml) or human Fc (1μg/ml). Protein extracts were immunoprecipitated with anti-EphB2 antibody and EphB2 phosphorylation was detected with anti-phosphoylated-tyrosine antibody. In EphB2-OVE cells, there was a strong activation of EphB2 receptor after ligand binding, indicating functional EphB2 receptors in GBM neurospheres.
High EphB2 expressing cells were generated by transfecting HSR-GBM1A neurosphere cells with lentiviral vector pLoc containing human EphB2 cDNA. The cells (designated as EphB2-OVE) were labeled with green fluorescent protein (GFP). Control cells (designated as Ploc) were labeled with Ploc containing red fluorescent protein cDNA (RFP). Western blot analysis established a ~2-fold increase of EphB2 expression in EphB2-OVE cells compared to control Ploc cells (Fig. 1C). Fluorescence microscopy confirmed that EphB2-OVE cells were GFP+ and Ploc cells were RFP+ (Fig. 1D). To determine that EphB2 receptors were functional, Ploc and EphB2-OVE cells were stimulated with ephrin-B1/Fc fusion proteins that serve as forward signaling activating EphB2 ligands (33, 34). EphB2 receptor phosphorylation was detected by immunoprecipitation with an anti-EphB2 antibody and Western blot analysis with an anti-phospho-tyrosine antibody. The ligand ephrin-B1/Fc induced EphB2 receptor activation in EphB2-OVE cells (Fig. 1E). After ligand treatment, the total level of EphB2 in GBM neurospheres decreased (Fig. 1E), consistent with a previously described mechanism of stimulation-induced Eph receptor degradation (33, 35).
We asked if EphB2 up-regulation alters the migratory phenotype of GBM neurosphere cells. Ploc and EphB2-OVE cell migration was analyzed on laminin-coated transwells (36) and quantified by counting DAPI-stained cells per field (Fig. 2A). Overexpression of EphB2 alone, in the absence of exogenous ligand stimulation, promoted a 2-3-fold increase in serum-induced cell migration when measured 4-18 h after plating cells (Fig. 2B, P<0.001). We also tested neurosphere cell migration induced by hepatocyte growth factor (HGF), a potent chemoattractant for neural progenitor cells (37), in serum-free neurosphere culture media. EphB2 similarly promoted GBM neurosphere cell migration in response to this stimulus (Fig. 2C, P<0.001). In addition, we found that EphB2 promoted neurosphere cell invasion through matrigel-coated transwells (Supplementary Fig. 1A, P<0.001). We used EphB2/Fc as a competitive antagonist of EphB2 receptors to determine the role of EphB2 on this migration response (38, 39). EphB2/Fc inhibited cell migration in both Ploc and EphB2-OVE cells by ~50% (Fig. 2D, P<0.001), suggesting that both endogenous and transgenic EphB2 receptor activities are involved in promoting cell migration. When the EphB2 ligand ephrin-B1/Fc was added in combination with serum, cell migration was further increased compared to cells stimulated with serum alone (Fig. 2E, P<0.001). EphB2 overexpression similarly enhanced cell migration in a 2-dimensional scratch assay (Fig. 2F). We measured the width of cell-free clearing produced by the scratch at day 0, 1 and 4, and calculated the distance the cells travelled with width at day 0 minus width at day 1 or 4. Compared to Ploc cells, EphB2-OVE cells traveled ~7.6-fold longer on laminin-coated surfaces 4 days after wound generation (Fig. 2G, P<0.001).
Figure 2. Functional EphB2 receptor promotes neurosphere cell migration and invasion.
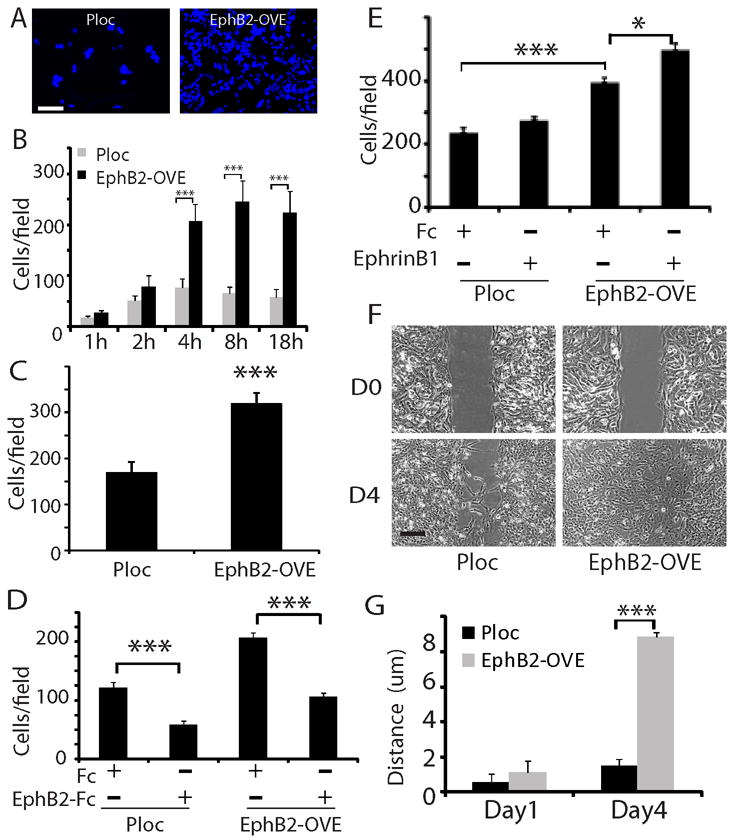
(A, B). EphB2 overexpression promoted GBM neurosphere cell migration on laminin-coated transwells. An equal number of Ploc or EphB2-OVE cells were plated on laminin-coated transwells. Serum were added to the bottom well of transwells. Migrated cells towards serum were stained with DAPI (F, Bar=50 μm) and counted five fields per transwell at different time points and plotted in G. EphB2-OVE cells migrated 2-3 fold faster than control cells after plating for 4-18 hours (***:P<0.001, n=6). (C). EphB2 overexpression promoted GBM neurosphere cell migration in response to hepatocyte growth factor (HGF). HGF (100 ng/ml) was added to the bottom chambers of the transwells in serum-free neurosphere media and migrated cells were counted after 18 hours of incubation (***:P<0.001, n=6). (D). Human EphB2/Fc, as an antagonist, significantly inhibited serum-induced cell migration in Ploc and EphB2-OVE cells (18 hours after plating, ***: P<0.001; n=6). (E). When Ploc and EphB2-OVE cells were treated with the ligand ephrin-B1 (1μg/ml), there was a further increase in cell migration (18 hours) in EphB2-OVE cells (***: P<0.001; *: P<0.05; n=6). (F). Scratch assay indicated that EphB2 overexpression promoted cell motility. Bar = 5 μm. (G). Compared to Ploc cells, EphB2-OVE cells moved 7.6-fold longer after wound for 4 days (***: P<0.001; n=10).
EphB2 gain-of-function inhibits GBM neurosphere cell proliferation
Compared to Ploc cells, EphB2-OVE cell growth was decreased as evidenced by 30% fewer neurosphere cells on culture day 9 (Fig. 3A, P<0.05). EphB2 overexpression also reduced neurosphere forming capacity by 35%, another indicator of decreased GBM neurosphere cell proliferation (Fig. 3B, P<0.05). We observed no evidence of increased cell death in EphB2-OVE cells using trypan blue staining compared to control cells (Supplementary Fig. 1B). Using flow cytometry, cell cycle analysis revealed a 22% decrease in S phase (Fig. 3C, P<0.05) and an increase in the G1/G0 phase in EphB2-OVE cells in comparison to control cells. We further examined the expression of cell cycle regulators, including cyclin A, B, D1, and E by immunoblot analysis. Compared to control, the expression of cyclin B and D1 was decreased by 41% and 52% in EphB2-OVE cells, respectively (Fig. 3D, P<0.05).
Figure 3. EphB2 overexpression inhibits GBM neurosphere cell growth.
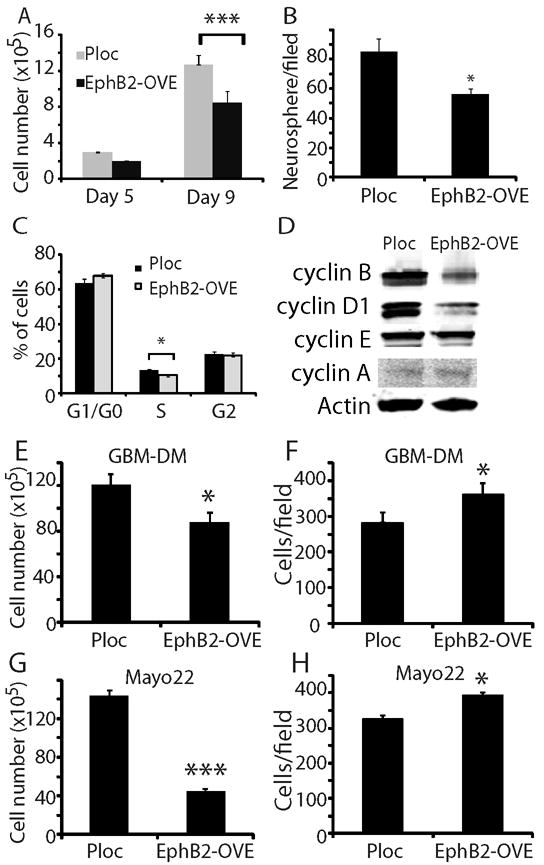
(A). Cell number counting indicated that EphB2-OVE cells grew slower than Ploc cells. After 9 days in culture, EphB2-OVE cells were 30% less than Ploc cells (***: P<0.001; n=8). (B). Neurosphere cells were plated in culture medium in 6 well plates and grown for 7 days. Neurospheres were stained with wright solution (1%) and those larger than 100 μm were counted using MCID program. There were 35% less neurospheres in EphB2-OVE cultures than that in Ploc. (C). Cell cycle analysis with propidium iodide and flow cytometry showed that EphB2 overexpression decreased the number of cells at S-phase by ~22% (*: P<0.05; n=8). (D). Western blot analyses indicated that there were decreases in cyclin B and cyclin D1 expression in EphB2-OVE cells. (E-H). EphB2 overexpression inhibits cell growth and promotes cell migration in other GBM neurosphere cultures. E. When GBM-DM cells were transfected with EphB2 cDNA, there was a decrease in cell number after 5 days in culture (*: P<0.05; n=4). F. EphB2 overexpression in GBM-DM140207 cells promoted cell migration towards serum in transwells (18 hours, *: P<0.05; n=6). G. EphB2 cDNA was transfected into neurosphere cultures from primary xenografts Mayo 22. There was a decrease in cell number after 5 days (***: P<0.001; n=4). H. EphB2 overexpression in Mayo 22 neurosphere cultures promoted cell migration towards serum (18 hours, *: P<0.05; n=6).
Our results show that EphB2 is both pro-migratory and anti-proliferative in GBM stem-like neurospheres. To determine the general relevancy of these findings, we examined EphB2 gain-of-function in the neurosphere cell line GBM-DM14602 and in primary GBM neurospheres derived from the Mayo 22 xenograft line (40). EphB2 overexpression (Supplementary Fig. 1C) inhibited in vitro cell growth (Fig. 3E, G) and stimulated cell migration (Fig. 3F, H) in these additional neurosphere models.
EphB2 loss-of-function inhibits proliferation and promotes migration
The results presented above support pro-migratory/invasive and anti-proliferative actions of EphB2 in GBM–derived neurosphere cells. To corroborate these findings, we evaluated the effects of knocking down endogenous EphB2 expression in GBM neurospheres. Western blot analysis showed that compared to controls (designated as NS for non-silenced), two EphB2 shRNAs achieved ~90% inhibition of EphB2 expression in HSR-GBM1A neurosphere cells (designated as EphB2KD1 and EphB2KD2, Fig. 4A). In order to visually detect cells transfected with the shRNA, NS and EphB2KD cells were labeled with GFP (Supplementary Fig. 2A-D). We found that EphB2 knock-down significantly inhibited serum-induced neurosphere cell migration by 40-55% (Fig. 4B and C, P<0.001), consistent with the decreased GBM neurosphere cell migration observed in response to the EphB2 competitive antagonist EphB2/Fc (Fig. 2D). EphB2 knock-down also promoted neurosphere cell growth as evidenced by increased cell number and neurosphere formation (Fig. 4D and E). The pro-proliferative effect of EphB2 knock-down was further confirmed by cell cycle analysis, showing that EphB2 knock-down increased cells at S phase by 31% (Fig. 4F, P<0.01). EphB2KD1 cells displayed a 33% increase in EdU incorporation compared to control cells (Fig. 4G and supplementary Fig. 2E, P<0.05). In addition, cyclin B levels increased ~2.2 fold in EphB2KD1 cells (Fig. 4H, P<0.05), consistent with the decreased cyclin B expression in response to EphB2 gain-of-function as shown in Fig. 3D. These results support an inhibiting effect of endogenous EphB2 receptors on cell proliferation.
Figure 4. EphB2 knock-down prevents GBM neurosphere migration and promotes cell growth.
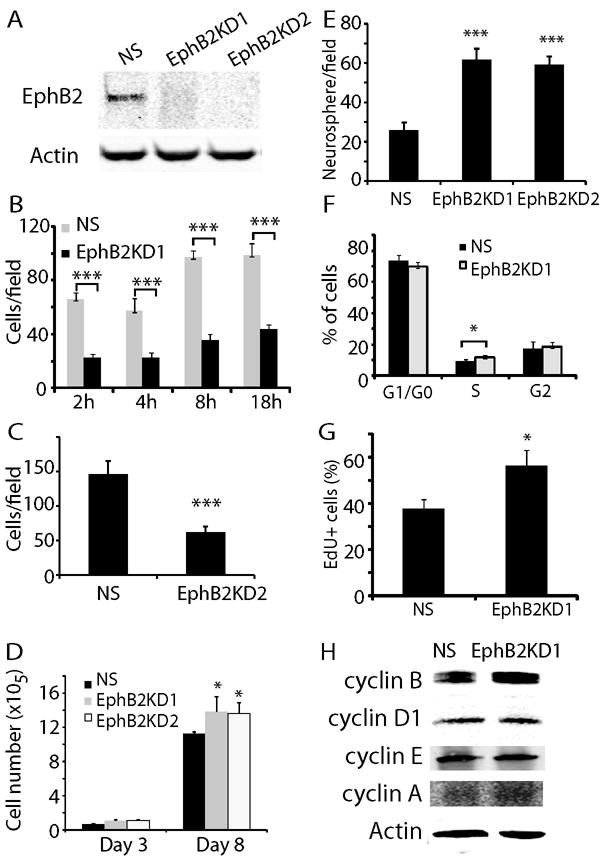
(A). Two EphB2 shRNAs were transfected to HSR-GBM1A cells to generate EphB2 knock down lines. Compared to control (NS), EphB2 expression was knocked down by 90% in cells transfected with EphB2 shRNAs (EphB2KD1 and EphB2KD2), as detected by immunoblot analysis. (B). EphB2 knock-down significantly inhibited cell migration towards serum in transwells 2-18 hours after plating as shown in EphB2KD1 lines (***: P<0.001; n=6). (C). Cell migration towards serum was also reduced in EphB2KD2 cells after 18 h of incubation. (D). Cell number counting indicated that EphB2KD1 and EphB2KD2 cells grew over 20% more than control cells after 8 days in culture (*: P<0.05; n=8). (E). Neurosphere analysis indicated that compared to control, there were 53% and 49% more neurospheres with the size larger than 100 μm in EphB2KD1 and EphB2KD2 cultures, respectively (***: P<0.001, n=6). (F). Cell cycle analysis with flow cytometry in EphB2KD1 cells indicated that EphB2 knock-down increased cells at S-phase by 31% (*: P<0.05; n=6). (G). EdU staining was used to verify cell proliferation in EphB2 knock-down cells. Compared to NS cells, there were 30% more EdU+ cells in EphB2KD1 cultures (*: P<0.05, n=6). (H). Western blot analysis indicated that compared to NS, there was a ~2-fold increase in cyclin B expression in EphB2KD1 cells.
We further examined the effect of EphB2 on stem cell properties of GBM neurospheres. We found that EphB2 overexpression or knock-down did not change the “stemness’ of GBM neurospheres, as indicated by stem cell marker expression in control and experimental cells using real-time PCR (Supplementary Fig. 3A and B). In addition, we examined the expression of stem cell surface marker CD133 and differentiation marker GFAP in Ploc, EphB2-OVE, NS and EphB2KD1 cells by immunoblot analysis. EphB2 overexpression or knock-down did not change the expression of these markers (Supplementary Fig. 3C). Thus, at the molecular level, changes in EphB2 expression did not appear to alter GBM stem cell phenotype.
Xenografts from EphB2 overexpressing GBM neurospheres recapitulate the proliferation/migration dichotomy
We used an internally controlled dual fluorescence model system to determine the effect of EphB2 on tumor invasion in vivo. A 1:1 mixture of RFP+ Ploc cells and GFP+ EphB2-OVE cells (5,000 each) were implanted into the mouse striatum and mice were sacrificed 67 days post-transplant for histological analysis. EphB2-OVE cells clearly displayed an enhanced invasive phenotype as shown in Fig. 5 and Supplementary Figs 4 and 5. The RFP+ control Ploc cells localized mainly to the tumor core, while the green EphB2-OVE cells were preferentially found in the tumor periphery, having invaded surrounding brain and white matter tracts (Fig. 5A-H). A 3D reconstruction from 40 adjacent sections further confirmed the preferential location of EphB2-OVE cells within the invading tumor periphery relative to the control Ploc cells at the tumor core (Fig. 5H, for 3D video imaging see Supplementary Fig. 5). Cell quantification showed ~2.4-fold more EphB2-OVE cells than control Ploc cells along the tumor periphery (Fig. 5G, P<0.05), consistent with the enhanced invasive behavior of EphB2-OVE cells. To quantify EphB2-OVE cell proliferation in vivo, Ploc and EphB2-OVE cells were implanted into separate mouse brains. Ki67 staining revealed a 2.3-fold higher proliferation index in Ploc xenografts compared with EphB2-OVE xenografts (Fig. 5I and J, P<0.001). Thus, our data show that EphB2 promotes a more invasive phenotype with less proliferation in GBM neurospheres, effectively recapitulating the balance between invasion and proliferation observed in human neoplasms. In contrast, we used the same dual fluorescence approach and generated intracranial xenografts from EphB2-overexpressing U87 cells and control cells. EphB2 did not promote invasion in the relatively noninvasive U87 models (Supplementary Fig. 4A-C).
Figure 5. EphB2 controls the proliferation and migration dichotomy of GBM in vivo.
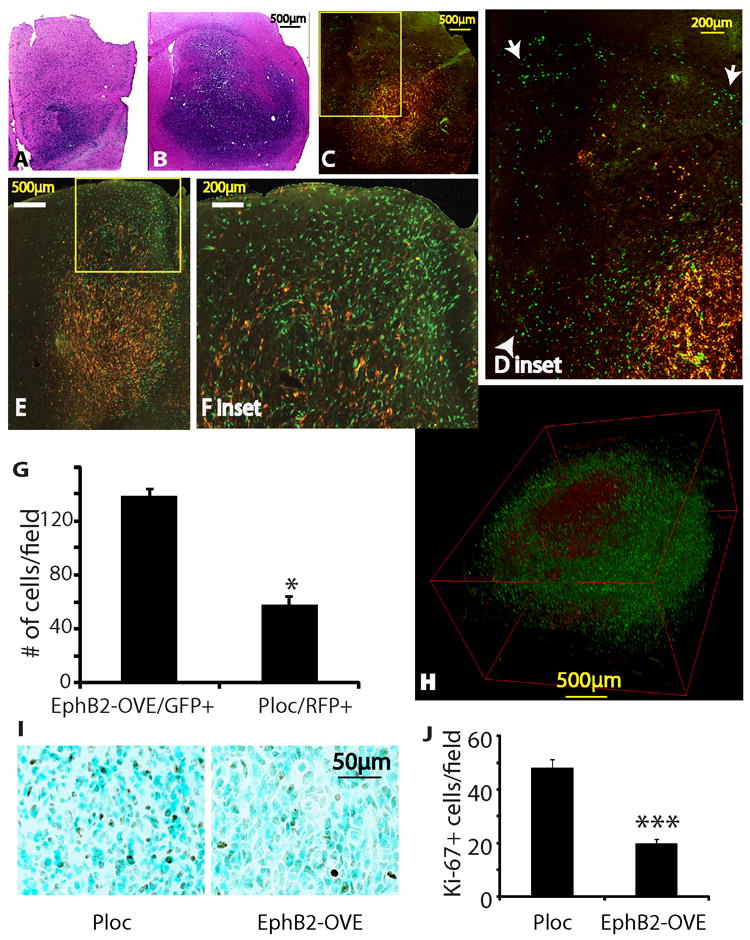
(A-F). Intracranial xenografts derived from the mixture of Ploc (5,000 cells, RFP+) and EphB2-OVE cells (5,000 cells, GFP+) indicated that EphB2 promotes tumor cell migration/invasion in vivo. Animals were sacrificed 67 days post-implantation. A, B. H&E stained sections of the invading margin (A) and the core (B) of a xenograft from the mixtures of Ploc and EphB2-OVE cells. C-F. Fluorescent images of two xenografts from the mixtures of Ploc and EphB2-OVE cells. The green EphB2-OVE cells were wide-spread, whereas the red Ploc cells mostly stayed in the tumor core, consistent with a more invasive phenotype of the EphB2-OVE cells in vivo. Enlarged images of the blocked area in C and E were shown in D and F, respectively. Arrow heads in D show cells invading into normal brain tissues and arrows show cells invading white matter tracts. (G). Quantification of EphB2-OVE cells (GFP+) and Ploc cells (RFP+) in the periphery of tumors indicated that there were 3-fold more EphB2-OVE cells than Ploc cells in the tumor periphery (***: P<0.05, n=3). (H). A three-D view of an intracranial tumor reconstructed from 40 adjacent brain sections. (I). Ploc (10,000) or EphB2-OVE cells (10,000) were separately implanted into mouse brain. Animals were sacrificed 67 days after implantation and brain sections were subjected for immunohistochemistry. Ki-67 staining showed that xenografts from Ploc cells had more cells under proliferation than that from EphB2-OVE cells. (J). Quantification of Ki-67+ cells in xenografts by taking pictures and counting positively stained cells. Xenografts from Ploc cells had 70% higher Ki-67+ staining than that from EphB2-OVE cells (*: P<0.05, n=10).
Focal adhesion kinase (FAK) mediates EphB2 function in GBM neurosphere cells
Since serum differentially induced migration and invasion in these cells, we compared the signaling pathways activated by serum in Ploc and EphB2-OVE cells. No significant differences were observed in AKT and MAPK activation in response to serum (Fig. 6A). However, immunoblot analysis of total cell protein using the anti-phospho-(Ser/Thr)-Akt-Sub antibody, which recognizes consensus AKT substrate sites in multiple proteins [RxRxx(S/T)(F/L)], demonstrated stronger phosphorylation of AKT substrates in EphB2-OVE cultures. Furthermore, serum induced FAK phosphorylation (Y576/577) increased substantially in EphB2-OVE cells (3.1-fold), but only slightly in Ploc cells (Fig. 6A). This suggests that AKT downstream targets and the FAK signaling pathway mediate EphB2-induced cell migration. PI3K-AKT activity has been previously linked to cell migration induced by Eph receptors (41). Studies from Genander et al (38) showed that EphB2 uses PI3K to inhibit migration in intestinal cells. We asked what role does FAK paly in EphB2-mediated migration. Treating Ploc and EphB2-OVE cells with the agonist ephrin-B1/Fc for 15 minutes did not activate AKT and MAPK but increased FAK phosphorylation (Y576/577) 3-fold in EphB2-OVE cells (Fig. 6B, P<0.05). In addition, we found that EphB2 co-immunoprecipitated with FAK in EphB2-OVE cells (Fig. 6C), indicating that EphB2 complexes either directly or indirectly with FAK. Since FAK activation plays an important role in cell adhesion and migration, we studied focal adhesion and cytoskeleton structure in Ploc and EphB2-OVE cells. We examined the influence of EphB2 on the focal adhesion formation of cells grown on laminin-coated surfaces with anti-vinculin antibody. Striking differences in focal adhesion formation were observed between Ploc and EphB2-OVE cells (Fig. 6D). Compared to Ploc cells, strong, punctate vinculin staining in filopodial-like cytoplasmic projections were observed in EphB2-OVE cells, suggesting an increased amount of focal adhesions were formed (Fig. 6D, arrows in higher magnification photomicrograph indicate focal adhesions). Ploc and EphB2-OVE cells were further stained with FAK antibody and phalloidin, which detects polymerized actin (F-actin) in cells. FAK and F-actin co-localized in EphB2-OVE cells much more frequently in comparison to Ploc cells (Fig. 6E, arrows indicate co-localization). These findings show that FAK activation mediates EphB2-induced cell adhesion, actin cytoskeleton organization, and ultimately cell migration. We asked if inhibiting FAK pathways would affect serum-induced cell migration in EphB2-OVE cells using two specific pharmacological FAK inhibitors PF573228 (100 nmol/L) (42) and FAK inhibitor 14 (10 μmol/L) (43). EphB2-OVE cell migration was almost completely blocked by PF573228 (>90%, P<0.001) and FAK inhibitor 14 (>90%, P>0.001) in transwell assay (Fig. 6F). Western blot analysis indicated that PF573228 completely inhibited serum-induced FAK phosphorylation in EphB2-OVE cells under these experimental conditions (Supplementary Fig. 6). On the other hand, PF573228 and FAK inhibitor 14 blocked Ploc cell migration by 45% and 50%, respectively (Fig. 6G). We also found that two specific PI3K pharmacological inhibitors LY294002 (10 μmol/L) and wortmannin (10 μmol/L) (44) block cell migration in both Ploc and EphB2-OVE cells to a similar extent (Fig. 6F and G). In contrast, the MAPK inhibitor PD98059 had no effect on cell migration (Fig. 6F). Collectively, these results suggest that both PI3K-AKT and FAK are required for the migration of GBM stem-like neurospheres; and that FAK activation plays a dominant role in EphB2-induced cell migration.
Figure 6. Mechanisms of EphB2-induced cell migration.
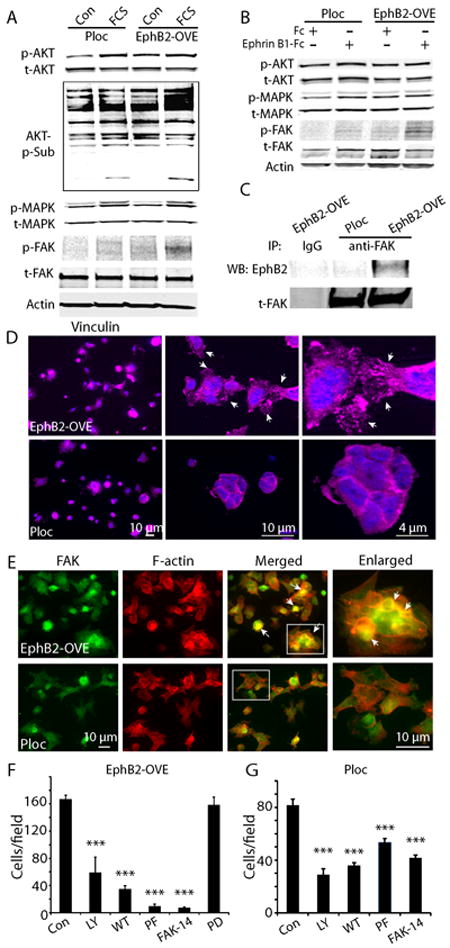
(A). Western blot analysis of cell signaling induced by serum (15 min) in Ploc and EphB2-OVE cells. Serum increases AKT and MAPK activation in both Ploc and EphB2-OVE cells. Serum increased phosphorylation of FAK (Y567/577) and AKT substrates in EphB2-OVE cells. (B). Ploc and EphB2-OVE cells were treated with EphB2 ligand ephrin-B1/Fc (1μg/ml) or human Fc (1μg/ml) for 15 min. Western blot analysis of signaling pathways activated ephrin-B1 in Ploc and EphB2-OVE cells showed that FAK (Y567/577) but not AKT or MAPK was significantly activated in EphB2-OVE cells. (C). Whole cell proteins were extracted from Ploc and EphB2-OVE cells and immunoprecipitated with anti-FAK antibody followed by detecting with anti-EphB2 antibody. In EphB2-OVE cells, EphB2 can be co-immunoprecipitaed with FAK. (D). Ploc and EphB2-OVE cells were grown on laminin-coated glass slides for 40 min and stained with anti-vinculin antibody (1:100) and Alex-fluor 647 conjugated secondary antibody. Fluorescent pictures were taken using fluorescent microscope and Axivison program. In EphB2-OVE cultures, strong and punctuated vinculin stainings were found in the spreading edges of cytoplasma, suggesting formation of focal adhesions (arrows). In Ploc cells, vinculin staining were less spread out, suggesting less focal adhesions were formed. Higher magnification microphotographs were shown in the middle and right panels. (E). Ploc and EphB2-OVE cells were grown on laminin-coated glass slides for 2 h and stained with anti-FAK antibody (1:200) and Alex-fluor 647 conjugated phalloidin to detect F-actin. Since Ploc cells were RFP+, FAK was detected with Alex-fluor 488 conjugated secondary antibody in Ploc cells. And FAK in EphB2-OVE cells (GFP+) were detected with cy3-conjugated secondary antibody. Fluorescent pictures were taken using fluorescent microscope and Axivison program and analyzed with Image J. For the simplicity, we used the same color code for both Ploc and EphB2-OVE cells: green for FAK and red for F-actin. In many EphB2-OVE cells, FAK tends to co-localize with F-actin. Arrows in the panel indicated the co-localization of FAK and F-actin (yellow colors). Hatched areas in merged panel were enlarged in the right panel. In Ploc cells, FAK is less co-stained with F-actin. (F). Migration assay in the presence of pathway specific inhibitors. PI3K-AKT pathway inhibitors LY294002 (LY, 10 μmol/L) and wortmannin (WT, 10 μmol/L) partially inhibited EphB2-OVE cell migration towards serum. FAK pathway inhibitors PF573228 (PF, 100 nmol/L) and FAK inhibitor 14 (FAK-14, 10 μmol/L) inhibited more than 90% cell migration in EphB2-OVE cells. The MAPK inhibitor PD98059 (PD, 30 μmol/L) did not have any effect on GBM neurosphere cell migration towards serum. (G). Effect of PI3K-AKT pathway inhibitors LY294002 and wortmannin as well as FAK pathway inhibitor PF573228 and FAK inhibitor 14 on Ploc cell migration towards serum. All the quantifications were performed 18 hours after incubation (***: P<0.001; n=6).
Discussion
In this work, we show that the receptor tyrosine kinase EphB2 promotes cells invasion using GBM models that recapitulate clinical tumor histopathy with high fidelity. Simultaneously, we found that EphB2 inhibits cell proliferation in these models, implicating that EphB2 regulates the proliferation/migration dichotomy of clinical GBMs. Furthermore, the interactions between EphB2 receptor and FAK play a role in the pro-migratory function of EphB2 in GBM neurospheres.
The effect of EphB2 on GBM cell migration has been previously studied in vitro and ex vivo using adherent GBM cell lines established and passaged extensively in serum-containing media (33, 45). However, the extent to which the findings using relatively non-invasive models predict EphB2 effects in highly invasive human tumors remains a question. In fact, we did not observed the same pro-migratory effect of EphB2 in xenografts derived from the adherent U87 cell line. Our present study used GBM-derived neurospheres established and maintained under non-adherent serum-free medium, conditions that maintain genomic integrity and enrich for tumor-initiating stem-like cells (6, 46). Furthermore, GBM neurosphere-derived xenografts recapitulate the pathological features of clinical glioblastoma including extensive invasiveness. Our internally controlled dual-fluorescent approach clearly showed that EphB2 gain-of-function induces a more prominently invasive phenotype, consistent with published data showing that the EphB2/ephrin-B tyrosine kinase system is associated with invasive phenotype in clinical GBM samples (33, 47, 48). Interestingly, the NCI Rembrandt database does not reveal a correlation between EphB2 expression levels and high grade gliomas. This is likely due to the fact that both low and high grade lesions are characteristically invasive and perhaps the bias in which the database predominantly represents tumor cores without comparisons between more invasive tumor periphery cells (49).
The pro-invasive and anti-proliferative actions of EphB2 in GBM-derived neurospheres represent another example of the diverse functions of Eph receptors in tumor biology. The effect of EphB2 on GBM neurosphere cell growth is consistent with the findings in Nakada et al (45) showing that EphB2 reduces cell growth in U87 GBM cells. In GBM neurosphere cells, we detected cell number, cell cycle and cyclin expression in response to EphB2 overexpression or knock down. Most of our EphB2 gain-of-function and loss-of-function data agreed with each other, indicating an anti-proliferative role of EphB2. In our cell cycle assay, we detected small changes in S-phase, likely because we performed the cell cycle assays in unsynchronized cell populations. We believe these small changes reflect the differences we observed in cell growth, as we reported elsewhere (62). In the cyclin analysis, cyclin D1 was decreased by EphB2 overexpression, but not increased in EphB2 knockdown cells. One potential explanation for this inconsistency is that variations may exist among the different stable lines we used for these studies.
The fact that EphB2 has both pro-migratory and anti-proliferative effects in vivo may reflect the migration/proliferation dichotomy in GBMs (3). While this “go-or-grow” phenomenon of GBM has been documented for over a decade (2, 3), its underlying cellular and molecular mechanisms are largely unknown. Our findings that EphB2 gain-of-function has both pro-migratory and anti-proliferative effects in the same cells provide one mechanism for the “go-or-grow” behavior in GBM. GBM neurosphere cultures contain both stem-like cells, transient amplifying progenies and more differentiated progenitor cells. We noticed that even though EphB2 reduced proliferation and neurosphere formation in GBM neurosphere cultures, overexpressing or knocking-down EphB2 did not alter the stem cell pool as evidenced by stem cell marker expression in the neurosphere cultures. It is likely that EphB2 affects the growth of both stem-like cells and progenitor cells to the same extent.
In our migration assay, we mainly used 10% serum as the chemoattractant since serum is commonly used in glioma cell migration assays, and contains multiple factors that could be present in the brain microenvironment and function as chemotactic sources for tumor cell migration in vivo. Since we obtained similar results in response to HGF in serum-free medium essentially ruled out any potential role for serum-induced cell differentiation in the observed migration responses.
EphA2, another member of the Eph receptor family, has been extensively studied in cancer biology (23, 35, 41, 50). EphA2 overexpression elicits pro-migratory effects in GBM via ligand-independent mechanisms, whereas ligand-dependent activation of EphA2 prevents GBM cell migration. The pro-migratory effect of EphB2 overexpression in GBM neurosphere cells is likely to be ligand-dependent, since EphB2/Fc, which acts as a decoy receptor and sequesters ligands, blocked cell migration in EphB2-OVE cells. The fact that EphB2/Fc also blocked control Ploc cell migration indicates that the endogenous EphB2 activities also contribute to the pro-migratory function of EphB2. As EphB2 ligands are expressed by GBM neurospheres, cell-contact mediated activation of EphB2 could contribute to the baseline EphB2 phosphorylation. However, there is a possibility that EphB2/Fc may stimulate ephrin-B reverse signaling in our models. Future studies with various EphB2 constructs are needed to definitively distinguish the involvement of EphB2 kinase activity in GBM migration. Furthermore, in EphA2-induced cell migration, the PI3K-AKT pathway appears to play a major role in cell migration. In our models, we found that both FAK and PI3K-AKT pathways are involved in GBM neurosphere cell migration. Our findings that pharmacological PI3K inhibitors prevent both Ploc and EphB2-OVE cell migration to a similar extent suggest that PI3K-AKT pathway contributes in a general fashion to GBM neurosphere migration. This is consistent with our Western blot analysis that there is no difference in AKT activation in Ploc and EphB2-OVE cells in response to serum or ephrin-B1/Fc. However, in EphB2-OVE cells there is a stronger phosphorylation of AKT substrates. One potential explanation of these findings is that EphB2 signaling has other effects on downstream PI3K-AKT signaling, such as phosphatase inhibition. Future comprehensive of EphB2-driven proteomic responses should shed light on novel mechanisms of GBM migration.
FAK pathway inhibitors reduced more than 90% cell migration of EphB2-OVE cells but only 50% in control Ploc cells, suggesting that the FAK signaling pathway is the pivotal mediator of EphB2-induced cell migration. The two FAK inhibitors used are highly specific for FAK, with 50~250-fold selectivity over other protein kinases (42, 43). FAK is a convergence point for growth factors and integrins, and is crucial for a variety of cellular processes including cell spreading, adhesion, migration, survival, anoiks, proliferation, differentiation, and angiogenesis (51-54). FAK has been previously shown to function downstream of EphB2 in the regulation of neuronal synaptic structures (55). Our findings that EphB2-FAK interactions mediate the migratory effect in GBM neurosphere cells are consistent with the findings in breast cancer initiating cells that FAK is not required for tumor-initiation, but for tumor cell migration (56). Thus, FAK is an important target for tumor invasive drug design. In fact, several FAK inhibitors have been developed and are currently under clinical trials. Some of them exhibit promising anti-tumor effects (57). FAK influences cell migration by activating three major pathways, i.e. the Src-Cas-crk pathway, PI3K-AKT pathway and RhoA subfamily of small GTPases (51, 58). We found that PI3K inhibition only partially reduced GBM neurosphere cell migration induced by EphB2, suggesting that other pathways mediate EphB2-induced cell migration induced. For example, R-Ras has been reported to mediate EphB2-induced cell migration in U87 GBM cells (45).
Our findings have several other clinical implications. Current anti-tumor strategies such as chemotherapy and radiotherapy mostly target the highly proliferative tumor cell population. Therefore, invasive cells can escape surgical and anti-proliferative therapies via their geometric location and low proliferation rate. EphB2 overexpression may contribute to these resistance mechanisms, since it induces a migratory proliferatively silent phenotype. Currently, Eph receptor-targeting reagents are being developed for cancer therapy (9, 59). Our novel findings predict that EphB2 pathway inhibitors will be anti-invasion in GBM subsets and that this strategy risks inducing a more highly proliferative phenotype. Thus, the successful application of EphB2 inhibitors may require the concurrent use of anti-proliferative modalities such as chemotherapy and/or radiation therapy.
Materials and Methods
Cell culture and Reagents
All reagents were purchased from Sigma Chemical Co. (St. Louis, MO) unless otherwise stated. Ephrin-B1/Fc, EphB2/Fc and human Fc were purchased from R&D systems (Minneapolis, MN). The focal adhesion kinase inhibitors PF573228 and FAK inhibitor 14 were purchased from Tocris Bioscience (Ellisville, MO). The human glioblastoma neurosphere lines HSR-GBM1A (0913) and HSR-GBM1B (0627) was originally derived by Dr. A. Vescovi and colleagues and maintained in serum-free medium supplemented with epidermal growth factor (PeproTech, Rocky Hill, NJ) and fibroblast growth factor (PeproTech) (7, 29, 31, 32, 46). Cells were incubated in a humidified incubator containing 5% CO2/95% air at 37°C, and passaged every 4-5 days. The GBM-DM140207 neurosphere line was derived from a glioblastoma at the University of Freiburg and kindly provided by Dr. Jaroslaw Maciaczy (7). The neurosphere cultures from primary xenograft line Mayo 22 (40) were generated using the same methods and culture conditions as described in Galli et al (46). Mayo 22 neurosphere cultures were used at passage ≤ 10.
Viral transfection
Viral expression vector pLoc containing red fluorescent protein (RFP) or EphB2 cDNA plus green fluorescent protein (GFP, cat # OHS5898-100998954) were obtained from Open Biosystems (Huntsville, AL). EphB2 and GFP were separately transcribed since there is a stop code between them (http://www.openbiosystems.com/collateral/genomics/pi/Precision%20LentiORFs/Precision_LentiORF_Technical_Manual.pdf). Virus was packaged using the Viral Power Packaging system (Invitrogen, Carlsbad, CA) according to the manufacturer’s forward transfection instructions. Virus were collected by centrifuging at 3,000 rpm for 15 min. Neurosphere cells (HSR-GBM1A, GBM-DM140207, Mayo 22 neurospheres) were transfected with virus containing pLoc/RFP or pLoc/EphB2/GFP for 48 h before antibiotic blasticidin (2 μg/ml) was added. For transfected HSR-GBM1A cells, pooled transfectants were further sorted for RFP+ or GFP+ cells at The Flow Cytometry Facility at Johns Hopkins School of Public Health.
To knock down EphB2 expression in GBM neurospheres, virus containing EphB2 shRNA in a GIPZ viral expression vector along with control non-silencing sequence in the same GIPZ vector were obtained from Open Biosystems. Neurosphere cells were transfected with virus for 48 h followed by antibiotic selection with puromycin (4 μg/ml).
Reverse-transcriptase PCR and Quantitative Real-time PCR
Total RNA (1 μg) was reverse-transcribed using the oligo(dT)12-18 primer and Superscript II (Invitrogen) according to the manufacturer’s instructions. The primers used to amplify ephrins are as followings: Ephrin-B1_sense: ggaggcagacaacactgtca; antisense: gaacaatgccaccttggagt. Ephrin-B2_sense: atccaacaagacgtccagaa; antisense: ctgaagcaatccctgcaaat. Ephrin-B3_sense: gaggcatgaaggtgcttctc; antisense: gaggttgcattgctggt. Ephrin-A5-Sense: tctcctctgcaatcccagata; antisense: tacggtgtcatctgctggtt. The thermal cycling conditions were as follows: 95°C, 5 min, followed by 40 cycles of 95°C for 10 seconds, 55°C for 10 seconds, and ended with 72°C for 30 seconds.
Quantitative real-time PCR (RT-PCR) was performed according to Pfaffl et al (60). The primers are as followings: CD133_sense: ctggggctgctgtttattattctg; antisense: acgccttgtccttggtagtgttg. Nestin_sense: aggatgtggaggtagtgaga; antisense: ggagatctcagtggctctt. Musashi-1_sense: gagactgacgcgccccagcc; antisense: cgcctggtccatgaaagtgacg. Sox-2_sense: accggcggcaaccagaagaacag; antisense: gcgccgcggccggtatttat. Total RNA (1 μg) was reverse-transcribed using the oligo(dT)12-18 primer and Superscript II (Invitrogen, CA) according to the manufacturer’s instructions. RT-PCR was performed with an Applied Biosystems Prism 7900 HT Sequence Detection System using SYBR Green PCR Master Mix (Applied Biosystems, CA). The thermal cycling conditions were as follows: 95°C, 5 min, followed by 40 cycles of 95°C for 10 seconds, 55°C for 10 seconds, and ended with 72°C for 30 seconds. Samples were amplified in triplicate and data were analyzed using the Applied Biosystems Prism Sequencer Detection Software Version 2.3 (Applied Biosystems, Forster City, CA). Human 18S rRNA was amplified as endogenous control. Relative expression of each gene was normalized to the 18S-rRNA control.
Neurosphere Assays
For neurosphere assay (29, 31), GBM neurospheres were dissociated and seeded at the density of 5 × 10³/cm2 in 6-well plates containing neurosphere culture medium. Cells were incubated for 5-7 days and neurospheres were transferred into 1% agarose, fixed and stained with Wright solution (1%). Neurosphere number and size were analyzed by computer-assisted morphometry (MCID, Linton, Cambridge, England). Number of neurospheres ≥ 100 μm in diameter in 3 random microscopic fields per well were measured.
Cell migration and invasion assay
Both sides of transwell (Corning, Lowell, MA) were coated with 10 μg/ml laminin at 37°C overnight followed by washing with phosphate buffer saline (PBS) for 3 times (35, 36). GBM neurosphere cells were incubated in growth factor-free medium for 24 h and cells were suspended at 1×10⁶ cells / ml. One hundred microliters of cell suspension were added to the upper chamber of the transwell. Minimum Essential Medium Eagle medium (650 μl) containing 10% fetal calf serum (FCS) was added to the lower chamber. In some studies, ephrin-B1/Fc (1 μg/ml) or human Fc (1 μg/ml) was added to the lower chamber. When inhibitors were used, cells were incubated with inhibitors for half hour prior to being added to the upper chamber. The cells were then pelleted at 1000 rpm for 10 minutes and resuspended in growth factor-free medium infused with the appropriate inhibitors. After overnight incubation at 37°C, cells were fixed with Diff-Quick kit (Fisher Scientific, Pittsburgh, PA). Cells on the upper side of transwells were gently wiped off with Q-tips. Cells migrating through the filter were stained with 4’-6-Diamidino-2-phenylindole (DAPI) (Vector Laboratories, Burlingame, CA). Migration was quantified by counting cells on five selected fields of view per transwell using 10 × magnifications in triplicates in at least three independent experiments. For invasion assay, we performed a similar procedure using growth factor-reduced matrigel-coated transwells (BD Biosciences, Bedford, MA). Cells invading to the bottom well were quantified after 48 h of incubation.
Scratch assay
GBM neurosphere cells were grown on poly-L-Lysine (100 mmol/L) and 10 μg/ml laminin coated 35 mm dishes until confluent. Cultures were treated with mitomycin C (1 μg/ml) for half hour and then washed with PBS 3 times. Several scratches were performed using a 10 μl pipette tip through the cells. A mark was drawn on the bottom of the dish for identification purposes. Phase contrast pictures were taken at different time points under a 10× object. The distances were measured and quantified as previously described (61).
Cell adhesion assay
Twenty-four well plates were coated with laminin (10 μg/ml) at 37°C overnight and rinsed twice with Dulbecco’s Modified Eagle Medium (DMEM) medium containing 0.1% bovine serum albumin (BSA). After blocking the plates with DMEM containing 0.5% BSA for 1 hr at 37°C, GBM neurosphere cell suspensions (0.5 ml) were plated at a density of 4×10⁵/ml. Cells were incubated for 30 min. Plates were shaken at 2000 rpm for 15 seconds, washed with pre-warmed DMEM medium containing 0.1% BSA twice, and fixed with 4% paraformaldehyde for 15 min at room temperature. Cells were stained with Crystal violet (0.5%) and dissolved in 2% SDS. The plates were read at 550 nm.
Cell cycle analysis and 5-ethynyl-2′-deoxyuridine (EdU) staining
Cell cycle was analyzed by flow cytometry on a FACSCalibur (Becton-Dickinson, Mountain View, CA) (62). Briefly, GBM neurosphere cells were collected and dissociated by vigorously pipetting. Cells were fixed with 75% ethanol at 4°C for 30 min. Cells were incubated with DNase-free RNase at 37°C for 30 min followed by propidium iodide (100 ng/ml) for 1 hour at 37°C. The percentage of cells at each cell cycle phase (G1/G0, S and G2/M) was analyzed using CellQuest software (Becton-Dickinson).
EdU staining was conducted using Click-iT™ EdU Imaging Kit (Invitrogen) according to the manufacturer’s protocol with modifications. GBM neurospheres were collected and fixed with 4% paraformaldehyde in PBS for 15 min. After washing twice with PBS containing 3% BSA, the cells were permeabilized with PBS containing 0.5% Triton X-100 for 20 min. The cells were incubated with a Click-iT™ reaction cocktail containing Click-iT™ reaction buffer, CuSO4, Alexa Fluor 594 Azide, and a reaction buffer additive for 30 min. After washing with PBS, the cells were centrifuged onto glass slides and covered with Vectashield mounting media containing DAPI (Vector Laboratories). EdU positive cells were counted and quantified under a fluorescent microscope.
Cell stimulation, immunoprecipitation and immunoblot
To study the signaling events after serum or ligand stimulation, GBM neurospheres were dissociated to single cell suspension by mechanical force and starved in growth factor-free medium for 4 hours followed by treatment with FCS (10%) or ephrin-B1/Fc (1 μg/ml) for 15 min. Cells were lysed with RIPA buffer (50 mM Tris-HCl, pH 7.4, 150 mM NaCl, 1% NP-40, 0.25% Na-deoxycholate) containing protease and phosphatase inhibitors (Calbiochem, San Diego, CA) and sonicated for 15 seconds; the suspensions were centrifuged at 3,000 g for 10 minutes. Protein concentrations were determined using the Coomassie Protein Assay Reagent (Pierce, Rockford, IL). Immunoprecipitation of EphB2 or total FAK was carried out as previously described (15, 33). In brief, three hundred micrograms of total proteins were incubated with goat anti–EphB2 (9 μg; R&D Systems) or rabbit anti-total FAK (1:200) for 18 hours at 4°C. Corresponding IgG was used as a negative control. Protein-antibody complexes were precipitated with protein G–Sepharose beads (50 μL; GE Healthcare, Piscataway, NJ), and the precipitates were eluted by boiling in 2 × SDS sample buffer (3% SDS,1% β –Mercaptoethanol, 10% glycerol, 62.5mM TRIS base, 0.005% Bromophenol blue). Proteins were separated using 4–20% SDS-PAGE gels (Lonza, Williamsport, PA) and blotted onto nitrocellulose membranes (GE Healthcare) (62). Membranes were incubated in Odyssey Licor blocking buffer (LI-COR Biosciences, Lincoln, NE) for 1 hour at room temperature and then overnight with primary antibodies at 4°C in Odyssey blocking buffer. After rinsing, membranes were incubated with IRDye secondary antibodies (1:15000-1:20,000, LI-COR Biosciences) and protein expression changes were quantified by dual wavelength immunofluorescence imaging (Odyssey Infrared Imaging System, LI-COR Biosciences) scanning of the membranes as previously described (7, 61). To detect the phosphoralytion of EphB2, anti–phosphotyrosine mouse monoclonal antibody (Cell Signaling Technology, Danvers, MA) was used and membranes were reprobed with mouse anti–EphB2 antibodies (Abcam, Cambridge, MA).
For immunoblot, all the primary antibodies were purchased from Cell Signaling Technology unless otherwise stated: anti-phospho-tyrosine, anti-total-AKT, anti-phospho-AKT, anti- phosphor(Ser/Thr) AKT--substrate, anti-total MAPK (BD Biosciences), anti-phospho-MAPK, anti-total FAK, anti-phospho-Try576/577-FAK and anti-β-actin. Antibodies against cyclin A, B, D1, E, p21 and p27 were all purchased from Santa Cruz (Santa Cruz, CA) and diluted according to the manufacturers’ recommendations.
Immunocytotochemistry
Neurosphere cells were grown on laminin-coated glass slides. Cells were fixed with 4% paraformaldehyde for 30 min at 4°C and permeabilized with PBS containing 0.1% Triton X-100 for 10 min. The cells were then incubated with primary antibodies at 4°C overnight and then incubated with appropriate corresponding secondary antibodies conjugated with fluorescent dye for 30 min at room temperature. The primary antibodies were anti-FAK (1:200, Cell signaling), vinculin (1:100, Millipore). Secondary antibody used for red-fluorescent labeled cells were conjugated with Alex Flourescent 488. Secondary antibody used for green-fluorescent-labeled cells were conjugated with Alex Flourescent 555 or Cy3. For double staining with Factin, Alex Flourecent 647-conjugated phalloindin (1 unit, Invitrogene) was used to incubate with the cells. Slides were mounted with Vectashield Antifade solution containing DAPI (Vector Laboratories, CA) and observed under fluorescent microscopy. Immunofluorescent images were taken and analyzed using Axiovision software (Zeiss, Germany).
Tumor Xenografts, immunofluorescent images and immunohistochemistry
For intracranial xenografts, female 4- to 6-week-old SCID immunodeficient mice (National Cancer Institute, Bethesda, MD) received 10,000 viable GBM neurosphere cells in 2 μl of PBS by stereotactic injection to the right caudate/putamen (63). Cell viability was determined by trypan blue dye exclusion. Mice were sacrificed 6-8 weeks after implantation and the brains were fixed with 4% paraformaldehyde for 48 hours followed by 30% surcrose for 72-96 hours. Frozen brains were embedded with Tissue-Tek O.C.T. Compound (VWR, Radnor, PA) and cut at 20 μm. Brain sections were stained with hemotoxylin and eosin (H&E) according to Lal et al (63). All animal protocols used in this study were approved by the Johns Hopkins School of Medicine Animal Care and Use Committee.
For immunofluorescent images, brain sections were mounted with Vectashield Antifade solution containing DAPI (Vector Laboratories). Immunofluorescent images were taken under fluorescent microscopy and analyzed using Axiovision software (Zeiss, Germany). To quantify GFP+ or RFP+ cells in brain sections, fluorescent photomicrographs were taken along the periphery of tumors. GFP+ and RFP+ cells in three brain sections from each tumor, including the section with largest tumor cross-section area, were manually countered.
For Ki-67 staining, brain sections were permeabilized with PBS containing 0.5% Triton X-100 for 5 min. The endogenous peroxidase was blocked with 3% H2O2. Sections were blocked with 5% normal goat serum, and incubated with mouse monoclonal anti-Ki67 (BD Biosciences) at 4°C overnight. Non-immune mouse IgG was used at the same concentration as negative control. The next day, sections were washed 3 times with PBS, followed by incubation with biotinylated goat anti-mouse secondary antibody for 30 minutes. Signals were detected with Vectastain ABC kit (Vector Laboratories), and visualized with 3, 3′-diaminobenzidine. Sections were counterstained with methyl green (0.5%) and dehydrated with 70% and 100% alcohol. Sections were further incubated in xylene and then mounted with Permount. At least ten sequential bright field pictures were taken in each tumor under a 40X object and Ki-67 positive cells were quantified.
Statistical analysis
Data were analyzed using parametric statistics with one-way ANOVA. Post-hoc tests included the Students T-Test and the Tukey multiple comparison tests as appropriate using Prism (GraphPad, San Diego, CA). All experiments reported here represent at least three independent replications. All data are represented as mean value ± standard error of mean (S.E.) significance was set at P < 0.05.
Supplementary Material
A. EphB2 overexpression promotes GBM neurosphere cell invasion through matrigel-coated transwells. Cells that invaded the bottom of transwells were stained with DAPI and counted. There were 2-fold more EphB2-OVE cells than Ploc cells after 48 hours (***:P<0.001, n=6). B. EphB2 overexpression did not influence cell viability as there was no difference in trypan blue positive cells in Ploc and EphB2-OVE cultures (n=4). C. Immunoblot analysis verified EphB2 overexpression in GBM-DM140207 and neurosphere cultures from primary xenografts line Mayo 22.
Fluorescent images of GBM neurospheres transfected with EphB2 shRNA1 (EphB2KD1) or control non-silencing shRNA (NS). Both were labeled with GFP. A, C. Phase contrast pictures of GBM-neurospheres grown as neurospheres in cultures. B, D. Fluorescent pictures of NS cells and EphB2KD cells expressing GFP. Bar=100 μm. E. EdU staining (green) of NS and EphB2KD1 cells. EphB2KD1 cultures had 30% more EdU staining compared to NS. Nucleus was stained with DAPI. Bar=100 μm.
EphB2 manipulation did not change the “stemness” of GBM neurosphere cells. (A, B). RNAs were extracted from Ploc and EphB2-OVE cells. GBM stem cell marker nestin, Sox-2, and Msi-1 were detected using real-time PCR. 18S RNA expression was used as an internal control. There was no significant difference in the expression of these stem cell markers at mRNA level in Ploc and EphB2-OVE cells. The same situation was found in NS and EphB2KD1 cells, indicating that EphB2 manipulation did not change the expression of stem cell markers. (C). Western blot analysis of stem cell marker CD133 and differentiation marker GFAP in EphB2 manipulated cells. Compared to their control, EphB2 overexpression of knock-down did not change the expression of CD133 and GFAP at protein level.
(A-C). Similar dual-fluorescent approach was performed in U87 glioblastoma cells. U87 cells with EphB2 overexpression were labeled with GFP and mixed with control transfected cells that labeld with RFP. A mixture of control and EphB2 overexpressing U87 cells was implanted into mouse brain. EphB2 overexpressing U87 cells did not show increased cell migration in vivo. Bar=100 μm.
A 3D view of a xenograft reconstructed from 40 brain sections showing that control Ploc cells (red) remained mostly in the tumor core while EphB2 overexpressing cells (green) traveled further and expanded in the periphery of the tumor.
(A). The FAK inhibitor PF573228 (100 nmol/L) completely blocked FAK activation induced by 10% FCS in EphB2-OVE cells after half hour pre-incubation. (B) Ploc and EphB2-OVE cells were treated with PF573228 (100 nmol/L) or FAK inhibitor 14 (10 μmol/L) for half hour and the whole cell lysates were assayed for phosphotyrosine containing proteins by immunoblot. The phosphotyrosine levels in Ploc cells were not affected by either FAK inhibitor. The baseline phosphotyrosine levels in EphB2-OVE cells were slightly higher than that of Ploc cells, and also not affected by FAK inhibitors.
Acknowledgments
This work is supported by the Maryland Stem Cell Research Fund (MSCRFE) 2009-0126-00 (SX), NIH NS43987 (JL), and the James S. McDonnell Foundation (JL). We thank Dr. Hugo Guerrero-Cazares for his technical advice. We thank Miss Mir Shanaz Hossain for her technical assistance. We thank Mr. Hao Zhang from Johns Hopkins School of Public Health, for his assistance with flow cytometric analysis.
Footnotes
Author contributions: S.W.: Collection and assembly of data, Data analysis and interpretation, Final approval; P.R., B.L., JP. R., Y.L., C.R.G: Collection and assembly of data, Final approval; J.L.: Financial support, Administrative support, Data analysis and interpretation, Manuscript writing, Final approval. S. X.: Conception and design, Financial support, Administrative support, Collection and assembly of data, Data analysis and interpretation, Manuscript writing, Final approval.
References
- 1.Quick A, Patel D, Hadziahmetovic M, Chakravarti A, Mehta M. Current therapeutic paradigms in glioblastoma. Rev Recent Clin Trials. 2010;5:14–27. doi: 10.2174/157488710790820544. [DOI] [PubMed] [Google Scholar]
- 2.Giese A, Bjerkvig R, Berens ME, Westphal M. Cost of migration: invasion of malignant gliomas and implications for treatment. J Clin Oncol. 2003;21:1624–36. doi: 10.1200/JCO.2003.05.063. [DOI] [PubMed] [Google Scholar]
- 3.Giese A, Loo MA, Tran N, Haskett D, Coons SW, Berens ME. Dichotomy of astrocytoma migration and proliferation. Int J Cancer. 1996;67:275–82. doi: 10.1002/(SICI)1097-0215(19960717)67:2<275::AID-IJC20>3.0.CO;2-9. [DOI] [PubMed] [Google Scholar]
- 4.Rahman R, Smith S, Rahman C, Grundy R. Antiangiogenic therapy and mechanisms of tumor resistance in malignant glioma. J Oncol. 2010;2010:251231. doi: 10.1155/2010/251231. [DOI] [PMC free article] [PubMed] [Google Scholar]
- 5.Candolfi M, Curtin JF, Nichols WS, Muhammad AG, King GD, Pluhar GE, et al. Intracranial glioblastoma models in preclinical neuro-oncology: neuropathological characterization and tumor progression. J Neurooncol. 2007;85:133–48. doi: 10.1007/s11060-007-9400-9. [DOI] [PMC free article] [PubMed] [Google Scholar]
- 6.Lee J, Kotliarova S, Kotliarov Y, Li A, Su Q, Donin NM, et al. Tumor stem cells derived from glioblastomas cultured in bFGF and EGF more closely mirror the phenotype and genotype of primary tumors than do serum-cultured cell lines. Cancer Cell. 2006;9:391–403. doi: 10.1016/j.ccr.2006.03.030. [DOI] [PubMed] [Google Scholar]
- 7.Ying M, Wang S, Sang Y, Sun P, Lal B, Goodwin CR, et al. Regulation of glioblastoma stem cells by retinoic acid: role for Notch pathway inhibition. Oncogene. 2011;30:3454–67. doi: 10.1038/onc.2011.58. [DOI] [PMC free article] [PubMed] [Google Scholar]
- 8.Pasquale EB. Eph-ephrin bidirectional signaling in physiology and disease. Cell. 2008;133:38–52. doi: 10.1016/j.cell.2008.03.011. [DOI] [PubMed] [Google Scholar]
- 9.Pasquale EB. Eph receptors and ephrins in cancer: bidirectional signalling and beyond. Nat Rev Cancer. 2010;10:165–80. doi: 10.1038/nrc2806. [DOI] [PMC free article] [PubMed] [Google Scholar]
- 10.Arvanitis D, Davy A. Eph/ephrin signaling: networks. Genes Dev. 2008;22:416–29. doi: 10.1101/gad.1630408. [DOI] [PMC free article] [PubMed] [Google Scholar]
- 11.Noren NK, Pasquale EB. Paradoxes of the EphB4 receptor in cancer. Cancer Res. 2007;67:3994–7. doi: 10.1158/0008-5472.CAN-07-0525. [DOI] [PubMed] [Google Scholar]
- 12.Batlle E, Bacani J, Begthel H, Jonkheer S, Gregorieff A, van de Born M, et al. EphB receptor activity suppresses colorectal cancer progression. Nature. 2005;435:1126–30. doi: 10.1038/nature03626. [DOI] [PubMed] [Google Scholar]
- 13.Conover JC, Doetsch F, Garcia-Verdugo JM, Gale NW, Yancopoulos GD, Alvarez-Buylla A. Disruption of Eph/ephrin signaling affects migration and proliferation in the adult subventricular zone. Nat Neurosci. 2000;3:1091–7. doi: 10.1038/80606. [DOI] [PubMed] [Google Scholar]
- 14.Cortina C, Palomo-Ponce S, Iglesias M, Fernandez-Masip JL, Vivancos A, Whissell G, et al. EphB-ephrin-B interactions suppress colorectal cancer progression by compartmentalizing tumor cells. Nat Genet. 2007;39:1376–83. doi: 10.1038/ng.2007.11. [DOI] [PubMed] [Google Scholar]
- 15.Noren NK, Foos G, Hauser CA, Pasquale EB. The EphB4 receptor suppresses breast cancer cell tumorigenicity through an Abl-Crk pathway. Nat Cell Biol. 2006;8:815–25. doi: 10.1038/ncb1438. [DOI] [PubMed] [Google Scholar]
- 16.Chiu ST, Chang KJ, Ting CH, Shen HC, Li H, Hsieh FJ. Over-expression of EphB3 enhances cell-cell contacts and suppresses tumor growth in HT-29 human colon cancer cells. Carcinogenesis. 2009;30:1475–86. doi: 10.1093/carcin/bgp133. [DOI] [PubMed] [Google Scholar]
- 17.Noblitt LW, Bangari DS, Shukla S, Knapp DW, Mohammed S, Kinch MS, et al. Decreased tumorigenic potential of EphA2-overexpressing breast cancer cells following treatment with adenoviral vectors that express EphrinA1. Cancer Gene Ther. 2004;11:757–66. doi: 10.1038/sj.cgt.7700761. [DOI] [PubMed] [Google Scholar]
- 18.Fox BP, Kandpal RP. Invasiveness of breast carcinoma cells and transcript profile: Eph receptors and ephrin ligands as molecular markers of potential diagnostic and prognostic application. Biochem Biophys Res Commun. 2004;318:882–92. doi: 10.1016/j.bbrc.2004.04.102. [DOI] [PubMed] [Google Scholar]
- 19.Fukai J, Yokote H, Yamanaka R, Arao T, Nishio K, Itakura T. EphA4 promotes cell proliferation and migration through a novel EphA4-FGFR1 signaling pathway in the human glioma U251 cell line. Mol Cancer Ther. 2008;7:2768–78. doi: 10.1158/1535-7163.MCT-07-2263. [DOI] [PubMed] [Google Scholar]
- 20.Kuijper S, Turner CJ, Adams RH. Regulation of angiogenesis by Eph-ephrin interactions. Trends Cardiovasc Med. 2007;17:145–51. doi: 10.1016/j.tcm.2007.03.003. [DOI] [PubMed] [Google Scholar]
- 21.Surawska H, Ma PC, Salgia R. The role of ephrins and Eph receptors in cancer. Cytokine Growth Factor Rev. 2004;15:419–33. doi: 10.1016/j.cytogfr.2004.09.002. [DOI] [PubMed] [Google Scholar]
- 22.Brantley-Sieders DM, Zhuang G, Hicks D, Fang WB, Hwang Y, Cates JM, et al. The receptor tyrosine kinase EphA2 promotes mammary adenocarcinoma tumorigenesis and metastatic progression in mice by amplifying ErbB2 signaling. J Clin Invest. 2008;118:64–78. doi: 10.1172/JCI33154. [DOI] [PMC free article] [PubMed] [Google Scholar]
- 23.Larsen AB, Pedersen MW, Stockhausen MT, Grandal MV, van Deurs B, Poulsen HS. Activation of the EGFR gene target EphA2 inhibits epidermal growth factor-induced cancer cell motility. Mol Cancer Res. 2007;5:283–93. doi: 10.1158/1541-7786.MCR-06-0321. [DOI] [PubMed] [Google Scholar]
- 24.Vaught D, Chen J, Brantley-Sieders DM. Regulation of mammary gland branching morphogenesis by EphA2 receptor tyrosine kinase. Mol Biol Cell. 2009;20:2572–81. doi: 10.1091/mbc.E08-04-0378. [DOI] [PMC free article] [PubMed] [Google Scholar]
- 25.Lugli A, Spichtin H, Maurer R, Mirlacher M, Kiefer J, Huusko P, et al. EphB2 expression across 138 human tumor types in a tissue microarray: high levels of expression in gastrointestinal cancers. Clin Cancer Res. 2005;11:6450–8. doi: 10.1158/1078-0432.CCR-04-2458. [DOI] [PubMed] [Google Scholar]
- 26.Alazzouzi H, Davalos V, Kokko A, Domingo E, Woerner SM, Wilson AJ, et al. Mechanisms of inactivation of the receptor tyrosine kinase EPHB2 in colorectal tumors. Cancer research. 2005;65:10170–3. doi: 10.1158/0008-5472.CAN-05-2580. [DOI] [PubMed] [Google Scholar]
- 27.Huusko P, Ponciano-Jackson D, Wolf M, Kiefer JA, Azorsa DO, Tuzmen S, et al. Nonsense-mediated decay microarray analysis identifies mutations of EPHB2 in human prostate cancer. Nature genetics. 2004;36:979–83. doi: 10.1038/ng1408. [DOI] [PubMed] [Google Scholar]
- 28.Lee HS, Nishanian TG, Mood K, Bong YS, Daar IO. EphrinB1 controls cell-cell junctions through the Par polarity complex. Nat Cell Biol. 2008;10:979–86. doi: 10.1038/ncb1758. [DOI] [PMC free article] [PubMed] [Google Scholar]
- 29.Bar EE, Chaudhry A, Lin A, Fan X, Schreck K, Matsui W, et al. Cyclopamine-mediated hedgehog pathway inhibition depletes stem-like cancer cells in glioblastoma. Stem Cells. 2007;25:2524–33. doi: 10.1634/stemcells.2007-0166. [DOI] [PMC free article] [PubMed] [Google Scholar]
- 30.Fan X, Khaki L, Zhu TS, Soules ME, Talsma CE, Gul N, et al. NOTCH pathway blockade depletes CD133-positive glioblastoma cells and inhibits growth of tumor neurospheres and xenografts. Stem Cells. 2010;28:5–16. doi: 10.1002/stem.254. [DOI] [PMC free article] [PubMed] [Google Scholar]
- 31.Sun P, Xia S, Lal B, Eberhart CG, Quinones-Hinojosa A, Maciaczyk J, et al. DNER, an epigenetically modulated gene, regulates glioblastoma-derived neurosphere cell differentiation and tumor propagation. Stem Cells. 2009;27:1473–86. doi: 10.1002/stem.89. [DOI] [PMC free article] [PubMed] [Google Scholar]
- 32.Ying M, Sang Y, Li Y, Guerrero-Cazares H, Quinones-Hinojosa A, Vescovi AL, et al. KLF9, A Differentiation-Associated Transcription Factor, Suppresses Notch1 Signaling and Inhibits Glioblastoma-Initiating Stem Cells. Stem Cells. 2010;29:20–31. doi: 10.1002/stem.561. [DOI] [PMC free article] [PubMed] [Google Scholar]
- 33.Nakada M, Niska JA, Miyamori H, McDonough WS, Wu J, Sato H, et al. The phosphorylation of EphB2 receptor regulates migration and invasion of human glioma cells. Cancer Res. 2004;64:3179–85. doi: 10.1158/0008-5472.can-03-3667. [DOI] [PubMed] [Google Scholar]
- 34.Kumar SR, Scehnet JS, Ley EJ, Singh J, Krasnoperov V, Liu R, et al. Preferential induction of EphB4 over EphB2 and its implication in colorectal cancer progression. Cancer Res. 2009;69:3736–45. doi: 10.1158/0008-5472.CAN-08-3232. [DOI] [PubMed] [Google Scholar]
- 35.Miao H, Li DQ, Mukherjee A, Guo H, Petty A, Cutter J, et al. EphA2 mediates ligand-dependent inhibition and ligand-independent promotion of cell migration and invasion via a reciprocal regulatory loop with Akt. Cancer Cell. 2009;16:9–20. doi: 10.1016/j.ccr.2009.04.009. [DOI] [PMC free article] [PubMed] [Google Scholar]
- 36.Pollard SM, Yoshikawa K, Clarke ID, Danovi D, Stricker S, Russell R, et al. Glioma stem cell lines expanded in adherent culture have tumor-specific phenotypes and are suitable for chemical and genetic screens. Cell Stem Cell. 2009;4:568–80. doi: 10.1016/j.stem.2009.03.014. [DOI] [PubMed] [Google Scholar]
- 37.Heese O, Disko A, Zirkel D, Westphal M, Lamszus K. Neural stem cell migration toward gliomas in vitro. Neuro Oncol. 2005;7:476–84. doi: 10.1215/S1152851704000754. [DOI] [PMC free article] [PubMed] [Google Scholar]
- 38.Genander M, Halford MM, Xu NJ, Eriksson M, Yu Z, Qiu Z, et al. Dissociation of EphB2 signaling pathways mediating progenitor cell proliferation and tumor suppression. Cell. 2009;139:679–92. doi: 10.1016/j.cell.2009.08.048. [DOI] [PMC free article] [PubMed] [Google Scholar]
- 39.Holmberg J, Genander M, Halford MM, Anneren C, Sondell M, Chumley MJ, et al. EphB receptors coordinate migration and proliferation in the intestinal stem cell niche. Cell. 2006;125:1151–63. doi: 10.1016/j.cell.2006.04.030. [DOI] [PubMed] [Google Scholar]
- 40.Sarkaria JN, Carlson BL, Schroeder MA, Grogan P, Brown PD, Giannini C, et al. Use of an orthotopic xenograft model for assessing the effect of epidermal growth factor receptor amplification on glioblastoma radiation response. Clin Cancer Res. 2006;12:2264–71. doi: 10.1158/1078-0432.CCR-05-2510. [DOI] [PubMed] [Google Scholar]
- 41.Brantley-Sieders DM, Caughron J, Hicks D, Pozzi A, Ruiz JC, Chen J. EphA2 receptor tyrosine kinase regulates endothelial cell migration and vascular assembly through phosphoinositide 3-kinase-mediated Rac1 GTPase activation. J Cell Sci. 2004;117:2037–49. doi: 10.1242/jcs.01061. [DOI] [PubMed] [Google Scholar]
- 42.Slack-Davis JK, Martin KH, Tilghman RW, Iwanicki M, Ung EJ, Autry C, et al. Cellular characterization of a novel focal adhesion kinase inhibitor. The Journal of biological chemistry. 2007;282:14845–52. doi: 10.1074/jbc.M606695200. [DOI] [PubMed] [Google Scholar]
- 43.Golubovskaya VM, Nyberg C, Zheng M, Kweh F, Magis A, Ostrov D, et al. A small molecule inhibitor, 1,2,4,5-benzenetetraamine tetrahydrochloride, targeting the y397 site of focal adhesion kinase decreases tumor growth. J Med Chem. 2008;51:7405–16. doi: 10.1021/jm800483v. [DOI] [PMC free article] [PubMed] [Google Scholar]
- 44.Walker EH, Pacold ME, Perisic O, Stephens L, Hawkins PT, Wymann MP, et al. Structural determinants of phosphoinositide 3-kinase inhibition by wortmannin, LY294002, quercetin, myricetin, and staurosporine. Mol Cell. 2000;6:909–19. doi: 10.1016/s1097-2765(05)00089-4. [DOI] [PubMed] [Google Scholar]
- 45.Nakada M, Niska JA, Tran NL, McDonough WS, Berens ME. EphB2/R-Ras signaling regulates glioma cell adhesion, growth, and invasion. Am J Pathol. 2005;167:565–76. doi: 10.1016/S0002-9440(10)62998-7. [DOI] [PMC free article] [PubMed] [Google Scholar]
- 46.Galli R, Binda E, Orfanelli U, Cipelletti B, Gritti A, De Vitis S, et al. Isolation and characterization of tumorigenic, stem-like neural precursors from human glioblastoma. Cancer Res. 2004;64:7011–21. doi: 10.1158/0008-5472.CAN-04-1364. [DOI] [PubMed] [Google Scholar]
- 47.Hoelzinger DB, Mariani L, Weis J, Woyke T, Berens TJ, McDonough WS, et al. Gene expression profile of glioblastoma multiforme invasive phenotype points to new therapeutic targets. Neoplasia. 2005;7:7–16. doi: 10.1593/neo.04535. [DOI] [PMC free article] [PubMed] [Google Scholar]
- 48.Nakada M, Anderson EM, Demuth T, Nakada S, Reavie LB, Drake KL, et al. The phosphorylation of ephrin-B2 ligand promotes glioma cell migration and invasion. Int J Cancer. 2010;126:1155–65. doi: 10.1002/ijc.24849. [DOI] [PMC free article] [PubMed] [Google Scholar]
- 49.Madhavan S, Zenklusen JC, Kotliarov Y, Sahni H, Fine HA, Buetow K. Rembrandt: helping personalized medicine become a reality through integrative translational research. Mol Cancer Res. 2009;7:157–67. doi: 10.1158/1541-7786.MCR-08-0435. [DOI] [PMC free article] [PubMed] [Google Scholar]
- 50.Taddei ML, Parri M, Angelucci A, Onnis B, Bianchini F, Giannoni E, et al. Kinase-dependent and -independent roles of EphA2 in the regulation of prostate cancer invasion and metastasis. Am J Pathol. 2009;174:1492–503. doi: 10.2353/ajpath.2009.080473. [DOI] [PMC free article] [PubMed] [Google Scholar]
- 51.Chatzizacharias NA, Kouraklis GP, Theocharis SE. Clinical significance of FAK expression in human neoplasia. Histol Histopathol. 2008;23:629–50. doi: 10.14670/HH-23.629. [DOI] [PubMed] [Google Scholar]
- 52.Cox BD, Natarajan M, Stettner MR, Gladson CL. New concepts regarding focal adhesion kinase promotion of cell migration and proliferation. J Cell Biochem. 2006;99:35–52. doi: 10.1002/jcb.20956. [DOI] [PubMed] [Google Scholar]
- 53.Frisch SM, Vuori K, Ruoslahti E, Chan-Hui PY. Control of adhesion-dependent cell survival by focal adhesion kinase. J Cell Biol. 1996;134:793–9. doi: 10.1083/jcb.134.3.793. [DOI] [PMC free article] [PubMed] [Google Scholar]
- 54.van Nimwegen MJ, van de Water B. Focal adhesion kinase: a potential target in cancer therapy. Biochem Pharmacol. 2007;73:597–609. doi: 10.1016/j.bcp.2006.08.011. [DOI] [PubMed] [Google Scholar]
- 55.Shi Y, Pontrello CG, DeFea KA, Reichardt LF, Ethell IM. Focal adhesion kinase acts downstream of EphB receptors to maintain mature dendritic spines by regulating cofilin activity. J Neurosci. 2009;29:8129–42. doi: 10.1523/JNEUROSCI.4681-08.2009. [DOI] [PMC free article] [PubMed] [Google Scholar]
- 56.Luo M, Guan JL. Focal adhesion kinase: a prominent determinant in breast cancer initiation, progression and metastasis. Cancer Lett. 2010;289:127–39. doi: 10.1016/j.canlet.2009.07.005. [DOI] [PMC free article] [PubMed] [Google Scholar]
- 57.Schwock J, Dhani N, Hedley DW. Targeting focal adhesion kinase signaling in tumor growth and metastasis. Expert Opin Ther Targets. 2010;14:77–94. doi: 10.1517/14728220903460340. [DOI] [PubMed] [Google Scholar]
- 58.Zhao J, Guan JL. Signal transduction by focal adhesion kinase in cancer. Cancer Metastasis Rev. 2009;28:35–49. doi: 10.1007/s10555-008-9165-4. [DOI] [PubMed] [Google Scholar]
- 59.Garber K. Of Ephs and ephrins: companies target guidance molecules in cancer. J Natl Cancer Inst. 2010;102:1692–4. doi: 10.1093/jnci/djq479. [DOI] [PubMed] [Google Scholar]
- 60.Pfaffl MW. A new mathematical model for relative quantification in real-time RT-PCR. Nucleic Acids Res. 2001;29:e45. doi: 10.1093/nar/29.9.e45. [DOI] [PMC free article] [PubMed] [Google Scholar]
- 61.Goodwin CR, Lal B, Zhou X, Ho S, Xia S, Taeger A, et al. Cyr61 mediates hepatocyte growth factor-dependent tumor cell growth, migration, and Akt activation. Cancer Res. 2010;70:2932–41. doi: 10.1158/0008-5472.CAN-09-3570. [DOI] [PMC free article] [PubMed] [Google Scholar]
- 62.Reznik TE, Sang Y, Ma Y, Abounader R, Rosen EM, Xia S, et al. Transcription-dependent epidermal growth factor receptor activation by hepatocyte growth factor. Mol Cancer Res. 2008;6:139–50. doi: 10.1158/1541-7786.MCR-07-0236. [DOI] [PMC free article] [PubMed] [Google Scholar]
- 63.Lal B, Xia S, Abounader R, Laterra J. Targeting the c-Met pathway potentiates glioblastoma responses to gamma-radiation. Clin Cancer Res. 2005;11:4479–86. doi: 10.1158/1078-0432.CCR-05-0166. [DOI] [PubMed] [Google Scholar]
Associated Data
This section collects any data citations, data availability statements, or supplementary materials included in this article.
Supplementary Materials
A. EphB2 overexpression promotes GBM neurosphere cell invasion through matrigel-coated transwells. Cells that invaded the bottom of transwells were stained with DAPI and counted. There were 2-fold more EphB2-OVE cells than Ploc cells after 48 hours (***:P<0.001, n=6). B. EphB2 overexpression did not influence cell viability as there was no difference in trypan blue positive cells in Ploc and EphB2-OVE cultures (n=4). C. Immunoblot analysis verified EphB2 overexpression in GBM-DM140207 and neurosphere cultures from primary xenografts line Mayo 22.
Fluorescent images of GBM neurospheres transfected with EphB2 shRNA1 (EphB2KD1) or control non-silencing shRNA (NS). Both were labeled with GFP. A, C. Phase contrast pictures of GBM-neurospheres grown as neurospheres in cultures. B, D. Fluorescent pictures of NS cells and EphB2KD cells expressing GFP. Bar=100 μm. E. EdU staining (green) of NS and EphB2KD1 cells. EphB2KD1 cultures had 30% more EdU staining compared to NS. Nucleus was stained with DAPI. Bar=100 μm.
EphB2 manipulation did not change the “stemness” of GBM neurosphere cells. (A, B). RNAs were extracted from Ploc and EphB2-OVE cells. GBM stem cell marker nestin, Sox-2, and Msi-1 were detected using real-time PCR. 18S RNA expression was used as an internal control. There was no significant difference in the expression of these stem cell markers at mRNA level in Ploc and EphB2-OVE cells. The same situation was found in NS and EphB2KD1 cells, indicating that EphB2 manipulation did not change the expression of stem cell markers. (C). Western blot analysis of stem cell marker CD133 and differentiation marker GFAP in EphB2 manipulated cells. Compared to their control, EphB2 overexpression of knock-down did not change the expression of CD133 and GFAP at protein level.
(A-C). Similar dual-fluorescent approach was performed in U87 glioblastoma cells. U87 cells with EphB2 overexpression were labeled with GFP and mixed with control transfected cells that labeld with RFP. A mixture of control and EphB2 overexpressing U87 cells was implanted into mouse brain. EphB2 overexpressing U87 cells did not show increased cell migration in vivo. Bar=100 μm.
A 3D view of a xenograft reconstructed from 40 brain sections showing that control Ploc cells (red) remained mostly in the tumor core while EphB2 overexpressing cells (green) traveled further and expanded in the periphery of the tumor.
(A). The FAK inhibitor PF573228 (100 nmol/L) completely blocked FAK activation induced by 10% FCS in EphB2-OVE cells after half hour pre-incubation. (B) Ploc and EphB2-OVE cells were treated with PF573228 (100 nmol/L) or FAK inhibitor 14 (10 μmol/L) for half hour and the whole cell lysates were assayed for phosphotyrosine containing proteins by immunoblot. The phosphotyrosine levels in Ploc cells were not affected by either FAK inhibitor. The baseline phosphotyrosine levels in EphB2-OVE cells were slightly higher than that of Ploc cells, and also not affected by FAK inhibitors.