Abstract
To comprehensively grasp cell biological events in plant stomatal movement, we have captured microscopic images of guard cells with various organelles markers. The 28,530 serial optical sections of 930 pairs of Arabidopsis guard cells have been released as a new image database, named Live Images of Plant Stomata (LIPS). We visualized the average organellar distributions in guard cells using probabilistic mapping and image clustering techniques. The results indicated that actin microfilaments and endoplasmic reticulum (ER) are mainly localized to the dorsal side and connection regions of guard cells. Subtractive images of open and closed stomata showed distribution changes in intracellular structures, including the ER, during stomatal movement. Time-lapse imaging showed that similar ER distribution changes occurred during stomatal opening induced by light irradiation or femtosecond laser shots on neighboring epidermal cells, indicating that our image analysis approach has identified a novel ER relocation in stomatal opening.
Quantitative and statistical analysis of intracellular structures or dynamics from a large scale image set has become trends in cell biological study. This is because that these approaches help reducing biased information from a single or a small number of representative microscopic images. Recent improvements of high throughput microscopy encourage the trends by simplifying the acquisition of a large-scale image set. The establishment and subsequent web-release of image databases are essential steps to public use and efficient data mining from such large-scale image data sets. In the plant sciences, the 10 or so image databases that have so far been released1 can be roughly classified into two categories; a database for “protein localizome”, and a database for “cell biological dynamics”. The former group, derived from a so-called post-genomic approach, aims to determine the intracellular localization of all proteins and includes the typical FTFLP Database (http://gfp.stanford.edu/)2; GFP localizome database (http://www.psb.ugent.be/papers/cellbiol/)3; GFP database (http://data.jic.bbsrc.ac.uk/cgi-bin/gfp)4; and AtNoPDB (http://bioinf.scri.sari.ac.uk/cgi-bin/atnopdb/home/)5. The latter group was established by researchers specializing in cell biology, and includes the typical databases of Plant Cell Imaging (http://deepgreen.stanford.edu/)6; the Illuminated Plant Cell (http://www.illuminatedcell.com)7; Plant Organelles Database (http://podb.nibb.ac.jp/Organellome/)8; and the Plant Organelles World (http://podb.nibb.ac.jp/Organellome/PODBworld/en/index.html)9. These databases have highlighted the dynamics of intracellular structures in plants, and their high-resolution images have promoted a deeper understanding of cellular processes in the plant sciences, while their attractive pictures and movies have helped develop curiosity in the non-scientific community. The database is thought to have particular potential in addressing academic issues, however, there is no actual case in which a cell biological hypothesis has been formulated using an image database as far as we are aware.
Stomatal movement is an essential phenomenon for gas exchange and transpiration in higher plants, and is accomplished by significant changes in guard cell volume10. The key molecules identified in stomatal movement include photoreceptors, proton ATPase, protein kinases and ion channels, and recent studies have shown these molecules to be deeply involved in intracellular structure dynamics. For example, the potassium channel, KAT1, is selectively internalized by abscisic acid from the plasma membrane with endosomes11. On the other hand, the microtubule-binding protein, VfPIP, that was isolated as a protein interacting with the photoreceptor phototropin12, supports previous observations that cortical microtubules undergo dynamic changes to their orientations with diurnal cycles13 and in response to light conditions14. Although intracellular dynamics are thought to be important for key signal molecule functions, comprehensive cell biological studies in guard cells have not yet been conducted.
Therefore, in order to provide new insights into the mechanisms involved in stomatal movement, we have conducted a comprehensive imaging analysis, focusing on the distribution and dynamics of intracellular structures in guard cells. Our microscopic image set has now been released as the Live Images of Plant Stomata (LIPS) database and is freely available at http://hasezawa.ib.k.u-tokyo.ac.jp/lips/. To provide a new understanding of the cell biological events during stomatal movements from this database, we developed an image processing framework to quantify the behavior of the various organelles at once. Application of this framework has identified a novel ER localization changes in stomatal opening.
Results
Establishment of the LIPS database
The wild type Col-0 and 17 transgenic Arabidopsis plants were prepared as a marker set of representative plant organelles (Table 1) and their guard cells were captured by 0.5-μm-interval serial optical sections with two channels (fluorescent and bright field images) at random times during the diurnal cycle. Some fluorescent markers showed multiple localization patterns (Supplementary Fig. 1a–c, Table 1). A total of 28,530 sectional images have been designed as LIPS (Live Images of Plant Stomata) database and freely available at http://hasezawa.ib.k.u-tokyo.ac.jp/lips/. The LIPS database contains images of 50–60 pairs of guard cells in each probe, thus providing a sufficient number of images for statistical analyses. It can therefore be expected that visitors to the LIPS database will be able to obtain an integrative understanding of organellar form and distribution without being limited to only one representative image.
Table 1. List of the Arabidopsis transgenic lines used in this study.
| Fluorescent probe name | Target intracellular structures | Fluorescently tagged protein | References |
|---|---|---|---|
| HistoneH2B-RFP | Cell nuclei | Nicotiana tabacum Histone H2B2 | 44 |
| GFP-tubulin | Microtubules | Arabidopsis thaliana β-Tubulin 6 | 30 |
| GFP-EB1 | Microtubule plus-ends | Arabidopsis thaliana End binding 1 | 31 |
| GFP-ABD2 | Actin microfilaments | Actin binding domain 2 of Arabidopsis thaliana Fimbrin 1 | 15 |
| GFP-mTn | Actin microfilaments, cell nuclei | Actin binding domain of Mus musculus Talin | 32 |
| Mt-GFP | Mitochondria | Mitochondrial targeting domain of Saccharomyces cerevisiae Cytochrome c oxidase IV | 33 |
| CT-GFP | Chloroplasts | Chloroplast stroma targeting domain of Arabidopsis thaliana RecA | 34 |
| Autofluorescence in Wild type (Col-0) | Chloroplasts | - | - |
| GFP-PIP2a | Plasma membrane | Arabidopsis thaliana Plasma mambrane intrinsic protein (PIP) 2a | 6 |
| GFP-ER | Endoplasmic reticulum | C-terminal HDEL (Endoplasmic reticulum retention signal) sequence | 35 |
| YFP-inserted MFP2 | Peroxisomes | Arabidopsis thaliana Multifunctional protein (MFP) 2 | 39 |
| ARA6-GFP | Endosomes | Arabidopsis thaliana Rab isoform (ARA) 6 | 36 |
| GFP-VAMP727 | Endosomes | Arabidopsis thaliana Vesicle-associated membrane protein (VAMP) 727 | 17 |
| ERD2-GFP | cis-Golgi, ER | Arabidopsis thaliana ER retention defective (ERD) 2 | 37, 41 |
| XYLT-YFP | medial-Golgi | N-terminus of Arabidopsis thaliana β(1,2)-xylosyltransferase (XYLT) | 45 |
| ST-mRFP | trans-Golgi, vacuoles, apoplast | N-terminus of Rattus norvegicus α(2,6)-sialyltransferase (ST) | 40 |
| GFP-VAM3 | Vacuolar membrane | Arabidopsis thaliana Syntaxin of plant (SYP) 22/Vacuolar morphology (VAM) 3 | 38 |
| GFP-δTIP | Vacuolar membrane, ER | Arabidopsis thaliana δ-Tonoplast intrinsic protein (TIP) | 6 |
Probabilistic mapping to visualize average distributions of the organelles in guard cells
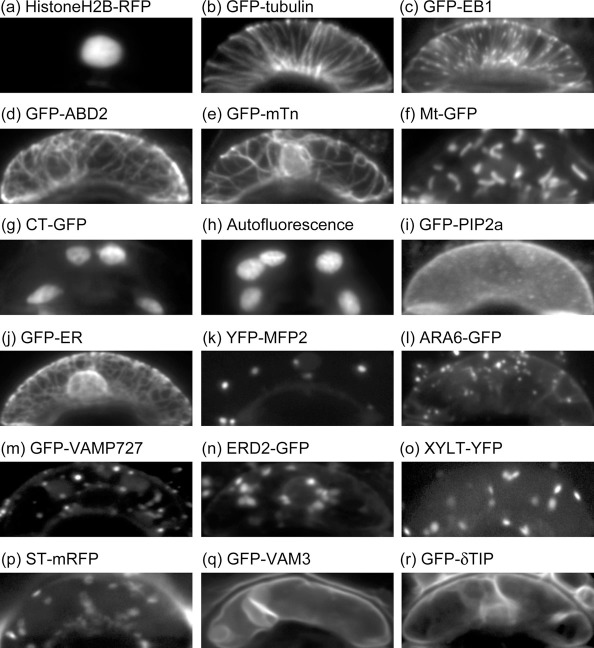
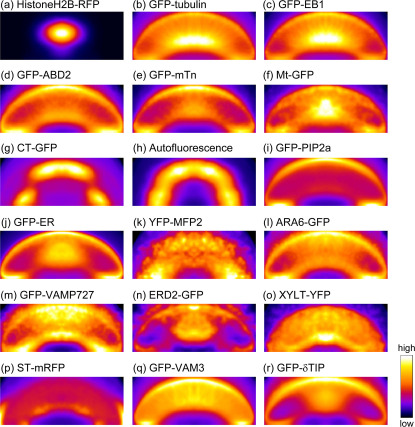
Guard cells have the dorsal-ventral polarity that deeply involves in stomatal movement. Therefore it is valuable to reveal the organelle locations for understanding its function in stomatal movement. However, a single microscopic snapshot is not enough to grasp an overall trend of the organelle localizations (Fig. 1). To overcome this problem, we visualized localization trends of each intracellular structure with probabilistic mapping techniques to average the localization information from the LIPS database (Fig. 2). The following is the image processing scheme developed in this study. First, the guard cell region was manually segmented with a bounding box (Supplementary Fig. 2a, b). All of the segmented image sizes were then normalized into a mean size of 304×119 pixels (19.5 × 7.6 μm), with their fluorescent intensities also normalized to an average intensity of 0 with a standard derivation of 1 (Fig. 1, Supplementary Fig. 2c). Thereafter, group-averaged images were obtained for 100–120 guard cells (Supplementary Fig. 2d). For the 18 probes used in this study, the intracellular structure distributions were found to be symmetrical with respect to the guard cell major axis (Supplementary Fig. 3), and so we were able to divide the group-averaged guard cells in the middle and then again average the half-separated cell images (Supplementary Fig. 2e, f). Finally, we were able to derive the probabilistic maps in which higher intensities represented higher intracellular localization probabilities (Fig. 2).
Figure 1. Shape-normalized cell images in Arabidopsis guard cells.
(a) Cell nuclei labeled by HistoneH2B-RFP. (b) Microtubules labeled by GFP-tubulin. (c) Microtubule plus-ends labeled by GFP-EB1. (d, e) Actin microfilaments labeled by GFP-ABD2 (d) and GFP-mTn (e). (f) Mitochondria labeled by Mt-GFP. (g, h) Chloroplasts labeled by CT-GFP (g) and autofluorescence (h). (i) Plasma membrane labeled by GFP-PIP2a. (j) Endoplasmic reticulum labeled by GFP-ER. (k) Peroxisomes labeled by YFP-MFP2. (l, m) Endosomes labeled by ARA6-GFP (l) and GFP-VAMP727 (m). (n) cis-Golgi labeled by ERD2-GFP. (o) medial-Golgi labeled by XYLT-YFP. (p) trans-Golgi labeled by ST-mRFP. (q, r) Vacuolar membranes labeled by GFP-VAM3 (q) and GFP-δTIP (r). All of the image sizes were normalized into a mean size of 304×119 pixels (19.5×7.6 μm).
Figure 2. Probability maps of the intracellular structures in guard cells.
(a) Cell nuclei labeled by HistoneH2B-RFP. (b) Microtubules labeled by GFP-tubulin. (c) Microtubule plus-end labeled by GFP-EB1. (d, e) Actin microfilaments labeled by GFP-ABD2 (d) and GFP-mTn (e). (f) Mitochondria labeled by Mt-GFP. (g, h) Chloroplasts labeled by CT-GFP (g) and autofluorescence (h). (i) Plasma membrane labeled by GFP-PIP2a. (j) Endoplasmic reticulum labeled by GFP-ER. (k) Peroxisomes labeled by YFP-MFP2. (l, m) Endosomes labeled by ARA6-GFP (l) and GFP-VAMP727 (m). (n) cis-Golgi labeled by ERD2-GFP. (o) medial-Golgi labeled by XYLT-YFP. (p) trans-Golgi labeled by ST-mRFP. (q, r) Vacuolar membranes labeled by GFP-VAM3 (q) and GFP-δTIP (r). These maps were obtained from group-averaged images from 100–120 guard cells, and are shown in pseudocolor. All of the image sizes were normalized into a mean size of 304×119 pixels (19.5×7.6 μm).
Clustering analysis of the organelle probabilistic maps
Whereas the probabilistic maps of the actin microfilaments markers GFP-ABD2 and GFP-mTn were similar in appearance (Fig. 2d, e), the chloroplast autofluorescence and CT-GFP maps showed some differences in their patterns (Fig. 2g, h). We consider that this was because the numbers of chloroplasts in guard cells were slightly reduced in the CT-GFP expression line compared with wild type (Supplementary Fig. 1d). The probabilistic map of chloroplast autofluorescence in CT-GFP expression line showed similar patterns to that of CT-GFP (Supplementary Fig. 1e).
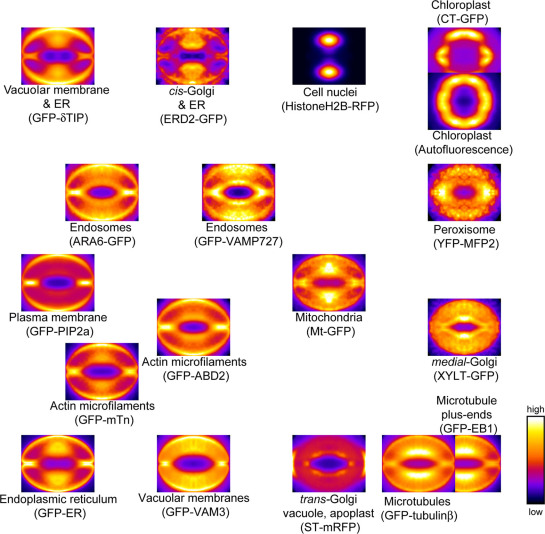
To objectively estimate such distribution differences of intracellular structures within the overall framework, we subsequently performed microscopic image clustering analysis15. As metrics to evaluate the intracellular localizations, we used raster-scanned intensity profiles in the probability maps (Supplementary Fig. 4). The three different clustering methods used, namely principle component analysis (PCA) (Supplementary Fig. 5a), hierarchical clustering (Supplementary Fig. 5b) and self-organizing map (SOM) (Fig. 3), all showed similar distributions. Nearby residents of the different probes, but similar targeting structures, including microtubules (GFP-tubulinβ vs. GFP-EB1), chloroplasts (Autofluorescence vs. CT-GFP), actin microfilaments (GFP-ABD2 vs. GFP-mTn), and endosomes (ARA6-GFP vs. GFP-VAMP727) verified the validity of the metric patterns used in this study (Fig. 3). In the dendrogram, actin microfilaments markers GFP-ABD2 and GFP-mTn appeared in different clades (Supplementary Fig. 5b). It might be because GFP-mTn fluorescence leaked into cell nuclei (Supplementary Fig. 1c). The SOM also showed near location of the multiple organelle markers GFP-δTIP and ERD2-GFP, in which the ER was commonly labeled (Fig. 3). This clustering analysis thus successfully provided an overall picture of structural locations within guard cells, with medial-Golgi and microtubules being located to the ventral side (Fig. 3, lower right portion of the SOM) and actin microfilaments and ER located to the dorsal side and connecting regions (Fig. 3, lower left portion of the SOM).
Figure 3. Clustering of probability maps for each probe.
Self-organizing map (SOM) of the 18 probability maps. The SOM was produced based on raster-scanned intensity profiles (Supplementary Fig. 4). Note that mitochondria, medial-Golgi and microtubules are mainly localized to the ventral side (lower right portion of the SOM), whereas endosomes, actin microfilaments, and the endoplasmic reticulum (ER) are mainly localized to the dorsal side (left portion of the SOM). The images are shown in pseudocloar. All of the image sizes were normalized into a mean size of 304×238 pixels (19.5×15.2 μm).
Detection of detailed localization differences between ARA6-GFP and GFP-VAMP727
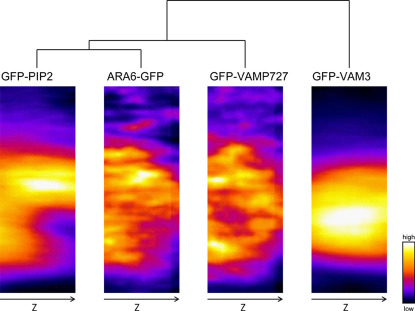
The endosomal markers ARA6-GFP and GFP-VAMP727 labeled dot-like endosomal components, and recent studies have shown that ARA6 is mainly involved in endosome-plasma membrane trafficking16, whereas VAMP727 acts in both endosome-plasma membrane and endosome-vacuolar membrane trafficking16,17. Image clustering in this study showed that ARA6-GFP was more closely located to the plasma membrane marker GFP-PIP2a than to GFP-VAMP727 (Fig. 3, Supplementary Fig. 5a). The similar patterns of ARA6-GFP and GFP-PIP2a were more clearly demonstrated not only by clustering of XY sections but also by YZ sections (Fig. 4, Supplementary Fig. 6c, d), which were generated via Z-axis registration using the cross-point of bright field images (Supplementary Fig. 6a, b).
Figure 4. Clustering of the probability maps of YZ sections of GFP-PIP2a, ARA6-GFP, GFP-VAMP727 and GFP-VAM3.
We performed Z-axis registration using the cross-point in the bright field YZ sections (see Supplementary Fig. 6a, b). To facilitate GFP visualization, images are presented in pseudo-color. These maps were obtained from group-averaged images from 100–120 guard cells. All of the image sizes were normalized into a mean size of 73×200 pixels (4.67×12.8 μm). The dendrogram was produced based on raster-scanned intensity profiles (Supplementary Fig. 4) with Euclidean distance and Word's algorithm. Note that the image of ARA6-GFP is more similar to GFP-PIP2a than to GFP-VAMP727, which appears to be located around the vacuolar membrane as shown by GFP-VAM3.
Changes in organelle distributions during stomatal movements
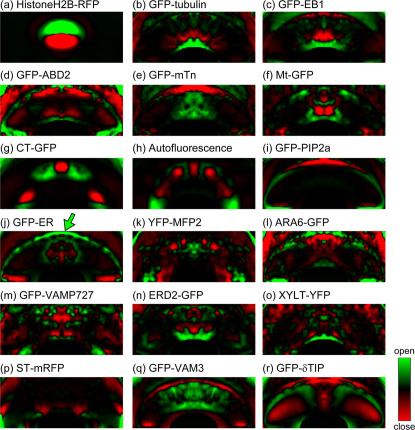
We subsequently visualized intracellular localization changes during stomatal movements using subtractive images of the probability map in open and closed stomata. Although some transgenic plants, including lines expressing GFP-mTn, showed slightly decreased mean stomatal apertures as previously reported15,18, all the transgenic plants generally showed differences in stomatal aperture, suggesting some degree of variation in their ability for stomatal movement (Supplementary Fig. 7). We first manually determined the apertures of all 930 stomata, which are also available in the LIPS database, and collected the top 30% (defined as opened stomata) and bottom 30% (defined as closed stomata) images. We then obtained the subtractive images of the probability map of open and closed stomata with registration by affine transformation (Supplementary Fig. 8, 9, 10), and finally visualized the comprehensive intracellular structural changes at their localizations during stomatal movement (Fig. 5). Noteworthy changes included highly condensed microtubules in the ventral pore edge side of opened stomata (Fig. 5b, c). This localization of microtubules was suggestive of their polymerization from the pore edge regions when stomata opened. More interestingly, we found that the ER was located to the connecting region when stomata closed and in the dorsal side when stomata opened (Fig. 5j, arrow).
Figure 5. Subtractive images of probability maps of the top 30% and bottom 30% of stomatal apertures.
Green and red colors show the most prominent localizations in opened and closed stomata, respectively. (a) Cell nuclei labeled by HistoneH2B-RFP. (b) Microtubules labeled by GFP-tubulin. (c) Microtubule plus-end labeled by GFP-EB1. (d, e) Actin microfilaments labeled by GFP-ABD2 (d) and GFP-mTn (e). (f) Mitochondria labeled by Mt-GFP. (g, h) Chloroplasts labeled by CT-GFP (g) and autofluorescence (h). (i) Plasma membrane labeled by GFP-PIP2a. (j) Endoplasmic reticulum labeled by GFP-ER. (k) Peroxisomes labeled by YFP-MFP2. (l, m) Endosomes labeled by ARA6-GFP (l) and GFP-VAMP727 (m). (n) cis-Golgi labeled by ERD2-GFP. (o) medial-Golgi labeled by XYLT-YFP. (p) trans-Golgi labeled by ST-mRFP. (q, r) Vacuolar membranes labeled by GFP-VAM3 (q) and GFP-δTIP (r). These subtractive images were obtained from 60-72 guard cell images, and are shown in pseudocolor. These maps were obtained from group-averaged images from 60–72 guard cells. All of the image sizes were normalized into a mean size of 303×128 pixels (19.4×8.2 μm). Note that localization of GFP-ER increased in dorsal side of guard cells of open stomata (arrow).
Direct observations of ER distribution changes during stomatal opening
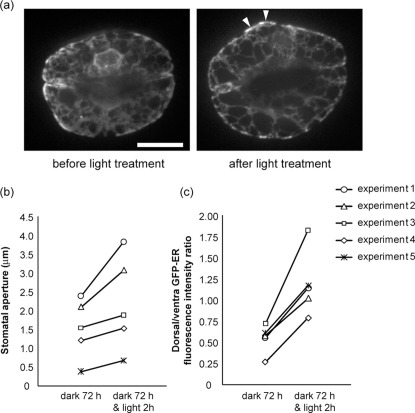
Compared with cytoskeletons in guard cells13,14,15, little is known about ER distribution changes during stomatal movement. To verify the ER dynamics that we found through image database analysis (Fig. 5j, arrow), we performed time-lapse imaging on GFP-ER during light-induced stomatal opening. We first captured the three-dimensional images of the ER in guard cells of closed stomata after 72 hours of dark treatment (Fig. 6a, before light treatment), before the guard cells were treated with 200 μmol m−2s−1 white light treatment under microscopy. After 2 hours of light treatment, the stomata opened (Fig. 6a, b) and the three-dimensional images of the ER were recaptured (Fig. 6a, after light treatment). During light-induced stomatal opening, the GFP-ER fluorescence intensity increased on the dorsal side (Fig. 6a, arrowheads). Measurement of the dorsal/ventral fluorescence intensity ratio indicated that GFP-ER relocated to the dorsal side (Fig. 6c, Supplementary Fig. 11), suggestive of ER accumulation in the dorsal side during stomatal opening.
Figure 6. Changes in ER distribution during light-induced stomatal opening.
(a) Time-lapse images of GFP-ER in guard cells. The guard cells were dark-treated for 72 hours (before light treatment) and then irradiated with 200 μmol m−2s−1 white light for 2 hours (after light treatment). Note that GFP-ER became much in the dorsal side after light treatment (arrowheads). Scale bar indicates 10 μm. (b) Changes in stomatal aperture before and after the 2 hour white light treatment. (c) Changes in the dorsal/ventral GFP-fluorescence intensity ratios before and after light treatment. We measured the mean intensities of the line along the dorsal and ventral side (Supplementary Fig. 11). Results from five pairs of guard cells are shown.
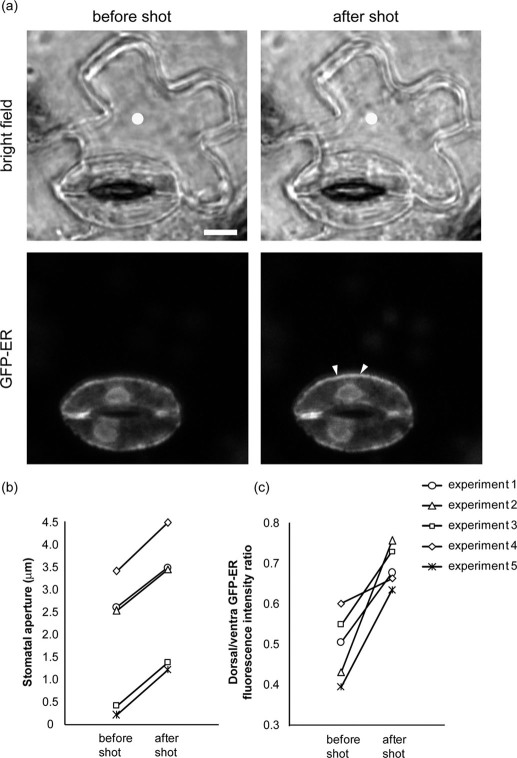
To further understand ER dynamics during stomatal movement, we performed cell manipulation experiments by micro-perforation using a focused femtosecond laser. As the pushing force from neighboring epidermal cells on guard cells is a key factor regulating stomatal movement, we attempted to perforate the neighboring epidermal cells and reduce the pushing force by focusing an intense femtosecond laser pulse train through the objective lens. The ultrashort infrared laser pulse (150 fs, 800 nm) induces laser ablation and results in multiphoton absorption at the laser focal point19. When the laser pulse was focused on the surface of epidermal cells, the nearest stoma opened with shrinkage of the targeted epidermal cells (Fig. 7a, b). Immediately after the laser-induced stomatal opening, the fluorescence intensity of GFP-ER increased at the dorsal side (Fig. 7c), similar to light-induced stomatal opening (Fig. 6). The very quick localization changes suggested responding to mechanical stress associated with stomatal opening.
Figure 7. Stomatal opening and ER dynamics induced by femtosecond laser micro-perforation.
(a) The bright field and GFP-ER fluorescence images in guard cells before and after laser perforation. Laser focal points are indicated as yellow dots. Note that GFP-ER localization increased in stomatal opening (arrowheads). Scale bar indicates 10 μm. (b) Changes in stomatal aperture before and after the laser perforation. (c) Changes in the dorsal/ventral GFP-fluorescence intensity ratios before and after a femtosecond laser shot. We measured the mean intensities of the line along the dorsal and ventral side (Supplementary Fig. 11). Results from five pairs of guard cells are shown.
Discussion
In this study, we have established a new microscopic image database of Arabidopsis guard cells, which we refer to as LIPS. Although the LIPS database may be considered a type of cell biological image database, it can be distinguished from existing plant image databases by the following features. First, we focused on only one specific cell type, namely guard cells and, as far as we are aware, no image database focusing on a particular cell type exists in the plant sciences. Guard cells are attractive targets not only because of their importance for gas exchange and transpiration in higher plants, but also because of the ease by which their proteins can be localized. Second, we standardized the kinds and settings of microscopy used. Although image acquisition conditions are frequently standardized in image databases for protein localizomes, conditions are generally not standardized for cell biological image databases because the emphasis is on organellar shapes and movements, and observation with different magnifications is to be expected. Furthermore, in the case of a collective image database from numerous researchers, such as the Plant Organelle Database8, it is almost impossible to use the same types of microscopy. Finally, the LIPS database contains images of 50–60 pairs of guard cells in each probe, thus providing a sufficient number of images for statistical analyses. It can therefore be expected that visitors to the LIPS database will be able to obtain an integrative understanding of organellar form and distribution without being limited to only one representative image. This series of features allowed us to perform data mining of organellar localization through simple probabilistic mapping techniques.
To visualize average distributions of the organelles, we introduced an image analysis pipeline combined with probabilistic mapping and image clustering. In the analysis of a magnetic resonance image (MRI), probabilistic mapping has proved useful for measuring specific brain region volume20, visualizing neural activation21, and determining the orientation of white matter fibers22. In principle, probabilistic maps provide a powerful means of visualizing cell biological phenomena, such as organellar distribution. However, normalization of cell shapes and size are often a bottle-neck for practical use. In cultured animal cells, fibronectin micropatterns, which enforce cells to take a certain shape and prevent their migration, were developed to normalize cell shapes23,24,25. The resulting probabilistic map, with shape-normalized cells, has been useful for quantitatively understanding the distribution of actin stress fiber23 and endomembrane organization24. Although controlling the shape and size of plant cells is technically difficult, mature guard cells fortunately show less individual size and shape variations, and we were able to successfully exploit this characteristic to perform spatial normalization by simple image processing.
Clustering of probabilistic maps allowed visualization and quantification of organelle distribution similarities (Fig. 3, 4, Supplementary Fig. 5, 6c, d). We previously introduced image metrics specialized for cytoskeletal organization and image clustering methods using GFP-ABD2-labelled guard cell actin microfilaments15. In this study, we introduced new intensity profiles that have a broad utility for various intracellular structures as metrics for distribution patterns (Supplementary Fig. 4). We were thus able to detect detailed differences between ARA6-GFP and GFP-VAMP727 localization, with ARA6-GFP localization being more similar to the plasma membrane marker, GFP-PIP2a (Fig. 4). ARA6 is a plant-unique RAB5 member that acts in endosome-to-plasma membrane trafficking while VAMP727 executes membrane fusion at both vacuoles and the plasma membrane16. Thus our results clearly demonstrate the potential of our image analysis approach to detect the differences in molecular properties of specific proteins.
Our analysis using image subtraction favors the hypothesis that microtubules appear from the ventral side and reorganize into a radial orientation during stomatal opening as previously reported13,14. A component of the microtubule organization center (MTOC), γ-tubulin, is localized adjacent to the ventral cell wall26, and microtubule plus-ends grow outward from the ventral side27, supporting the view that cortical microtubules become radially reorganized by growing from the MTOC beneath the ventral cell wall in stomatal opening. In addition, our analysis also demonstrated possible changes in ER distribution during stomatal movement. Time-lapse imaging directly visualized the hypothetic ER accumulation during stomatal opening (Fig. 6, 7). Although, the significance of the ER distributions on stomatal movement are unclear at present, it is likely that these structures are intimately involved in the turnover of guard cell membrane proteins that regulate stomatal movement via membrane trafficking. For example, ER-localized phospholipase A2β-mediated hydrolysis products have been suggested to move to the plasma membrane and activate proton ATPase in light-induced stomatal opening28. Alternatively, such ER accumulation may be some form of cellular mechanical response. It has been reported that pressure from a microneedle on the epidermal cell surface induces rapid ER accumulation29. In the case of our femtosecond laser micro-perforation experiments, the suction force of the neighboring epidermal cells would suddenly be eliminated, and the guard cells would then be forced to swell up and to increase their tension forces, especially on the dorsal side. Future studies will clarify the significance of the organellar distribution changes during stomatal movement.
Methods
Plant materials and growth conditions
The transgenic lines used in this study were listed in Table 1. Seeds of transgenic Arabidopsis were kindly provided by Drs Minami Matsui (HistoneH2B-RFP); Takashi Hashimoto (GFP-tubulin30); Jaideep Mathur (GFP-AtEB131); Miyo Terao-Morita and Masao Tasaka (GFP-mTn32); Andreas Nebenfuhr (Mt-GFP33 (CS16263)); Maureen Hanson (CT-GFP34); David W. Ehrhardt (GFP-PIP2a6 (CS84725); GFP-δTIP6 (CS84727)); Scott Poethig (GFP-ER35, E1728 (CS70123)); Takashi Ueda (ARA6-GFP36, GFP-VAMP72717, ERD2-GFP37, XYLT-YFP, ST-mRFP); Masa H Sato (GFP-VAM338); and the FTFLP Consortium (YFP-inserted MFP239 (CS37004)). ST-mRFP labels not only Golgi bodies but the excess is also localized to vacuoles and the apoplast40. Furthermore, ERD2-GFP and GFP-δTIP not only label Golgi bodies and the vacuolar membrane, respectively, but their excess is localized to the ER41,42. Arabidopsis plants were grown on soil-vermiculite, as described by Naito et al. (1994)43, in growth chambers set at 23.5°C, a 60% relative humidity, and a 12/12-hour light/dark cycle using 100 µmol m−2s−1 white lights. Fully-expanded rosette leaves of 4- to 5-week-old plants were used for image acquisition.
Microscopic image acquisition and analysis
To capture stomatal images, The abaxial epidermis was peeled off and floated, with its inner surface facing down, on a glass slide covered with basal buffer [50 mM KCl, 5 mM 2-(N-morpholine)-ethanesulphonic acid (MES)-Tris, pH 6.5, and 10 mM CaCl2], and then covered by a cover glass (Matsunami, Osaka, Japan). The slide glass was placed onto the inverted platform of a fluorescence microscope (IX70, Olympus) equipped with an UplanApo 100x/1.35 oil iris objective lens and a CSU10 scanning head (Yokogawa, Tokyo, Japan) together with a cooled CCD camera head system (CoolSNAP HQ, PhotoMetrics). At image acquisition, pixel width (0.064 µm) and step size for three-dimensional imaging (0.5 µm) were fixed. Image processing was performed using ImageJ (http://rsbweb.nih.gov/ij/) with our original JAVA plug-in package (http://hasezawa.ib.k.u-tokyo.ac.jp/zp/Kbi/) and ImageJ macro (http://hasezawa.ib.k.u-tokyo.ac.jp/zp/Kbi/HigPDMClustering). Intensity normalization was performed by the “avg0sd1” mode of KbiStkFilter plug-in. The probability map images were generated by the ImageJ macro hig_Pdmapping.ijm. The raster-scanned intensity profiles were measured by the ImageJ macro hig_Lineprofile.ijm. SOM clustering was performed by the “som” mode of KbiClustering plug-in. The affine transformation was performed with Abobe Photoshop CS4. PCA analysis and hierarchical clustering were performed using MINITAB (Minitab Inc., http://www.minitab.com).
Time-lapse observations of light-induced stomatal opening
The seven-day seedlings were transferred onto a cover glass (Matsunami) and placed onto the inverted platform of a microscope with a CSU10 scanning head (Yokogawa). To prevent drying, 3 mm-thick 1% agarose gel with basal buffer was placed onto the seedling. For light treatment, the seedlings were irradiated with 200 μmol m−2s−1 white light for 2 hours.
Experimental setup of the femtosecond laser irradiation
Femtosecond laser pulses from a regeneratively amplified Ti:sapphire femtosecond laser system (Spectra-Physics, Hurricane, 800 nm, 150 femtoseconds, 1 kHz) were introduced to an inverted microscope (IX71, Olympus) with a FV300 laser scanning confocal system (Olympus), and focused onto the peeled epidermal cells through a 40× objective lens (UMPlanFI, 0.75 NA, Olympus). The 125 pulse repetitions were detected with a mechanical shutter (gate time 1/8 sec.) and delivered to a fixed point on the sample. The laser pulse energy was tuned by a half-wavelength (λ/2) plate and dual polarizers. Laser pulses were collimated by dual convex lenses before the microscope, and the laser focal point was tuned to the plane of the image on the microscope. The laser pulse energy through the objective was measured by attaching a laser power meter (ORIEL, model AN/2) to the objective and was tuned to be 70 nJ/pulse.
Author Contributions
T.H. designed and performed experiments, analyzed and wrote the paper. N.K. developed the ImageJ plug-ins. Y.H. developed femtosecond laser irradiation system. K.A. observed Golgi markers. K.E. and T.U. established endosomes and Golgi markers, and contributed through discussion and revision of the paper. N.K. and S.H. supervised this project. All authors reviewed the manuscript.
Supplementary Material
Supplementary information
Acknowledgments
The authors thank the ABRC for providing seeds of transgenic Arabidopsis lines. We also thank Dr. Sachihiro Matsunaga of Tokyo University of Science for advice on the cell manipulation experiments. This work was financially supported in part by a Grant-in-Aid for Scientific Research on Priority Areas to S.H. (No. 23012009), by a Grant-in-Aid for Scientific Research on Innovative Areas to S.H. (No. 22114505), by a Grant-in-Aid for Young Scientists (B) to N.K. (No. 24770038), by a Grant-in-Aid for Research Activity start-up to T.H. (No. 22870004) from the Japanese Ministry of Education, Science, Culture, Sports and Technology, and an Advanced Measurement and Analysis grant from the Japan Science and Technology Agency (JST) to S.H.
References
- Mano S., Miwa T., Nishikawa S., Mimura T. & Nishimura M. Seeing is believing: on the use of image databases for visually exploring plant organelle dynamics. Plant Cell Physiol. 50, 2000–2014 (2009). [DOI] [PubMed] [Google Scholar]
- Li S., Ehrhardt D. W. & Rhee S. Y. Systematic analysis of Arabidopsis organelles and a protein localization database for facilitating fluorescent tagging of full-length Arabidopsis proteins. Plant Physiol. 141, 527–539 (2006). [DOI] [PMC free article] [PubMed] [Google Scholar]
- Van Damme D., Bouget F. Y., Van Poucke K., Inze D. & Geelen D. Molecular dissection of plant cytokinesis and phragmoplast structure: a survey of GFP-tagged proteins. Plant J. 40, 386–398 (2004). [DOI] [PubMed] [Google Scholar]
- Koroleva O. A., Tomlinson M. L., Leader D., Shaw P. & Doonan J. H. High-throughput protein localization in Arabidopsis using Agrobacterium-mediated transient expression of GFP-ORF fusions. Plant J. 41, 162–174 (2005). [DOI] [PubMed] [Google Scholar]
- Brown J. W., Shaw P. J., Shaw P. & Marshall D. F. Arabidopsis nucleolar protein database (AtNoPDB). Nucleic Acids Res. 33, D633–D636 (2005). [DOI] [PMC free article] [PubMed] [Google Scholar]
- Cutler S. R., Ehrhardt D. W., Griffitts J. S. & Somerville C. R. Random GFP::cDNA fusions enable visualization of subcellular structures in cells of Arabidopsis at a high frequency. Proc Natl Acad Sci U S A. 97, 3718–3723 (2000). [DOI] [PMC free article] [PubMed] [Google Scholar]
- Mathur J. The illuminated plant cell. Trends Plant Sci. 12, 506–513 (2007). [DOI] [PubMed] [Google Scholar]
- Mano S., Miwa T., Nishikawa S., Mimura T. & Nishimura M. The plant organelles database (PODB): a collection of visualized plant organelles and protocols for plant organelle research. Nucleic Acids Res. 36, D929–937 (2008). [DOI] [PMC free article] [PubMed] [Google Scholar]
- Mano S., Miwa T., Nishikawa S., Mimura T. & Nishimura M. The Plant Organelles Database 2 (PODB2): an updated resource containing movie data of plant organelle dynamics. Plant Cell Physiol. 52, 244–253 (2011). [DOI] [PMC free article] [PubMed] [Google Scholar]
- Meckel T., Gall L., Semrau S., Homann U. & Thiel G. Guard cells elongate: relationship of volume and surface area during stomatal movement. Biophys J. 92, 1072–1080 (2007). [DOI] [PMC free article] [PubMed] [Google Scholar]
- Sutter J. U. et al. Abscisic acid triggers the endocytosis of the arabidopsis KAT1 K+ channel and its recycling to the plasma membrane. Curr Biol. 17, 1396–1402 (2007). [DOI] [PubMed] [Google Scholar]
- Emi T., Kinoshita T., Sakamoto K., Mineyuki Y. & Shimazaki K. Isolation of a protein interacting with Vfphot1a in guard cells of Vicia faba. Plant Physiol. 138, 1615–1626 (2005). [DOI] [PMC free article] [PubMed] [Google Scholar]
- Fukuda M., Hasezawa S., Asai N., Nakajima N. & Kondo N. Dynamic organization of microtubules in guard cells of Viciafaba L. with diurnal cycle. Plant Cell Physiol. 39, 80–86 (1998). [DOI] [PubMed] [Google Scholar]
- Lahav M., Abu-Abied M., Belausov E., Schwartz A. & Sadot E. Microtubules of guard cells are light sensitive. Plant Cell Physiol. 45, 573–582 (2004). [DOI] [PubMed] [Google Scholar]
- Higaki T., Kutsuna N., Sano T., Kondo N. & Hasezawa S. Quantification and cluster analysis of actin cytoskeletal structures in plant cells: role of actin bundling in stomatal movement during diurnal cycles in Arabidopsis guard cells. Plant J. 61, 156–165 (2010). [DOI] [PubMed] [Google Scholar]
- Ebine K. et al. A membrane trafficking pathway regulated by the plant-specific RAB GTPase ARA6. Nat. Cell Biol. 12, 853–859 (2011). [DOI] [PubMed] [Google Scholar]
- Ebine K. et al. A SNARE complex unique to seed plants is required for protein storage vacuole biogenesis and seed development of Arabidopsis thaliana. Plant Cell 20, 3006–3021 (2008). [DOI] [PMC free article] [PubMed] [Google Scholar]
- Higaki T., Kojo K. H. & Hasezawa S. Critical role of actin bundling in plant cell morphogenesis. Plant Signal Behav. 5, 484–488 (2010). [DOI] [PMC free article] [PubMed] [Google Scholar]
- Hosokawa Y., Ochi H., Iino T., Hiraoka A. & Tanaka M. Photoporation of biomolecules into single cells in living vertebrate embryos induced by a femtosecond laser amplifier. PLoS ONE 6, e27677 (2011). [DOI] [PMC free article] [PubMed] [Google Scholar]
- Penhune V. B., Zatorre R. J., MacDonald J. D. & Evans A. C. Interhemispheric anatomical differences in human primary auditory cortex: probabilistic mapping and volume measurement from magnetic resonance scans. Cereb Cortex 6, 661–672 (1996). [DOI] [PubMed] [Google Scholar]
- McCarthy G., Luby M., Gore J. & Goldman-Rakic P. Infrequent events transiently activate human prefrontal and parietal cortex as measured by functional MRI. J Neurophysiol. 77, 1630–1634 (1997). [DOI] [PubMed] [Google Scholar]
- Jones D. K. et al. Spatial normalization and averaging of diffusion tensor MRI data sets. Neuroimage 17, 592–617 (2002). [PubMed] [Google Scholar]
- Théry M., Pépin A., Dressaire E., Chen Y. & Bornens M. Cell distribution of stress fibres in response to the geometry of the adhesive environment. Cell Motil. Cytoskeleton 63, 341–355 (2006). [DOI] [PubMed] [Google Scholar]
- Schauer K. et al. Probabilistic density maps to study global endomembrane organization. Nat. Methods, 7, 560–566 (2010). [DOI] [PubMed] [Google Scholar]
- Degot S. et al. Improved visualization and quantitative analysis of drug effects using micropatterned cells. J. Vis. Exp. 10.3791/2514 (2010). [DOI] [PMC free article] [PubMed] [Google Scholar]
- McDonald A. R., Liu B., Joshi H. C. & Palevitz B. A. Gamma-tubulin is associated with a cortical-microtubule-organizing zone in the developing guard cells of Allium cepa L. Planta. 191, 357–361 (1993). [DOI] [PubMed]
- Yao M., Wakamatsu Y., Itoh T. J., Shoji T. & Hashimoto T. Arabidopsis SPIRAL2 promotes uninterrupted microtubule growth by suppressing the pause state of microtubule dynamics. J Cell Sci. 121, 2372–2381 (2008). [DOI] [PubMed] [Google Scholar]
- Seo J. et al. Phospholipase A2beta mediates light-induced stomatal opening in Arabidopsis. J Exp Bot. 59, 3587–3594 (2008). [DOI] [PMC free article] [PubMed] [Google Scholar]
- Hardham A. R., Takemoto D. & White R. G. Rapid and dynamic subcellular reorganization following mechanical stimulation of Arabidopsis epidermal cells mimics responses to fungal and oomycete attack. BMC Plant Biol. 8, 63 (2008). [DOI] [PMC free article] [PubMed] [Google Scholar]
- Abe T. & Hashimoto T. Altered microtubule dynamics by expression of modified alpha-tubulin protein causes right-handed helical growth in transgenic Arabidopsis plants. Plant J. 43, 191–204 (2005). [DOI] [PubMed] [Google Scholar]
- Mathur J., Mathur N., Kernebeck B., Srinivas B. P. & Hulskamp M. A novel localization pattern for an EB1-like protein links microtubule dynamics to endomembrane organization. Curr Biol. 13, 1991–1997 (2003). [DOI] [PubMed] [Google Scholar]
- Saito C., Morita M. T., Kato T. & Tasaka M. Amyloplasts and vacuolar membrane dynamics in the living graviperceptive cell of the Arabidopsis inflorescence stem. Plant Cell, 17, 548–558 (2005). [DOI] [PMC free article] [PubMed] [Google Scholar]
- Nelson B. K., Cai X. & Nebenfuhr A. A multicolored set of in vivo organelle markers for co-localization studies in Arabidopsis and other plants. Plant J. 51, 1126–1136 (2007). [DOI] [PubMed] [Google Scholar]
- Holzinger A., Buchner O., Lutz C. & Hanson M. R. Temperature-sensitive formation of chloroplast protrusions and stromules in mesophyll cells of Arabidopsis thaliana. Protoplasma 230, 23–30 (2007). [DOI] [PubMed] [Google Scholar]
- Gardner M. J. et al. GAL4 GFP enhancer trap lines for analysis of stomatal guard cell development and gene expression. .J Exp Bot. 60, 213–226 (2009). [DOI] [PMC free article] [PubMed] [Google Scholar]
- Goh T. et al. VPS9a, the common activator for two distinct types of Rab5 GTPases, is essential for the development of Arabidopsis thaliana. Plant Cell 19, 3504–3515 (2007). [DOI] [PMC free article] [PubMed] [Google Scholar]
- Takeuchi M., Ueda T., Yahara N. & Nakano A. Arf1 GTPase plays roles in the protein traffic between the endoplasmic reticulum and the Golgi apparatus in tobacco and Arabidopsis cultured cells. Plant J. 31, 499–515 (2002). [DOI] [PubMed] [Google Scholar]
- Uemura T. et al. Systematic analysis of SNARE molecules in Arabidopsis: dissection of the post-Golgi network in plant cells. Cell Struct Funct. 29, 49–65 (2004). [DOI] [PubMed] [Google Scholar]
- Tian G. W. et al. High-throughput fluorescent tagging of full-length Arabidopsis gene products in planta. Plant Physiol. 135, 25–38 (2004). [DOI] [PMC free article] [PubMed] [Google Scholar]
- Robinson D. G., Langhans M., Saint-Jore-Dupas C. & Hawes C. BFA effects are tissue and not just plant specific. Trends Plant Sci. 13, 405–408 (2008). [DOI] [PubMed] [Google Scholar]
- Boevink P. et al. Stacks on tracks: the plant Golgi apparatus traffics on an actin/ER network. Plant J. 15, 441–447 (1998). [DOI] [PubMed] [Google Scholar]
- Wu G., Otegui M. S. & Spalding E. P. The ER-localized TWD1 immunophilin is necessary for localization of multidrug resistance-like proteins required for polar auxin transport in Arabidopsis roots. Plant Cell 22, 3295–3304 (2010). [DOI] [PMC free article] [PubMed] [Google Scholar]
- Naito S., Hirai M. Y., Chino M. & Komeda Y. Expression of a soybean (Glycine max [L.] Merr.) seed storage protein gene in transgenic Arabidopsis thaliana and its response to nutritional stress and to abscisic acid mutations. Plant Physiol. 104, 497–503 (1994). [DOI] [PMC free article] [PubMed] [Google Scholar]
- Hayashi T., Sano T., Kutsuna N., Kumagai-Sano F. & Hasezawa S. Contribution of anaphase B to chromosome separation in higher plant cells estimated by image processing. Plant Cell Physiol. 48, 1509–1513 (2007). [DOI] [PubMed] [Google Scholar]
- Dirnberger D., Bencúr P., Mach L. & Steinkellner H. The Golgi localization of Arabidopsis thaliana beta1,2-xylosyltransferase in plant cells is dependent on its cytoplasmic and transmembrane sequences. Plant Mol Biol. 50, 273–281 (2002). [DOI] [PubMed] [Google Scholar]
Associated Data
This section collects any data citations, data availability statements, or supplementary materials included in this article.
Supplementary Materials
Supplementary information


