

To examine how target gene expression is coordinated among members of a transcription factor family, a simple two-member family (Met31 and Met32) that is essential for regulating sulfur metabolism in budding yeast is examined using both transcriptional and genome-wide binding arrays.
Abstract
Yeast sulfur metabolism is transcriptionally regulated by the activator Met4. Met4 lacks DNA-binding ability and relies on interactions with Met31 and Met32, paralogous proteins that bind the same cis-regulatory element, to activate its targets. Although Met31 and Met32 are redundant for growth in the absence of methionine, studies indicate that Met32 has a prominent role over Met31 when Met30, a negative regulator of Met4 and Met32, is inactive. To characterize different roles of Met31 and Met32 in coordinating Met4-activated transcription, we examined transcription in strains lacking either Met31 or Met32 upon Met4 induction in the absence of Met30. Microarray analysis revealed that transcripts involved in sulfate assimilation and sulfonate metabolism were dramatically decreased in met32Δ cells compared to its wild-type and met31Δ counterparts. Despite this difference, both met31Δ and met32Δ cells used inorganic sulfur compounds and sulfonates as sole sulfur sources in minimal media when Met30 was present. This discrepancy may be explained by differential binding of Met31 to Cbf1-dependent promoters between these two conditions. In the absence of Met30, genome-wide chromatin immunoprecipitation analyses found that Met32 bound all Met4-bound targets, supporting Met32 as the main platform for Met4 recruitment. Finally, Met31 and Met32 levels were differentially regulated, with Met32 levels mimicking the profile for active Met4. These different properties of Met32 likely contribute to its prominent role in Met4-activated transcription when Met30 is absent.
INTRODUCTION
Transcription factor families—groups of DNA-binding proteins that recognize the same cis-regulatory DNA element to modulate transcription—are found in all eukaryotes. Because individual members can perform different functions and can be expressed at different times, transcription factor families allow a broad range of expression responses for their transcriptional targets. To examine how target gene expression is coordinated among members of a transcription factor family, we examined a simple two-member family (Met31 and Met32) that is essential for regulating sulfur metabolism in the budding yeast, Saccharomyces cerevisiae.
Sulfur metabolism is involved in multiple facets of cellular metabolism and is regulated by a variety of environmental and intracellular cues (Kuras et al., 2002; Aranda and del Olmo, 2004; Barbey et al., 2005; Yen et al., 2005; Chandrasekaran et al., 2006; Hickman et al., 2011). Met4 is the sole transcriptional activator of sulfur metabolism in budding yeast. Because it does not make energetic sense for all sulfur metabolism genes to be activated in response to every inducing signal, yeast must have mechanisms to select specific genes for expression as they are required. The Met4 activator is devoid of intrinsic DNA-binding ability and relies on interactions with DNA-binding cofactor proteins to target specific genes for transcription. These Met4 cofactors act solely as adaptors for recruiting Met4 to promoters and lack intrinsic transcriptional activation ability (Kuras et al., 1996; Blaiseau et al., 1997). There are two categories of DNA-binding Met4 cofactors: 1) Met31 and Met32 are highly similar C2H2 zinc finger proteins, and each binds a Met31/Met32 cis-regulatory element (with the consensus sequence of AAACTGTGGC), and 2) Cbf1 is a basic helix-loop-helix protein that homodimerizes to bind a Cbf1 cis-regulatory element (consisting of a CACGTGA motif; Thomas et al., 1989, 1992; Kuras and Thomas, 1995; Kuras et al., 1996; Blaiseau et al., 1997; Blaiseau and Thomas, 1998; Lee et al., 2010). Met4 recruitment to the DNA is further facilitated by Met28, which has been shown to bind and stabilize the DNA-bound Met4 complexes in vitro (Kuras et al., 1997; Blaiseau and Thomas, 1998). A recent study suggested that Met28 binds a RYAAT motif that is found adjacent to Cbf1 sites in sulfur metabolism promoters (Siggers et al., 2011).
We previously identified 45 bona fide targets of Met4 (referred to as the “Met4 core regulon”) whose transcription is Met4 dependent under two different Met4-activating conditions: 1) sulfur limitation and 2) induced MET4 expression in the absence of its negative regulator, Met30 (Lee et al., 2010). All Met4 core regulon promoters contain Met31/Met32 motifs, indicating an essential role for Met31/Met32 promoter binding in Met4-activated transcription. Only a subset of target promoters contains Cbf1 sites. Consistent with these findings, deletion of both Met31 and Met32 eliminates Met4-activated transcription of the entire Met4 core regulon, whereas loss of either Met28 or Cbf1 interferes with the induction of only a subset of Met4 targets. Promoter features, such as the presence of a Cbf1 site and a site containing a weak match to the Met31/Met32 consensus sequence, are predictors of Cbf1 and Met28 dependence (Lee et al., 2010). In addition, a RYAAT motif adjacent to the Cbf1 site was found to contribute to Cbf1- and Met28-responsive gene induction under low-sulfur conditions (Siggers et al., 2011).
The DNA-binding domains of Met31 and Met32, which share 84% identity, show no differences in sequence specificity in vitro (Blaiseau et al., 1997; Badis et al., 2008). Whereas Met31 and Met32 are redundant for growth in the absence of methionine (Blaiseau et al., 1997), several studies indicate that Met31 and Met32 perform some distinct roles in the cell. First, met32Δ cells are significantly larger than met31Δ cells (Jorgensen et al., 2002). Second, Met4-dependent growth responses are different in met31Δ and met32Δ cells. This difference is most apparent when Met4 and Met32 are not regulated by Met30, a component of the SCFMet30 ubiquitin ligase complex. SCFMet30 regulates Met4 by ubiquitylation using two mechanisms: 1) polyubiquitylation of Met4 targets Met4 to the proteasome for degradation, and 2) oligoubiquitylation of Met4 inhibits the transcriptional activation ability of the stable Met4 protein (Patton et al., 1998; Kaiser et al., 2000; Rouillon et al., 2000; Kuras et al., 2002; Flick et al., 2004). Loss of Met30 results in a transcriptionally active form of Met4 that is not targeted for degradation. If Met4 activity is prolonged, a number of growth and cell cycle defects occur that lead to growth arrest and eventual cell death (Patton et al., 2000; Su et al., 2005). Met4 and Met32 are the only confirmed ubiquitylation targets of SCFMet30 (Patton et al., 1998; Ouni et al., 2010). Deletion of MET4 or inactivating mutations within its transcription activation domain bypasses met30Δ lethality (Patton et al., 2000). Of the Met4 cofactors, only MET32 deletion bypasses met30Δ lethality (Patton et al., 2000). Inactivating mutations within the DNA-binding domain of MET32 is also sufficient to bypass met30Δ lethality (Su et al., 2008).
The prominent role of Met32 is further demonstrated when cells are exposed to cadmium. On exposure, Met30 is unable to target Met4 for ubiquitylation, and Met4 becomes active (Barbey et al., 2005). As a result, sulfur metabolism genes are expressed, and the sulfur-containing antioxidant glutathione is produced in large quantities to allow cadmium detoxification (Li et al., 1997; Fauchon et al., 2002). To shunt sulfur usage toward the production of glutathione, cells undergo a Met4-dependent shift from the use of commonly used sulfur-rich enzymes to isozymes lower in sulfur content (Fauchon et al., 2002). Consistent with the role Met4 plays in cadmium detoxification, met4Δ and met31Δmet32Δ cells are sensitive to cadmium (Barbey et al., 2005). Although they are not as sensitive to cadmium as met31Δmet32Δ cells, met32Δ cells are more cadmium sensitive than met31Δ cells (Barbey et al., 2005), supporting the notion that Met32 plays a greater role than Met31 in Met4-activated transcription when Met30 is inactive.
Because there are several documented distinctions between Met31 and Met32 upon Met30 inactivation, we characterized global transcriptional differences between cells lacking either Met31 or Met32 upon MET4 expression when Met30 is inactive. On the basis of their transcriptional differences, we attempted to predict growth differences between the two deletion strains. We then characterized genome-wide DNA-binding patterns of Met4 and Met32 in vivo using chromatin immunoprecipitation and genomic tiling arrays. Finally, we examined Met31 and Met32 abundance upon expression of active Met4.
RESULTS
Most growth differences between met31Δ and met32Δ cells were identified when Met30 function was abrogated, either permanently (in met30Δ cells) or transiently (upon exposure of cells to cadmium or temperature shift of the temperature-sensitive mutant met30-6 strain; Patton et al., 2000; Barbey et al., 2005; Su et al., 2005). To identify transcriptional differences in the roles of Met31 and Met32 when Met30 is inactive, we expressed MET4 in the absence of Met30 (met30Δ) in strains lacking either MET31 or MET32 (met31Δ or met32Δ) and analyzed the strains using genome-wide transcriptional microarrays. Genomic alterations allowed MET4 to be expressed from the galactose-inducible GAL1 promoter at its endogenous locus (met4::GAL1-MET4). Short-term expression of Met4 in the absence of Met30 resembles the physiological response of cells exposed to cadmium without eliciting cadmium-induced transcriptional programs that are independent of Met4 (Fauchon et al., 2002; Lee et al., 2010; Supplemental Figure S1). In addition, this experimental design allows investigation of differences between met31Δ and met32Δ cells without the need to factor in a multitude of Met30-mediated effects on Met4 and its cofactors (Kaiser et al., 2000; Rouillon et al., 2000; Kuras et al., 2002; Flick et al., 2004, 2006; Chandrasekaran et al., 2006; Menant et al., 2006; Ouni et al., 2010).
Although MET32 deletion bypasses met30Δ lethality (Patton et al., 2000), it was unknown whether MET32 deletion would bypass lethality instigated by the combination of Met30 loss and high MET4 expression. Deletion of MET32 alone (and deletion of both MET31 and MET32) bypassed lethality caused by this condition, but deletion of MET31 alone was not sufficient for bypass (Figure 1A). Consistent with the difference in bypassing lethality, we identified clear met31Δ and met32Δ transcriptional differences upon galactose induction of met4::GAL1-MET4 met30Δ cells. Scatterplot comparisons of transcriptional profiles from met31Δ cells and its wild-type counterpart after 90 min of galactose induction showed that Met31 loss has little effect on the Met4 transcriptional signature (Figure 1B). In contrast, approximately one-third of the Met4 core regulon genes, denoted by red diamonds in the scatterplot, failed to induce in the met32Δ background (Figure 1C).
FIGURE 1:

Expression of Met4 in the absence of Met30 reveals distinct growth and transcriptional differences between met31∆ and met32∆ cells. (A) Loss of MET32 bypasses lethality caused by combined Met30 loss and high Met4 expression. Serial dilutions of different met4::GALMET4 met30Δ strains were spotted onto rich media XY plates containing either glucose or galactose. (B) Scatterplot comparison of microarray profiles of met4::GALMET4 met30Δ cells with met4::GALMET4 met30Δ met31Δ cells after 90 min of galactose treatment in rich media. (C) Scatterplot comparison of microarray profiles of met4::GALMET4 met30Δ cells with met4::GALMET4 met30Δ met32Δ cells after 90 min of galactose treatment in rich media. Expression data are represented on a log2 scale. The number of ORFs compared is indicated at the bottom right of each graph.
Of the 274 statistically significant transcripts shared among all profiles (p < 0.05 following Loess and Bayesian normalization), 93 genes had induction Z-scores of 2 or higher after 90 min of galactose induction of met4::GAL1-MET4 met30Δ cells. Sixty-three of these 93 transcripts failed to reach induction Z-scores of 2 in met4::GAL1-MET4 met30Δ met32Δ cells. Induction of 37 of these transcripts depended on Met32 but not on Met31 (with Z-scores of ≥2 in met4::GAL1-MET4 met30Δ met31Δ cells). Functional specification (Funspec) analysis (Robinson et al., 2002) of transcripts that solely depend on Met32 were enriched for genes involved in sulfate assimilation, ion transport, and allantoin/allantoate transport (Supplemental Figure S2). Although 27 of the 93 transcripts failed to reach induction Z-scores of 2 in the absence of Met31, only one statistically significant target solely depended on Met31 (and not Met32). This finding is consistent with the strong similarity of the met31Δ transcriptional profile to that of its wild-type counterpart (Figure 1B). Twenty-nine transcripts remained induced (with a Z-score of ≥2) in both the met31Δ and met32Δ backgrounds. If these 29 genes are Met4 targets, Met31 and Met32 would be redundant for mediating their activation. These targets were enriched for most of the sulfur metabolic pathways (cysteine biosynthesis, methionine metabolism, homocysteine biosynthesis, AdoMet-homocysteine cycle, sulfate assimilation; Supplemental Figure S2).
Multiple Em for Motif Elicitation (MEME) analysis (Bailey and Elkan, 1994) of the promoter regions of the different gene groups revealed slightly different DNA consensus sequences for the Met31/Met32 motif (Figure 2). The Met31/Met32 motif determined from the Met32-only–dependent promoters closely resembled the core regulon consensus Met31/Met32 sequence (grayscale motif; Lee et al., 2010). The redundant (Met31/Met32 independent) motif showed less emphasis on the cytosines that flank the central TGTGG sequence (Figure 2). Both Met32-only–dependent and redundant gene sets contained CACGTGA Cbf1 motifs (Figure 2). We previously defined the core regulon of Met4 and categorized it into three classes based on Cbf1/Met28 dependence (Lee et al., 2010). Class 1 consists of genes whose transcription depends on Cbf1 and Met28. Class 2 genes require Cbf1 and Met28 under the conditions of sulfur limitation but not upon MET4 expression in the absence of Met30. Class 3 genes are induced independent of either Cbf1 or Met28. Investigation of met31Δ and met32Δ microarray profiles with respect to the core regulon showed a correlation between Met32-dependent transcripts and Cbf1/Met28 dependence (Pearson chi-squared p value = 0.0018), with the most-Met32-dependent transcripts found in the Cbf1/Met28-dependent class gene groups (Figure 3, classes 1 and 2) and the least-Met32-dependent transcripts found in the Cbf1/Met28-independent class (Figure 3, class 3). This correlation may be due to decreased MET28 levels in met32Δ cells. MET28 appears dependent on Met32 but not on Met31 (Figure 3, class 2). Hierarchical clustering on the met31Δ and met32Δ microarray profiles with respect to sulfur metabolism genes identified transcripts that failed to induce in the absence of Met32 (Figure 4A, red). Consistent with their correlation with Cbf1/Met28 dependency, many Met32-dependent transcripts lie on the upper half of the sulfur metabolic pathway (Figure 4B, red). Clustering also identified targets that exhibited weak or delayed induction in met32Δ cells compared with its wild-type and met31Δ counterparts (Figure 4A, blue).
FIGURE 2:

Met31/Met32 and Cbf1 promoter motifs for Met32-only–dependent and Met31/Met32-redundant targets. MEME determined position-specific scoring matrices (PSSMs) of Met31/Met32- and Cbf1-binding motifs from the promoters of genes with different transcriptional dependences. Previously published PSSMs based on the Met4 core regulon are shown as grayscale (Lee et al., 2010).
FIGURE 3:

Microarray analysis of the Met4 core regulon shows that most Cbf1- and Met28-dependent target genes (class 1 and class 2) are Met32 dependent. Microarray transcriptional profiles of Met4 core regulon genes from wild-type, met31∆, met32∆, and met31∆ met32∆ strains genetically modified for galactose-induced active Met4 expression (met4::GALMET4 met30Δ) harvested at 15, 30, 60, and 90 min after galactose induction are compared with cells harvested before galactose induction. Z-score induction and repression are marked by red and green boxes, respectively (see scale). Core regulon genes are clustered into three classes (far left) based on Cbf1/Met28 dependence (see the text). Cbf1 and Met31/Met32 motifs within the promoters of these genes, as determined by MAST analysis, are indicated by black boxes (far right; Bailey and Gribskov, 1998). Note that partial MET30 transcripts can be detected because the met30∆ strain was constructed by an internal disruption of the gene (Thomas et al., 1995).
FIGURE 4:

Distinct sectors of the sulfur metabolic pathway are affected by Met32 loss. (A) Hierarchical clustering of microarray profiles on sulfur metabolism genes. Genes lacking visible microarray induction upon active Met4 in met32∆ cells are written in red, and genes showing weak or delayed microarray induction upon active Met4 expression in met32∆ cells compared with wild-type and met31∆ cells are written in blue. Genes that exhibit similar microarray profiles for wild-type, met31∆, and met32∆ cells are written in black. (B) Schematic of the sulfur assimilation pathway (adapted from Thomas and Surdin-Kerjan, 1997). Genes lacking visible microarray induction upon active Met4 in met32∆ cells are written in red. Cbf1- and Met28-dependent class 1 and class 2 genes are underlined. (C) Northern analysis of selected sulfur metabolism transcripts affected by Met32 loss.
To further examine differences in Met32-dependent transcription, we performed Northern analysis on eight Met4 targets—four involved in sulfate assimilation (MET3, MET14, MET22, MET16) and four involved in the management of organic sulfur compounds (MET17, MMP1, MUP1, GSH1; Figure 4C). As predicted, the absolute transcript levels for all examined sulfur metabolism genes were low before galactose induction in all strains. Northern analysis detected increases in the sulfate assimilation transcripts in met32Δ cells upon active Met4 expression, but these increases were significantly weaker or delayed compared with its wild-type and met31Δ counterparts. For MET22, the increase was less than twofold. Increases in other targets may have failed microarray detection in met32Δ cells due to low transcript levels. Consistent with microarray analyses, MET17, MMP1, and MUP1 exhibited weak or delayed transcript induction. GSH1, the critical gene for glutathione synthesis, was induced less than twofold in met32Δ cells by both Northern and microarray analysis, consistent with the cadmium sensitivity of met32Δ cells (Barbey et al., 2005).
On the basis of the transcriptional differences between met31Δ and met32Δ cells upon the induction of active Met4, we tested whether met31Δ and met32Δ cells exhibited different abilities in using sulfur compounds. We conducted yeast spot assays on met31Δ, met32Δ, met4Δ, met31Δ met32Δ, cbf1Δ, and met28Δ cells (lacking met4::GAL1-MET4 met30Δ alterations) on minimal media plates containing different levels of sulfate, sulfite, homocysteine, cysteine, and glutathione as sole sulfur sources (Figure 5). Because all strains use methionine as a sole sulfur source, minimal media plates containing 0.1 mM methionine were used as controls (Figure 5, top). Both met4Δ and met31Δ met32Δ cells failed to use sulfate, sulfite, cysteine, and glutathione as sole sulfur sources and were greatly impaired for growth on homocysteine-supplemented media, consistent with Met4 being the sole transcriptional activator of the sulfur metabolic pathway and our previous finding that Met4-activated transcription is lost in the absence of both Met31 and Met32 (Thomas and Surdin-Kerjan, 1997; Lee et al., 2010). In addition, both cbf1Δ and met28Δ cells failed to use sulfate and sulfite as sole sulfur sources. These findings are consistent with the key role of Cbf1 and Met28 in sulfate assimilation and previously reported reduced enzyme activities for sulfate assimilation in cbf1Δ cells (Thomas et al., 1992; Lee et al., 2010). We also noticed that cbf1Δ and met28Δ cells grew less well at lower concentrations of homocysteine and glutathione compared with the highest concentration of 0.5 mM. Met31 and Met32 are redundant for use of sulfate, sulfite, homocysteine, cysteine, and glutathione as sole sulfur sources despite the clear transcriptional differences between met31Δ and met32Δ cells upon MET4 expression in the absence of Met30.
FIGURE 5:

Strains lacking Met4 and Met4 cofactors exhibit different abilities to use common sulfur sources. Wild-type, met4∆, met31∆met32∆, met31∆, met32∆, cbf1∆, and met28∆ strains were serially diluted 10-fold and spotted onto minimal B-media agarose plates containing the indicated concentrations of sulfur compounds as the sole sulfur source. Images were taken after 3 d at 30°C.
In addition to common sulfur compounds, wild-type yeast can use alternative sulfur sources such as sulfonates (Uria-Nickelsen et al., 1993). We previously identified three genomic clusters of Met4-activated genes that are enriched for the metabolism of alternative sulfur sources (Choi et al., 1998; Hogan et al., 1999; Rouillon et al., 1999; Hall et al., 2005; Lee et al., 2010). Hierarchical clustering on these gene groups revealed that genes involved in the transport and metabolism of sulfonates, such as YIL166C, JLP1, and YLL058W, were most affected by Met32 loss (Figure 6A; Choi et al., 1998; Hogan et al., 1999). Therefore, we examined the ability of met31Δ and met32Δ cells to use taurine, isethionate, and cysteate as sole sulfur sources and compared their growth with that of met4Δ, met31Δ met32Δ, cbf1Δ, and met28Δ cells (Figure 6B). Both met4Δ and met31Δmet32Δ cells failed to use these compounds as sole sulfur sources. In addition, cbf1Δ and met28Δ cells also failed to use sulfonates. Despite their transcriptional differences, both met31Δ and met32Δ cells used all different concentrations of taurine, isethionate, and cysteate as sole sulfur sources (Figure 6B).
FIGURE 6:

Strains lacking Met4 and Met4 cofactors exhibit different abilities to use sulfonates. (A) Hierarchical clustering of microarray profiles on the GALMET4 chromosomal cluster genes. Genes lacking visible microarray induction upon active Met4 expression in met32∆ cells are shown in red. Genes that exhibit similar microarray profiles for wild-type, met31∆, and met32∆ cells are shown in black. (B) The indicated stains were serially diluted 10-fold and spotted onto B-media agarose plates containing the indicated concentrations of sulfur compounds as the sole sulfur source. Images were taken after 3 d at 30°C.
Given that met32Δ cells were greatly impaired for MET28 induction (Figure 3) and met28Δ cells failed to use sulfate, sulfite, and sulfonates (Figures 5 and 6), the ability of met32Δ cells to use these compounds was unexpected. MET28 may be expressed at such low levels in met32Δ cells upon active Met4 expression that it failed microarray detection, as was the case for many Met32-dependent transcripts (Figure 4A compared with Figure 4C). To investigate this possibility, we examined MET28 transcript levels upon galactose-induced expression of Met4 in the absence of Met30 by Northern analysis. Similar to microarray analyses, MET28 was detected in met31Δ cells but not in met32Δ cells (Figure 7A). Although MET28 was not detected in met32Δ cells within 90 min of Met4 expression, MET28 could have been expressed independent of Met32 under the conditions of the spot assay, which was performed on minimal media in cells that contain Met30. To investigate this possibility, we examined MET28 transcript levels in cells with Met30 upon the Met4-activating condition of sulfur limitation in minimal media. Although MET28 induction was impaired in met31Δ met32Δ cells upon sulfur limitation compared with wild-type cells, MET28 transcripts were detected (Figure 7B). These detectable levels of MET28 may reflect different forms of MET28 regulation between galactose induction of met4::GAL-MET4 met30Δ met32Δ cells and sulfur limitation of met31Δ met32Δ cells. This difference could affect recruitment of Met4 and allow strains in the yeast spot assay to express key genes to allow the use of different sulfur sources.
FIGURE 7:

Comparison of transcript profiles for MET4, MET28, MET31, and MET32 under two different Met4-activating conditions: (A) Northern analysis of MET4, MET28, and MET32 in indicated strains upon galactose induction in rich media. (B) Northern analysis of MET4, MET28, MET31, and MET32 in wild-type and indicated deletion strains upon sulfur limitation in minimal media.
To compare Met31 and Met32 promoter binding, we used genome-altered strains that contained Myc epitopes fused to the carboxyl termini of Met31 and Met32. Met31 and Met32 exhibited slightly different binding patterns. Consistent with our Northern data on transcript dependence, Met32 bound to promoters of the sulfate assimilation genes MET14 and MET16 and the glutathione synthesis gene GSH1, whereas Met31 did not, supporting the more important role of Met32 in the induction of Cbf1-dependent targets (Figure 8). We previously compared Met31- and Met32-binding patterns to these promoters upon sulfur limitation in minimal media. On sulfur limitation, Met31 and Met32 exhibit similar relative profiles of promoter binding, with Met31 exhibiting strong binding to MET14, MET16, and GSH1 relative to the other promoters analyzed (Lee et al., 2010). Differences in Met31 promoter-binding patterns between these two tested conditions may explain the discrepancy between the lack of sulfate assimilation gene induction upon galactose induction of met4::GAL-MET4 met30Δ met32Δ cells and the ability of met32Δ cells to use sulfate and sulfite as sole sulfur sources. Although the relative promoter-binding patterns for Met31 and Met32 were similar upon sulfur limitation, Met32Myc had ∼10-fold higher percentage capture values than Met31Myc upon sulfur limitation (Lee et al., 2010). We see a similar difference in percentage capture values between Met31 and Met32 upon Met4 expression in the absence of Met30 (Figure 8B, different scales for Met31 and Met32). As a control, Met4 and Rpb3HA exhibited very similar percentage captures in the two strains, which differ only in the Myc epitope–tagged target (Supplemental Figure S3).
FIGURE 8:

Differential binding of Met31 to Cbf1-independent target promoters upon induction of Met4 in the absence of Met30. (A) ChIP binding properties for Met4, Met31, Met32, and Rpb3 on indicated promoters before galactose induction (– galactose) and after 90 min of galactose induction (+ galactose) of met4::GAL-MET4 met30Δ MET31MYC RPB3HA and met4::GAL-MET4 met30Δ MET32MYC RPB3HA cells. Promoter binding is represented by the color scale relative to the highest percentage capture detected for each immunoprecipitated factor (Met4, Myc, and hemagglutinin), which is arbitrarily set at 100. (B) Anti-Myc epitope ChIP of met4::GAL-MET4 met30Δ MET31MYC RPB3HA and met4::GAL-MET4 met30Δ MET32MYC RPB3HA cells. Percentage capture is represented as the percentage of the total promoter available. Samples of cells growing in raffinose were harvested (RAF, second bar grouping) before the addition of galactose and at 90 min after galactose treatment (GAL, third bar grouping). Background percentage capture levels were determined using protein A beads with no antibody on the same strains (first bar grouping).
Despite many parameters that differ between these two Met4-activating conditions (galactose induction of met4::GAL-MET4 met30Δ cells in rich media or sulfur limitation in minimal media), we detected consistent differences between Met31 and Met32 expression (Figures 7 and 9). Transcriptional microarrays on met4::GAL-MET4 met30Δ cells showed that MET32 levels increase with active Met4 expression but showed no change in MET31 (Figure 4A and Figure 11D later in the paper). Northern analysis confirmed this MET32 pattern (Figure 7A), although a high background-to-signal ratio prevented MET31 assessment. The patterns of Met31 and Met32 steady-state protein levels mimicked microarray patterns of MET31 and MET32, respectively (Figure 9A). Met31 was maintained at a constant level, whereas Met32 accumulated with active Met4 expression. These data support differential regulation of MET31 and MET32, with MET32 as a Met4 target gene and MET31 as a nontarget. Likewise, MET32 and MET31 maintained these profiles upon sulfur limitation (Figure 7B). As before, MET32 transcript and Met32 protein accumulated with the active form of Met4 (phosphorylated and deubiquitylated; Figures 7B and 9B). This induction was lost in met4Δ cells (Figure 7B), consistent with MET32 as a Met4 target gene. MET31 transcripts and Met31 protein remained unchanged upon sulfur limitation in both wild-type and met4Δ cells (Figures 7 and 9), consistent with MET31 not being a target of Met4. Accumulation of Met32 may contribute to its greater impact on the Met4-activated transcription compared with Met31 (Figure 1, B and C). Cbf1 protein levels remained unchanged in both time courses (Figure 9).
FIGURE 9:

Comparison of protein profiles for Met4, Cbf1, Met31, and Met32 under two different Met4-activating conditions. (A) Western analysis of Met4, Cbf1, Met31, and Met32 in met4::GAL-MET4 met30Δ MET31MYC RPB3HA and met4::GAL-MET4 met30Δ MET32MYC RPB3HA cells upon galactose induction in rich media. (B) Western analysis of Met4, Cbf1, Met31, and Met32 in wild-type or epitope-tagged MET31MYC RPB3HA strains upon sulfur limitation in minimal media.
FIGURE 11:

Binding charts of Met4 and Met32 to the promoter regions of selected target genes. The genomic positions of probe regions and their enrichment ratios are displayed on the x- and y-axes, respectively. Below the graph, ORFs are depicted as rectangles, and arrows indicate the direction of transcription. The heat map data from the galactose induction time course on met4::GALMET4 met30Δ cells as published in Lee et al. (2010) is shown above for each target except for the MET31 and MET32 heat maps, which are based on the present microarray analysis of met4::GALMET4 met30Δ cells. Increases greater than twofold compared with the 0-min sample are marked by red boxes. Decreases greater than twofold are marked by green boxes. Less-than-twofold changes in transcription are represented by black boxes, and unreliable measurements are marked by gray boxes. (A) Sulfur metabolic genes, (B) sulfur-saving glycolytic genes, (C) MET4 and MET30 (note that endogenous MET4 and MET30 promoters remain intact), (D) Met4 cofactor genes, and (E) ACT1.
To get a mechanistic understanding of the prominent role of Met32 in Met4-activated transcription when Met30 is absent, we identified and characterized in vivo binding targets of Met4 and Met32 by conducting chromatin immunoprecipitation (ChIP) studies using genomic tiling arrays (ChIP-chip) after 90 min of galactose induction on met4::GAL-MET4 met30Δ cells. Anti-Met4 antibodies immunoprecipitated 250 genomic targets that exhibited a significant enrichment compared with control samples that lacked antibody (Figure 10A). Microarray data indicated a distinct correlation between Met4 promoter occupancy and transcriptional induction (Figure 10B and Supplemental Figure S4). As expected, Met4-bound targets are highly enriched for sulfur metabolism genes and included 39 of the 45 core regulon promoters (Figure 10B and Supplemental Figure S5). The highest Met4 captured targets (Figure 10B, yellow in Met4 ChIP lane) were enriched for both Cbf1 and Met31/Met32 sites as determined by MAST analysis (Figure 10B, black bands in MAST lanes; Pearson chi-squared analyses, p < 0.005; Bailey and Gribskov, 1998). Consistent with its prominent role in Met4-activated transcription, ChIP-chip studies showed that Met32 bound all identified Met4-bound DNA targets (Figure 10A). Although original ChIP-chip analyses (as outlined in Materials and Methods) identified three Met4-bound targets not bound by Met32 in a statistically significant manner, closer examination of tiling arrays showed these three targets bound by Met32 (Supplemental Figure S6). Targets of Met4 and Met32 were enriched for sulfur metabolism genes in addition to stress response and various transport genes (Supplemental Figure S7).
FIGURE 10:
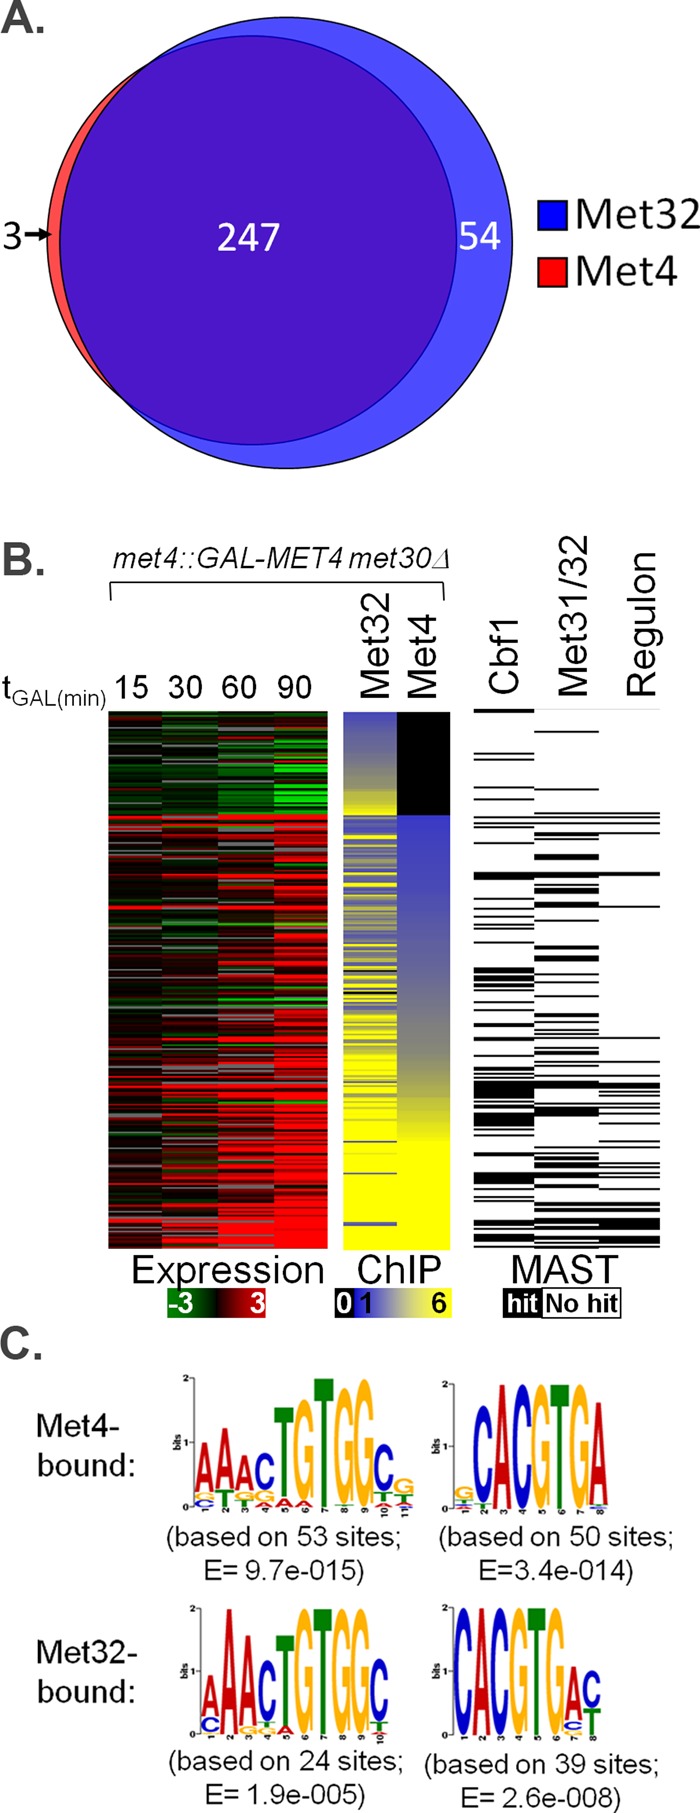
Characterization of in vivo genome binding for Met4 and Met32 using ChIP-chip. (A) Venn diagram of genome-wide Met4 and Met32 DNA targets upon active Met4 expression. Each circle represents the number of targets bound by Met4 (red circle) or Met32 (blue circle) as determined by analysis outlined in Materials and Methods. (B) ChIP-chip experiments (middle) are shown for Met4 and Met32 after 90 min of galactose induction. Each row represents a promoter region of a specific gene occupied by at least one factor. Expression profiles at different induction time points are shown for each gene (left). ChIP-chip data are presented on a yellow–blue enrichment scale (black indicates no binding), and gene expression data are presented on a green–red log2 scale (gray indicates unreliable measurements). Genes with MAST-determined matches to the Met4 core regulon–determined Met31/Met32 and Cbf1 motifs are marked by black boxes (right) (E value cutoff, 500; Bailey and Gribskov, 1998). (C) MEME-determined PSSMs of Met31/Met32- and Cbf1-binding motifs from the promoters that were most bound by Met4 and Met32 in ChIP-chip studies, respectively. Associated E values are listed.
MEME analysis of the top 130 Met4- and Met32-bound promoters revealed that Met31/Met32 and Cbf1 motifs closely matched the core regulon consensus sequences (Figure 10C compared with Figure 2, gray motifs). Given the large overlap between Met4-bound and Met32-bound targets, sequence differences were minimal. When nonpromoter targets were included in the analysis, MEME occasionally identified a core TGTGGC Met31/Met32-binding sequence in addition to the full Met31/Met32 motif (Supplemental Figure S8). If analysis included 180 bound regions, MEME-CHIP identified Cbf1 motifs that contained a flanking AAT motif in both Met4- and Met32-bound targets that matched part of the RYAAT motif found in Cbf1- and Met28-responsive promoters (Supplemental Figure S8; Machanick and Bailey, 2011; Siggers et al., 2011).
Close examination of tiling arrays showed almost identical binding patterns for Met4 and Met32 at individual targets, further supporting Met32 as the main anchor for Met4 promoter binding (Figure 11). Most Met4 and Met32 binding occurred at or near promoters (Figure 11). Sulfur metabolism genes with known Met31/Met32 promoter sites exhibited significant promoter binding by Met32 and Met4 (Figure 11A). Strong Met4 and Met32 promoter binding was also detected at known Met4 targets ENO1 and PDC6, which encode glycolytic enzymes of low sulfur content (Figure 11B; Fauchon et al., 2002; Pereira et al., 2008; Cormier et al., 2010). In addition, Met4 and Met32 bound the endogenous MET4 and MET30 promoters, consistent with known feedforward and feedback regulation of Met4 (Figure 11C). Of Met4 cofactors, Met4 and Met32 bound genomic regions associated with MET28, MET31, and MET32 but not CBF1 (Figure 11D). Whereas Met4 and Met32 bound promoters of MET28 and MET32, Met4 and Met32 bound the MET31 open reading frame (ORF; Figure 11D). Examination of the MET31 ORF revealed a full Met31/Met32 consensus binding sequence at the region corresponding to the largest ratios of Met4 and Met32 binding; the MET32 ORF, which is not bound by Met32 or Met4, lacks this full motif (Supplemental Figure S9). In addition to MET31, 47 other targets were bound by Met4 and/or Met32 at their ORF or 3′ intergenic regions. These targets failed to induce upon induction of active Met4, either suggestive of roles for Met4 and Met32 that are independent of transcriptional activation or an indication of inappropriate binding by Met4 and Met32 to nontargets due to their high protein levels (Supplemental Figure S1C and Figure 9A). Although Met4 and Met32 binding to these targets may be an artifact, MEME analysis indicated Met31/Met32 motifs in all retrievable ORFs, showing a strong consensus to an abbreviated CTGTGGC motif (Supplemental Figure S10). These atypical targets were enriched for osmosensing and tRNA processing (Supplemental Figure S10).
In addition to Met4-bound targets, ChIP-chip analyses identified 54 targets that registered as Met32 bound but not Met4 bound (Figure 10A). These “Met32-only”–bound targets did not contain matches to either Met31/Met32 or Cbf1 motifs as determined by MAST and were not induced upon active Met4 expression. In fact, several Met32-only–bound targets were ribosomal protein genes that were repressed upon Met4 expression (Supplemental Figure S6 and Figure 10B). Met32-only targets were also enriched for carbon metabolic pathways (glycolysis, gluconeogenesis, pentose phosphate shunt) and steroid metabolism (Supplemental Figure S11). Closer examination of most Met32-only targets indicated less Met32 binding compared with known Met4 targets and low levels of Met4 at the precise locations bound by Met32 (Supplemental Figure S11). Because most of these Met32-only transcripts were not induced upon Met4 expression, Met32 may perform roles beyond Met4-activated transcription. Alternatively, this binding may be an artifact of high Met32 levels in this growth condition (Figure 9A). If there is a role for Met32 beyond Met4-activated transcription, many Met32-only–bound regions contained multiple genes, confounding identification of relevant targets (Supplemental Figure S11). Whereas MEME analysis failed to identify Met31/Met32 or Cbf1 motifs among these targets, the binding motif for Rap1 was identified, consistent with enrichment for ribosomal protein genes (Supplemental Figure S11). Excess Met32 and Met4 may simply be drawn to these nontargets through interactions with the basal machinery, as Rap1/Gcr1 activation occurs at nuclear pore–associated transcription factories and potentially accounts for >75% of mRNA production in logarithmically growing cells (Menon et al., 2005). In support of this hypothesis, Met4 and Met32 also bound to the highly expressed GAL promoters upon galactose induction despite the lack of Met31/Met32 sites in these promoters (Supplemental Figure S12). Like Rap1/Gcr1–activated genes, the GAL genes are transcribed at high levels upon galactose induction and are known to localize to the nuclear periphery, where transcription factories are found (Berger et al., 2008).
DISCUSSION
We originally chose to study the condition of Met4 expression in the absence of Met30 to mimic the physiological Met4 activation response seen upon cadmium exposure without eliciting cadmium responses that were independent of Met4, which would obscure the Met4 transcriptional profile (Supplemental Figure S1). However, higher levels of active Met4 are produced when Met4 is expressed from the GAL1 promoter in the absence of Met30 compared with levels seen upon cadmium exposure (Supplemental Figure S1C). The overabundance of Met4 and Met32 in the absence of Met30 appears to produce artifacts in genome binding. Under these conditions, Met4 and Met32 were drawn to nontarget genes undergoing robust transcription, such as ribosomal protein and galactose metabolism (GAL) genes (Supplemental Figures S11 and S12). Although expression of Met4 in the absence of Met30 may result in binding artifacts, Met4 is transcriptionally active in this condition (Supplemental Figure S1) and preferentially binds known target genes. Previous ChIP-chip analyses characterized Met4, Met31, and Met32 in rich media or in response to the branched amino acid inhibitor sulfometuron methyl (SM) in synthetic complete media (Lee et al., 2002; Harbison et al., 2004). Unfortunately, SM addition causes severe repression of MET genes, and Met4 is inhibited by Met30 in rich media (Jia et al., 2000; Kuras et al., 2002; Lee et al., 2010). Reflecting this lack of Met4 activity, Met4 and Met32 only bound ∼31% of Met4 core regulon targets in this previous ChIP-chip study (Supplemental Figure S5, left). In contrast, we found that Met4 and Met32 bound ∼89% of core regulon targets in our study (Supplemental Figure S5, right). Therefore, although artifacts in genome binding may exist, our ChIP-chip analysis offers the best in vivo genome-wide representation of Met4 and Met32 binding when Met4 is known to be transcriptionally active.
Analysis of Met4 expression in the absence of Met4 may also shed light on the physiological problems cells experience when undergoing met30Δ lethality. Upon loss of Met30, cells undergo G1 arrest, growth arrest, and lethality, with defects in translation (Patton et al., 2000). We previously showed that Met4 expression in the absence of Met30 causes decreased transcript levels for ribosomal protein (RP) genes and glycolysis genes (Lee et al., 2010). The decrease in RP transcripts upon active Met4 expression was bypassed when MET31 and MET32 were deleted (Lee et al., 2010). Glycolytic and RP genes exhibited Met32 binding without significant Met4 binding and were not induced in a Met4-dependent manner (Supplemental Figure S11). We also noticed strong Met32 and Met4 binding to the promoter of the glycolytic nontarget gene PGK1 (Supplemental Figure S12). It is possible that excess Met32 binds these promoters and somehow interferes with activation of these genes in this condition.
Both full and core Met31/Met32 motifs were identified among Met4/Met32-bound targets, which included promoters, ORFs, and 3′ intergenic regions (Supplemental Figures S8 and S10). The core CTGTGGC consensus sequence was identified among Met4- and Met32-bound ORFs. It is unknown whether Met4 or Met32 performs any role at open reading frames, but given our microarray profiles, it appears to be independent of Met4-activated transcription. Gcn4, a transcriptional activator of amino acid biosynthesis genes, binds coding regions in addition to promoter targets (Topalidou and Thireos, 2003). When ORF bound, Gcn4 recruits the chromatin-modifying SAGA complex but not the mediator complex (Topalidou and Thireos, 2003). Like Gcn4, Met4 recruits both mediator and SAGA complexes when it is promoter bound (Leroy et al., 2006). Given this similarity, Met4 may also recruit SAGA but not mediator when ORF bound. Previous studies determined that Met4 and Met32 bind the promoter of the sulfur-saving Met4 target PDC6 via core Met31/Met32 sites that consist of the CTGTGGC sequence and that inclusion of PDC6 as a Met4 target appears to be a relatively recent evolutionary event (Cormier et al., 2010). MEME identified this abbreviated motif in both ORF- and promoter-bound targets of Met4 and Met32.
Abundance of Met31 and Met32 likely contributes to their functional roles in transcription. Our previous genome-wide transcriptional analyses of met4::GAL-MET4 met30Δ cells using microarrays with entire cDNAs showed no changes in either MET31 and MET32 transcript levels with galactose induction (Lee et al., 2010), whereas our present study involving microarrays with 70-mer oligos showed increases for MET32 with no increase for MET31. Because Met31 and Met32 are highly similar, especially within their DNA-binding domains (Blaiseau et al., 1997), it is likely that cross-hybridization in the microarrays that contained the full cDNAs of MET31 and MET32 obscured detection of different MET31 and MET32 patterns. In addition, our previous Western analyses against tagged Met31 and Met32 at 1 h after sulfur limitation showed no differences between Met31 and Met32 levels (Lee et al., 2010). Our present examination at 0, 20, 40, and 80 min after sulfur limitation allowed us to better assess differences in the relative levels of Met31 and Met32 (Figure 9).
Previous protein-binding arrays characterized binding motifs and/or binding affinities for Met4, Met31, and Met32 (Badis et al., 2008; Siggers et al., 2011). Protein-binding arrays using in vitro translated glutathione S-transferase (GST) fusion proteins with the DNA-binding domains of Met31 and Met32 found no differences in DNA-binding motifs for Met31 and Met32 (both bound TGTGGCG; Badis et al., 2008). This finding indicates that the DNA-binding domains of Met31 and Met32, which share 84% identity, show no intrinsic differences in sequence specificity. Given that Met4-activated transcription is mediated by a complex of proteins, protein–protein interactions with Met4 and other factors are likely to play a role in differentiating Met31 and Met32 in terms of Met4 recruitment and/or target selection. Our in vivo ChIP study revealed that Met32 overlapped precisely with all Met4-bound regions, supporting Met32 as the main platform for Met4. Consistent with Met32 serving as a main platform for Met4 binding, in vitro protein-binding arrays using purified full-length Met4 and Met32 GST fusion proteins showed that Met4 exhibited Met32-dependent binding to sequences that scaled with the binding affinity of Met32 (Siggers et al., 2011). The addition of full-length GST-Met28 fusion proteins had no effect on Met4 binding, indicating that Met32 recruitment of Met4 is independent of Met28 in this system (Siggers et al., 2011). If Met31 binding and/or recruitment of Met4 is altered by the presence of Met28, different transcriptional responses could be elicited from these similar transcription factors. Further characterization of protein–protein interactions with respect to DNA-binding affinity and specificity will be required to obtain a systems view of transcriptional regulation by the Met4 complex.
In characterizing the role of Met31 and Met32 in Met4-activated transcription, we identified Met4 targets that depend on Met32 for full induction when Met4 expression is induced in the absence of Met30. Many of these targets fell within the upper half of the sulfur metabolic pathway, were Cbf1 and Met28 dependent, and exhibited weak or delayed induction in met32Δ cells. Altered induction kinetics may be due to reduced or absent MET28 (Figure 7), which would result in less Met28 to facilitate formation of stable, DNA-bound Met4 transcriptional complexes that contain Cbf1 and/or Met31. Despite reduced transcripts for critical sulfate and sulfonate metabolism genes, met32Δ cells used sulfate, sulfite, taurine, isethionate, and cysteate as sole sulfur sources in minimal media (Figures 5 and 6). To resolve this discrepancy, we examined several aspects of the Met4 transcriptional complex in the two tested conditions (of sulfur limitation of wild-type cells in minimal media and galactose induction of met4::GAL-MET4 met30Δ cells in rich media) and identified a clear difference in Met31 promoter binding to the Cbf1-dependent targets of MET14, MET16, and GSH1 (Figure 8; Lee et al., 2010). Both Met31 and Met32 bound to these promoters upon sulfur limitation in minimal media (Lee et al., 2010). This finding potentially explains how met31Δ and met32Δ cells use sulfate and sulfite in the yeast spot assays (Figure 5). In contrast, Met31 exhibited poor binding to the promoters of sulfate assimilation genes and GSH1 upon galactose induction of met4::GAL1-MET4 met30Δ cells, whereas Met32 bound these targets (Figure 8). This finding could explain the lack induction for sulfate assimilation genes in met4::GAL1-MET4 met30Δ met32Δ cells (Figure 4) and the sensitivity of met32Δ cells to cadmium (which requires Gsh1-mediated production of glutathione for detoxification) compared with the resistant met31Δ cells (Barbey et al., 2005). Unfortunately, the mechanism by which Met31 exhibits differential promoter binding is unclear, as several parameters, such as growth media, Met30 functionality, and promoter regulation of Met4, differ between the two conditions. Given that Met30 is critical for targeting Met32 for ubiquitin-mediated degradation (Ouni et al., 2010), it is reasonable that Met32 plays a greater role in Met4-activated transcription when Met30 is nonfunctional. In addition to effects mediated by Met30, Met4 plays a key role in modulating Met32 function, as Met4 appears to protect Met32 from ubiquitin-mediated degradation by another unidentified ubiquitin ligase (Ouni et al., 2010). A comprehensive understanding of the dynamics connecting Met4, its DNA-binding cofactors, Met30, and other regulators and how these dynamics affect Met4-activated transcription will require further study.
MATERIALS AND METHODS
Yeast strains and culture conditions
All yeast strains used in this study (Table 1) are in the W303 background (ade2-1 can1-100, his3-1,15 leu2-3112 trp1-1 ura3). Epitope-tagged strains were generated using a published tagging system (Longtine et al., 1998). For expression of Met4 in the absence of Met30 in studies, met4::GAL-MET4 met30Δ, met4::GAL-MET4 met30Δ met31Δ met32Δ, met4::GAL-MET4 met30Δ met31Δ, and met4::GAL-MET4 met30Δ met32Δ were grown in XY media (2% bactopeptone, 1% yeast extract, 0.01% adenine, and 0.02% tryptophan) + 2% raffinose. An aliquot of cells was harvested for a t = 0 time point, and galactose was added to the remaining culture to a final concentration of 2–3%. Cells were harvested after 30, 60, and 90 min in galactose. For the yeast spot assays, indicated strains were serially diluted 10-fold onto B-media agarose plates using different sulfur compounds as the sole sulfur source (the protocol for making B-media plates is described by Cherest and Surdin-Kerjan, 1992). For sulfur limitation Northern and Western studies, WT, met4Δ, and met31Δ met32Δ strains were grown in minimal B-media (see Cherest and Surdin-Kerjan, 1992, for B-media composition) supplemented with 0.5 mM methionine as the sole sulfur source. An aliquot of cells was harvested for a t = 0 time point, and the remainder was filtered through a 0.22-μm Stericup filter (Millipore, Billerica, MA), then washed and resuspended in prewarmed (30°C) B-media lacking any source of sulfur. Cells were harvested after 20, 40, and 80 min.
TABLE 1:
Yeast strains use in this study.
| Strain | Relevant genotype | Source |
|---|---|---|
| yMT-235 | MATa, ade2-1 can1-100, his3-1, 15 leu2-3, 112 trp1-1 ura3 | K. Nasmyth, University of Oxford |
| yMT-1465 | MATa, met31:TRP1, met32::HIS3 | Blaiseau et al. (1997) |
| yMT-1782 | MATa, met28::LEU2 | Lee et al. (2010) |
| yMT-1813 | MATa, met4::TRP1 | Rouillon et al. (2000) |
| yMT-1947 | MATa, cbf1::TRP1 | Rouillon et al. (2000) |
| yMT-2567 | MATa RPB3::3HA-TRP1, MET31::11MYC-his5+ | Lee et al. (2010) |
| yTAL-270 | MATα, met32::URA3 | This study |
| yTAL-276 | MATa, met31::leu2::URA3 | This study |
| yTAL-307 | MATa, met4::GAL1MET4, met30::LEU2 | This study |
| yTAL-308 | MATa, met4::GAL1MET4, met30::LEU2, met31::leu2::URA3 | This study |
| yTAL-316 | MATa, met4::GAL1MET4, met30::LEU2, met32::URA3 | This study |
| yTAL-319 | MATa, met4::GAL1MET4, met30::LEU2, met31::TRP1, met32::HIS3 | This study |
| yTAL-330 | MATα met4::GAL1MET4, met30::LEU2, RPB3::3HA-TRP1, MET31::11MYC- his5+ | This study |
| yTAL-361 | MATa, met4::GAL1MET4, met30::LEU2, RPB3::3HA-TRP1, MET32::11MYC- his5+ | This study |
Microarray analysis
The transcriptional microarrays were produced at the Samuel Lunenfeld Research Institute, Mount Sinai Hospital (Toronto, Canada; www.mshri.on.ca/microarray), and consist of long oligo (70-mer) gene sets from Qiagen Operon (Alameda, CA). Data were loaded into R and the linear model for microarray analysis (limma) using either the yeast 6.4k version 2 or the version 3 GenePix definition files. Median values were selected for signal and background in F635 and F532. Data representing buffer and oligo mixtures were removed, and Q-site values were reduced to 50% of their weight to perform print-tip loess normalization. Because arrays showed low background, we did not apply background correction. To further normalize between arrays, we used the standard quantile method. To keep consistent replicates for further analysis, we calculated a linear fit between and within array duplicates for each gene to assess the significance of differential expression between different experimental conditions. Limma uses an empirical Bayes method to construct an LOD score to adjust for the statistical significance. To display the data as a heat map across all arrays, we used the robust Z-score : x – median(sample)/median absolute deviation(sample) × 1.4826 either on top of the Bayesian LOD scores or log fold change between the two channels. The reported p-value was adjusted based on the false-discovery rate function in limma. The raw and normalized data are available at www.ebi.ac.uk/microarray-as/ae under accession number E-MEXP-3301.
Average hierarchical clustering was performed using the Cluster 3 program (de Hoon et al., 2004), and heat maps were produced using the Java Treeview program (Saldanha, 2004). Venn diagrams were produced using online VENNY software (Oliveros, 2007) and the Venn Diagram Plotter program from the Pacific Northwest National Laboratory (Richland, WA) at http://omics.pnl.gov. Functional specification analysis of transcripts was performed using the Funspec Web portal at http://funspec.ccbr.utoronto.ca (Robinson et al., 2002). As stated in Robinson et al. (2002), the p value for each enrichment was calculated using hypergeometric distribution and subsequent Bonferroni correction and represents the probability of finding such an enrichment by chance. Target sequences were retrieved using the online Regulatory Sequence Analysis Tools program at http://rsat.ulb.ac.be/rsat/. MEME analysis was performed using the online program at http://meme.sdsc.edu/meme4_6_1/intro.html (Bailey and Elkan, 1994).
Northern analysis
Northern analysis was conducted as previously described (Willems et al., 1996). Northern blots were probed with ORF fragments that were amplified using PCR and random primed with 32P-α-dATP using the Klenow fragment of DNA polymerase I (New England BioLabs, Ipswich, MA). Transcript abundance was quantitated by a Cyclone Phosphorimager Detection System (PerkinElmer, Waltham, MA) and normalized to ACT1 mRNA levels.
Western analysis
Western analyses were conducted as previously described (Barbey et al., 2005). Standard procedures were used for PAGE, semidry or wet transfer to polyvinylidene fluoride membranes, and immunoblotting. 12CA5 (Santa Cruz Biotechnology, Santa Cruz, CA), 9E10 (Santa Cruz Biotechnology), anti-Rpb3 (Neoclone, Madison, WI), and anti-Rpb1 (Neoclone) monoclonal antibodies, as well as polyclonal antibodies against Met4, Met32, and Cbf1, were used as previously described (Kuras et al., 2002; Barbey et al., 2005; Lee et al., 2010).
ChIP-chip analysis
ChIP-chip was performed in duplicate, as previously described, with some modifications (Guillemette et al., 2005). Briefly, 50-ml cultures were grown in rich media to an O.D.600 of 0.6–0.8 and fixed with 1% formaldehyde as described. Sonicated whole-cell extract was incubated with anti-Met4 antibodies, anti-Met32 antibodies, or no antibodies (control) and protein A–Sepharose beads. The immunoprecipitated DNA fragments were blunted with T4 DNA polymerase and ligated to unidirectional linkers. The DNA was then amplified by PCR in the presence of aminoallyl-modified dUTP. The labeling was carried out post PCR using monoreactive Cy-dye NHS esters that react specifically with the aminoallyl-modified dUTP. Control and experimental samples were combined, and the labeled DNA was hybridized to a yeast whole-genome high-density oligonucleotide ChIP-on-chip microarray (4× 44K; Agilent Technologies, Santa Clara, CA) at the University Health Network Microarray Centre (Toronto, Canada; www.microarrays.ca). These microarrays contain 60-mer probes covering the entire genome (except for repetitive regions) with an average density of one probe every 290 base pairs within the probed regions. Hybridization and washes were done according to Agilent Yeast ChIP-chip protocol. Detailed ChIP-chip protocol can be found at www.ircm.qc.ca/LARECHERCHE/axes/Biologie/Chromatine/Pages/default.aspx. Microarray were scanned with a GenePix 4000B (Molecular Devices, Sunnyvale, CA). Spots were found and quantitated with GenePix Pro (Molecular Devices). Data were analyzed as previously described (Ren et al., 2000). Hybridization data were preprocessed using ArrayPipe 1.7 (Hokamp et al., 2004). Background was subtracted using the “foreground–background” correction method, and the data were normalized using the limma loess (subgrid) method. Genome-wide location data were analyzed as described previously (Boyer et al., 2005; Pokholok et al., 2006). Briefly, ChIP enrichment was determined for each probe after normalization. For each array, the p value was calculated for each probe using an error model. Probes that scored significantly above background were then combined into probe sets of three probes if they passed the following filter: the center probe has p < 0.001, one of the flanking probes has p < 0.01, and two of the three probes in the probe set each has single probe p < 0.005. The raw and normalized data are available at www.ebi.ac.uk/microarray-as/ae under accession number E-MEXP-3302. Target sequences were retrieved using the online Regulatory Sequence Analysis Tools program at http://rsat.ulb.ac.be/rsat. MEME analysis was performed using the online program at http://meme.sdsc.edu/meme4_6_1/intro.html (Bailey and Elkan, 1994). MEME CHIP analysis was performed using the online program at http://meme.sdsc.edu/meme/cgi-bin/meme-chip.cgi (Machanick and Bailey, 2011).
Single-promoter ChIP analysis
ChIP analyses were conducted as previously described (Kuras et al., 2002). Anti-hemagglutinin (F-7) and anti–c-Myc (9E10) antibodies were purchased from Santa Cruz Biotechnology. Multiplex real-time quantitative PCR on ChIP samples was conducted as previously described (Jorgensen et al., 2004), except that the IQ5 real-time PCR detection and analysis system (Bio-Rad, Hercules, CA) was used. See Lee et al. (2010) for sequence of real-time primers and probes. Relative promoter binding of each transcription factor was compared as a color scale, with red indicating binding and black indicating no binding. For each tagged or untagged protein on which ChIP was conducted, ChIP efficiency for all promoters was represented relative to the highest captured promoter, which was assigned a value of 100%.
Supplementary Material
Acknowledgments
We give special thanks to Chi Yip Ho and Kin Chan from the Samuel Lunenfeld Research Institute/Medical and Related Sciences Array Facilities for producing the yeast transcriptional arrays and providing array analysis tools. We thank François Robert for the use of his microarray Laboratory Information Management System (LIMS) for ChIP-on-chip array analysis. From the University of Wisconsin–Parkside, we thank Le'erin Voss for confirming strain markers and optimizing real-time quantification of ChIP and Gregory Mayer for providing helpful discussion and advice on data analysis. G.B.-A. and J.W. were supported by the National Institute of Canada. D.G. was supported by the University of Wisconsin–Parkside Undergraduate Research Apprenticeship Program. This research was supported by the UW-Parkside Biomedical Research Institute Fund, the University of Wisconsin–Parkside Masters in Applied Molecular Biology Fund, and National Institutes of Health, National Institute of General Medical Sciences, Academic Research Enhancement Award Grant R15GM086847. Like other National Institutes of Health–supported research publications, the content of the article is solely the responsibility of the authors and does not necessarily represent the official views of the National Institutes of Health.
Abbreviations used:
- ChIP
chromatin immunoprecipitation
- ChIP-chip
genome-wide chromatin immunoprecipitation
- ORF
open reading frame
- RP
ribosomal protein
Footnotes
This article was published online ahead of print in MBoC in Press (http://www.molbiolcell.org/cgi/doi/10.1091/mbc.E11-06-0532) on March 21, 2012.
REFERENCES
- Aranda A, del Olmo ML. Exposure of Saccharomyces cerevisiae to acetaldehyde induces sulfur amino acid metabolism and polyamine transporter genes, which depend on Met4p and Haa1p transcription factors, respectively. Appl Environ Microbiol. 2004;70:1913–1922. doi: 10.1128/AEM.70.4.1913-1922.2004. [DOI] [PMC free article] [PubMed] [Google Scholar]
- Badis G, et al. A library of yeast transcription factor motifs reveals a widespread function for Rsc3 in targeting nucleosome exclusion at promoters. Mol Cell. 2008;32:878–887. doi: 10.1016/j.molcel.2008.11.020. [DOI] [PMC free article] [PubMed] [Google Scholar]
- Bailey TL, Elkan C. Proceedings of the Second International Conference on Intelligent Systems for Molecular Biology. Vol. 2. Menlo Park, CA: AAAI Press; 1994. Fitting a mixture model by expectation maximization to discover motifs in biopolymers; pp. 28–36. [PubMed] [Google Scholar]
- Bailey TL, Gribskov M. Combining evidence using p-values: application to sequence homology searches. Bioinformatics. 1998;14:48–54. doi: 10.1093/bioinformatics/14.1.48. [DOI] [PubMed] [Google Scholar]
- Barbey R, Baudouin-Cornu P, Lee TA, Rouillon A, Zarzov P, Tyers M, Thomas D. Inducible dissociation of SCF(Met30) ubiquitin ligase mediates a rapid transcriptional response to cadmium. EMBO J. 2005;24:521–532. doi: 10.1038/sj.emboj.7600556. [DOI] [PMC free article] [PubMed] [Google Scholar]
- Berger AB, Cabal GG, Fabre E, Duong T, Buc H, Nehrbass U, Olivo-Marin JC, Gadal O, Zimmer C. High-resolution statistical mapping reveals gene territories in live yeast. Nat Methods. 2008;5:1031–1037. doi: 10.1038/nmeth.1266. [DOI] [PubMed] [Google Scholar]
- Blaiseau PL, Isnard AD, SurdinKerjan Y, Thomas D. Met31p and Met32p, two related zinc finger proteins, are involved in transcriptional regulation of yeast sulfur amino acid metabolism. Mol Cell Biol. 1997;17:3640–3648. doi: 10.1128/mcb.17.7.3640. [DOI] [PMC free article] [PubMed] [Google Scholar]
- Blaiseau PL, Thomas D. Multiple transcriptional activation complexes tether the yeast activator Met4 to DNA. EMBO J. 1998;17:6327–6336. doi: 10.1093/emboj/17.21.6327. [DOI] [PMC free article] [PubMed] [Google Scholar]
- Boyer LA, et al. Core transcriptional regulatory circuitry in human embryonic stem cells. Cell. 2005;122:947–956. doi: 10.1016/j.cell.2005.08.020. [DOI] [PMC free article] [PubMed] [Google Scholar]
- Chandrasekaran S, Deffenbaugh AE, Ford DA, Bailly E, Mathias N, Skowyra D. Destabilization of binding to cofactors and SCFMet30 is the rate-limiting regulatory step in degradation of polyubiquitinated Met4. Mol Cell. 2006;24:689–699. doi: 10.1016/j.molcel.2006.10.028. [DOI] [PubMed] [Google Scholar]
- Cherest H, Surdin-Kerjan Y. Genetic analysis of a new mutation conferring cysteine auxotrophy in Saccharomyces cerevisiae: updating of the sulfur metabolism pathway. Genetics. 1992;130:51–58. doi: 10.1093/genetics/130.1.51. [DOI] [PMC free article] [PubMed] [Google Scholar]
- Choi JH, Lou W, Vancura A. A novel membrane-bound glutathione S-transferase functions in the stationary phase of the yeast Saccharomyces cerevisiae. J Biol Chem. 1998;273:29915–29922. doi: 10.1074/jbc.273.45.29915. [DOI] [PubMed] [Google Scholar]
- Cormier L, Barbey R, Kuras L. Transcriptional plasticity through differential assembly of a multiprotein activation complex. Nucleic Acids Res. 2010;38:4998–5014. doi: 10.1093/nar/gkq257. [DOI] [PMC free article] [PubMed] [Google Scholar]
- de Hoon MJ, Imoto S, Nolan J, Miyano S. Open source clustering software. Bioinformatics. 2004;20:1453–1454. doi: 10.1093/bioinformatics/bth078. [DOI] [PubMed] [Google Scholar]
- Fauchon M, Lagniel G, Aude JC, Lombardia L, Soularue P, Petat C, Marguerie G, Sentenac A, Werner M, Labarre J. Sulfur sparing in the yeast proteome in response to sulfur demand. Mol Cell. 2002;9:713–723. doi: 10.1016/s1097-2765(02)00500-2. [DOI] [PubMed] [Google Scholar]
- Flick K, Ouni I, Wohlschlegel JA, Capati C, McDonald WH, Yates JR, Kaiser P. Proteolysis-independent regulation of the transcription factor Met4 by a single Lys 48-linked ubiquitin chain. Nat Cell Biol. 2004;6:634–641. doi: 10.1038/ncb1143. [DOI] [PubMed] [Google Scholar]
- Flick K, Raasi S, Zhang H, Yen JL, Kaiser P. A ubiquitin-interacting motif protects polyubiquitinated Met4 from degradation by the 26S proteasome. Nat Cell Biol. 2006;8:509–515. doi: 10.1038/ncb1402. [DOI] [PubMed] [Google Scholar]
- Guillemette B, Bataille AR, Gevry N, Adam M, Blanchette M, Robert F, Gaudreau L. Variant histone H2A.Z is globally localized to the promoters of inactive yeast genes and regulates nucleosome positioning. PLoS Biol. 2005;3:e384. doi: 10.1371/journal.pbio.0030384. [DOI] [PMC free article] [PubMed] [Google Scholar]
- Hall C, Brachat S, Dietrich FS. Contribution of horizontal gene transfer to the evolution of Saccharomyces cerevisiae. Eukaryot Cell. 2005;4:1102–1115. doi: 10.1128/EC.4.6.1102-1115.2005. [DOI] [PMC free article] [PubMed] [Google Scholar]
- Harbison CT, et al. Transcriptional regulatory code of a eukaryotic genome. Nature. 2004;431:99–104. doi: 10.1038/nature02800. [DOI] [PMC free article] [PubMed] [Google Scholar]
- Hickman MJ, Petti AA, Ho-Shing O, Silverman SJ, McIsaac RS, Lee TA, Botstein D. Coordinated regulation of sulfur and phospholipid metabolism reflects the importance of methylation in the growth of yeast. Mol Biol Cell. 2011;22:4192–4204. doi: 10.1091/mbc.E11-05-0467. [DOI] [PMC free article] [PubMed] [Google Scholar]
- Hogan DA, Auchtung TA, Hausinger RP. Cloning and characterization of a sulfonate/alpha-ketoglutarate dioxygenase from Saccharomyces cerevisiae. J Bacteriol. 1999;181:5876–5879. doi: 10.1128/jb.181.18.5876-5879.1999. [DOI] [PMC free article] [PubMed] [Google Scholar]
- Hokamp K, et al. ArrayPipe: a flexible processing pipeline for microarray data. Nucleic Acids Res. 2004;32:W457–W459. doi: 10.1093/nar/gkh446. [DOI] [PMC free article] [PubMed] [Google Scholar]
- Jia MH, Larossa RA, Lee JM, Rafalski A, Derose E, Gonye G, Xue Z. Global expression profiling of yeast treated with an inhibitor of amino acid biosynthesis, sulfometuron methyl. Physiol Genomics. 2000;3:83–92. doi: 10.1152/physiolgenomics.2000.3.2.83. [DOI] [PubMed] [Google Scholar]
- Jorgensen P, Nishikawa JL, Breitkreutz BJ, Tyers M. Systematic identification of pathways that couple cell growth and division in yeast. Science. 2002;297:395–400. doi: 10.1126/science.1070850. [DOI] [PubMed] [Google Scholar]
- Jorgensen P, Rupes I, Sharom JR, Schneper L, Broach JR, Tyers M. A dynamic transcriptional network communicates growth potential to ribosome synthesis and critical cell size. Genes Dev. 2004;18:2491–2505. doi: 10.1101/gad.1228804. [DOI] [PMC free article] [PubMed] [Google Scholar]
- Kaiser P, Flick K, Wittenberg C, Reed SI. Regulation of transcription by ubiquitination without proteolysis: Cdc34/SCF(Met30)-mediated inactivation of the transcription factor Met4. Cell. 2000;102:303–314. doi: 10.1016/s0092-8674(00)00036-2. [DOI] [PubMed] [Google Scholar]
- Kuras L, Barbey R, Thomas D. Assembly of a bZIP-bHLH transcription activation complex: formation of the yeast Cbf1-Met4-Met28 complex is regulated through Met28 stimulation of Cbf1 DNA binding. EMBO J. 1997;16:2441–2451. doi: 10.1093/emboj/16.9.2441. [DOI] [PMC free article] [PubMed] [Google Scholar]
- Kuras L, Cherest H, Surdin-Kerjan Y, Thomas D. A heteromeric complex containing the centromere binding factor 1 and two basic leucine zipper factors, Met4 and Met28, mediates the transcription activation of yeast sulfur metabolism. EMBO J. 1996;15:2519–2529. [PMC free article] [PubMed] [Google Scholar]
- Kuras L, Rouillon A, Lee T, Barbey R, Tyers M, Thomas D. Dual regulation of the Met4 transcription factor by ubiquitin-dependent degradation and inhibition of promoter recruitment. Mol Cell. 2002;10:69–80. doi: 10.1016/s1097-2765(02)00561-0. [DOI] [PubMed] [Google Scholar]
- Kuras L, Thomas D. Identification of the yeast methionine biosynthetic genes that require the centromere binding factor 1 for their transcriptional activation. FEBS Lett. 1995;367:15–18. doi: 10.1016/0014-5793(95)00528-h. [DOI] [PubMed] [Google Scholar]
- Lee TA, Jorgensen P, Bognar AL, Peyraud C, Thomas D, Tyers M. Dissection of combinatorial control by the Met4 transcriptional complex. Mol Biol Cell. 2010;21:456–469. doi: 10.1091/mbc.E09-05-0420. [DOI] [PMC free article] [PubMed] [Google Scholar]
- Lee TI, et al. Transcriptional regulatory networks in Saccharomyces cerevisiae. Science. 2002;298:799–804. doi: 10.1126/science.1075090. [DOI] [PubMed] [Google Scholar]
- Leroy C, Cormier L, Kuras L. Independent recruitment of mediator and SAGA by the activator Met4. Mol Cell Biol. 2006;26:3149–3163. doi: 10.1128/MCB.26.8.3149-3163.2006. [DOI] [PMC free article] [PubMed] [Google Scholar]
- Li Z-S, Lu Y-P, Zhen R-G, Szczypka M, Thiele DJ, Rea PA. A new pathway for vacuolar cadmium sequestration in Saccharomyces cerevisiae: YCF1-catalyzed transport of bis(glutathionato)cadmium. Proc Natl Acad Sci USA. 1997;94:42–47. doi: 10.1073/pnas.94.1.42. [DOI] [PMC free article] [PubMed] [Google Scholar]
- Longtine MS, McKenzie A, 3rd, Demarini DJ, Shah NG, Wach A, Brachat A, Philippsen P, Pringle JR. Additional modules for versatile and economical PCR-based gene deletion and modification in Saccharomyces cerevisiae. Yeast. 1998;14:953–961. doi: 10.1002/(SICI)1097-0061(199807)14:10<953::AID-YEA293>3.0.CO;2-U. [DOI] [PubMed] [Google Scholar]
- Machanick P, Bailey TL. MEME-ChIP: motif analysis of large DNA datasets. Bioinformatics. 2011;27:1696–1697. doi: 10.1093/bioinformatics/btr189. [DOI] [PMC free article] [PubMed] [Google Scholar]
- Menant A, Baudouin-Cornu P, Peyraud C, Tyers M, Thomas D. Determinants of the ubiquitin-mediated degradation of the Met4 transcription factor. J Biol Chem. 2006;281:11744–11754. doi: 10.1074/jbc.M600037200. [DOI] [PubMed] [Google Scholar]
- Menon BB, Sarma NJ, Pasula S, Deminoff SJ, Willis KA, Barbara KE, Andrews B, Santangelo GM. Reverse recruitment: the Nup84 nuclear pore subcomplex mediates Rap1/Gcr1/Gcr2 transcriptional activation. Proc Natl Acad Sci USA. 2005;102:5749–5754. doi: 10.1073/pnas.0501768102. [DOI] [PMC free article] [PubMed] [Google Scholar]
- Oliveros JC. VENNY. An interactive tool for comparing lists with Venn diagrams. 2007 Available at: http://bioinfogp.cnb.csic.es/tools/venny/index.html. Accessed 1 September 2011. [Google Scholar]
- Ouni I, Flick K, Kaiser P. A transcriptional activator is part of an SCF ubiquitin ligase to control degradation of its cofactors. Mol Cell. 2010;40:954–964. doi: 10.1016/j.molcel.2010.11.018. [DOI] [PMC free article] [PubMed] [Google Scholar]
- Patton EE, Peyraud C, Rouillon A, Surdin-Kerjan Y, Tyers M, Thomas D. SCF(Met30)-mediated control of the transcriptional activator Met4 is required for the G(1)-S transition. EMBO J. 2000;19:1613–1624. doi: 10.1093/emboj/19.7.1613. [DOI] [PMC free article] [PubMed] [Google Scholar]
- Patton EE, Willems AR, Sa D, Kuras L, Thomas D, Craig KL, Tyers M. Cdc53 is a scaffold protein for multiple Cdc34/Skp1/F-box protein complexes that regulate cell division and methionine biosynthesis in yeast. Genes Dev. 1998;12:692–705. doi: 10.1101/gad.12.5.692. [DOI] [PMC free article] [PubMed] [Google Scholar]
- Pereira Y, Lagniel G, Godat E, Baudouin-Cornu P, Junot C, Labarre J. Chromate causes sulfur starvation in yeast. Toxicol Sci. 2008;106:400–412. doi: 10.1093/toxsci/kfn193. [DOI] [PubMed] [Google Scholar]
- Pokholok DK, Zeitlinger J, Hannett NM, Reynolds DB, Young RA. Activated signal transduction kinases frequently occupy target genes. Science. 2006;313:533–536. doi: 10.1126/science.1127677. [DOI] [PubMed] [Google Scholar]
- Ren B, et al. Genome-wide location and function of DNA binding proteins. Science. 2000;290:2306–2309. doi: 10.1126/science.290.5500.2306. [DOI] [PubMed] [Google Scholar]
- Robinson MD, Grigull J, Mohammad N, Hughes TR. FunSpec: a web-based cluster interpreter for yeast. BMC Bioinformatics. 2002;3:35. doi: 10.1186/1471-2105-3-35. [DOI] [PMC free article] [PubMed] [Google Scholar]
- Rouillon A, Barbey R, Patton EE, Tyers M, Thomas D. Feedback-regulated degradation of the transcriptional activator Met4 is triggered by the SCF(Met30)complex. EMBO J. 2000;19:282–294. doi: 10.1093/emboj/19.2.282. [DOI] [PMC free article] [PubMed] [Google Scholar]
- Rouillon A, Surdin-Kerjan Y, Thomas D. Transport of sulfonium compounds. Characterization of the S-adenosylmethionine and S-methylmethionine permeases from the yeast Saccharomyces cerevisiae. J Biol Chem. 1999;274:28096–28105. doi: 10.1074/jbc.274.40.28096. [DOI] [PubMed] [Google Scholar]
- Saldanha AJ. Java Treeview—extensible visualization of microarray data. Bioinformatics. 2004;20:3246–3248. doi: 10.1093/bioinformatics/bth349. [DOI] [PubMed] [Google Scholar]
- Siggers T, Duyzend MH, Reddy J, Khan S, Bulyk ML. Non-DNA-binding cofactors enhance DNA-binding specificity of a transcriptional regulatory complex. Mol Syst Biol. 2011;7:555. doi: 10.1038/msb.2011.89. [DOI] [PMC free article] [PubMed] [Google Scholar]
- Su NY, Flick K, Kaiser P. The F-box protein Met30 is required for multiple steps in the budding yeast cell cycle. Mol Cell Biol. 2005;25:3875–3885. doi: 10.1128/MCB.25.10.3875-3885.2005. [DOI] [PMC free article] [PubMed] [Google Scholar]
- Su NY, Ouni I, Papagiannis CV, Kaiser P. A dominant suppressor mutation of the met30 cell cycle defect suggests regulation of the Saccharomyces cerevisiae Met4-Cbf1 transcription complex by Met32. J Biol Chem. 2008;283:11615–11624. doi: 10.1074/jbc.M708230200. [DOI] [PMC free article] [PubMed] [Google Scholar]
- Thomas D, Cherest H, Surdin-Kerjan Y. Elements involved in S-adenosylmethionine-mediated regulation of the Saccharomyces cerevisiae MET25 gene. Mol Cell Biol. 1989;9:3292–3298. doi: 10.1128/mcb.9.8.3292. [DOI] [PMC free article] [PubMed] [Google Scholar]
- Thomas D, Jacquemin I, Surdin-Kerjan Y. MET4, a leucine zipper protein, and centromere-binding factor 1 are both required for transcriptional activation of sulfur metabolism in Saccharomyces cerevisiae. Mol Cell Biol. 1992;12:1719–1727. doi: 10.1128/mcb.12.4.1719. [DOI] [PMC free article] [PubMed] [Google Scholar]
- Thomas D, Kuras L, Barbey R, Cherest H, Blaiseau PL, Surdin-Kerjan Y. Met30p, a yeast transcriptional inhibitor that responds to S-adenosylmethionine, is an essential protein with WD40 repeats. Mol Cell Biol. 1995;15:6526–6534. doi: 10.1128/mcb.15.12.6526. [DOI] [PMC free article] [PubMed] [Google Scholar]
- Thomas D, Surdin-Kerjan Y. Metabolism of sulfur amino acids in Saccharomyces cerevisiae. Microbiol Mol Biol Rev. 1997;61:503–532. doi: 10.1128/mmbr.61.4.503-532.1997. [DOI] [PMC free article] [PubMed] [Google Scholar]
- Topalidou I, Thireos G. Gcn4 occupancy of open reading frame regions results in the recruitment of chromatin-modifying complexes but not the mediator complex. EMBO Rep. 2003;4:872–876. doi: 10.1038/sj.embor.embor931. [DOI] [PMC free article] [PubMed] [Google Scholar]
- Uria-Nickelsen MR, Leadbetter ER, Godchaux W., 3rd Sulfonate-sulfur assimilation by yeasts resembles that of bacteria. FEMS Microbiol Lett. 1993;114:73–77. doi: 10.1016/0378-1097(93)90144-q. [DOI] [PubMed] [Google Scholar]
- Willems AR, Lanker S, Patton EE, Craig KL, Nason TF, Mathias N, Kobayashi R, Wittenberg C, Tyers M. Cdc53 targets phosphorylated G1 cyclins for degradation by the ubiquitin proteolytic pathway. Cell. 1996;86:453–463. doi: 10.1016/s0092-8674(00)80118-x. [DOI] [PubMed] [Google Scholar]
- Yen JL, Su NY, Kaiser P. The yeast ubiquitin ligase SCFMet30 regulates heavy metal response. Mol Biol Cell. 2005;16:1872–1882. doi: 10.1091/mbc.E04-12-1130. [DOI] [PMC free article] [PubMed] [Google Scholar]
Associated Data
This section collects any data citations, data availability statements, or supplementary materials included in this article.