

Abstract
This study used molecular beacon technology to examine substrate-dependent changes in integrin subunit expression in living cells. Molecular beacons are oligonucleotide probes that can be delivered into live cells to allow for real-time imaging of mRNA. They have a stem-loop hairpin structure with a fluorophore-quencher pair, which opens when bound to the target mRNA sequence, resulting in a fluorescent signal upon excitation. A novel molecular beacon that is specific to the β1 integrin subunit mRNA was developed and used to image osteoblast-like MG63 cells in vitro on both glass and titanium surfaces of varying roughness. Specificity was verified by comparing the molecular beacon signal intensities to real-time PCR results in both wild-type cells and cells with shRNA knockdown of β1 integrin mRNA. The molecular beacon was able to detect changes due to both surface microtopography and silencing of the mRNA target. The results showed that effects of the substrate on β1 mRNA noted previously in confluent cultures were evident in pre-confluent cells as well, supporting the hypothesis that β1 integrin pairs are important in proliferation as well as differentiation of osteoblasts. This technique overcomes the limitations of traditional gene assays (PCR, immunofluorescence) by allowing for the real-time measurement and tracking of specific mRNAs in individual live cells prior to confluence.
Keywords: Gene expression, Molecular imaging, Osteoblast, Titanium, Integrin
Introduction
Titanium surfaces are widely used clinically in a variety of both dental and orthopaedic applications due to its passivating oxide layer and a modulus of elasticity that is similar to bone [1]. Both surface chemistry and microtopography have an effect on osteoblast response to titanium implants [2-4]. Resulting changes in protein adsorption to the surface affect the development of focal adhesions of the cells, potentially altering their proliferation and downstream differentiation [2, 3, 5]. In vitro studies have shown that when mesenchymal stem cells and osteoprogenitor cells are grown on microtextured surfaces, cell number is reduced in comparison to cells on smooth titanium substrates and the cells exhibit a more differentiated phenotype that is similar to mature osteoblasts [4, 6-8]. Moreover, osteoblasts are more responsive to systemic regulators, such as 1,25-dihydroxy vitamin D3 [1α,25(OH)2D3], when they are cultured on microtextured titanium in comparison to cells grown on smooth titanium substrates or tissue culture polystyrene (TCPS) [3, 9, 10].
Integrins play an important role in controlling these changes in cell behaviour based on surface topography [4, 8]. Integrins form heterodimeric pairs that link the cytoskeleton of the cell to extracellular matrix proteins. Various combinations of alpha (α) and beta (β) subunits bind to different proteins, affecting intracellular signalling pathways [11, 12]. One of the major determinants mediating the effects of surface microtopography on cells in the osteoblast lineage is the interaction of integrins with proteins adsorbed on the material surface or in the cell's extracellular matrix [4, 13]. The observation that the β1 subunit is increased on microtextured substrates and that its expression is further increased by treatment with 1α,25(OH)2D3 [4, 9], suggested that it may play a role in mediating the response of osteoblastic cells to the surface. The β1-subunit partners with several different alpha subunits, including α5 and α2 [14, 15]. Others have shown that α5β1 is involved in osteoblast differentiation on tissue culture polystyrene [16], but this is not the case for osteoblasts grown on either smooth or microtextured titanium. Instead, the α5β1 integrin is involved in initial cell attachment and proliferation [17], whereas integrin α2β1 is required for osteoblast differentiation on titanium substrates with micron scale and submicron scale roughness [8]. Silencing the β1 subunit prevents the increase in differentiation associated with microtextured titanium over that seen on smooth titanium [4], confirming its importance in mediating the response of osteoblasts to micron scale roughness.
The studies described above are only able to assess integrin expression at discrete points in time and by necessity show an average behaviour of a culture rather than changes that may be occurring in specific cells. The use of immunohistochemistry to study integrin expression is limited because the development of focal adhesions on the material surface makes is difficult for the antibody to bind to the surface proteins. Techniques such as Real-time PCR and western blotting require lysates from a large number of cells; making it impractical to study integrin expression at early pre-confluent time points. This renders these assays impractical for studying small populations of cells that are typically seen when cells are pre-confluent or when they are in an environment that has decreased proliferation [4]. Moreover, those methods cannot be applied to the monitoring of target molecules in the same cells as they require the lysis of cells. In order to address these limitations, we have developed a novel molecular beacon that can be used to study integrin expression in live cells at pre-confluent time points.
Molecular beacons are oligonucleotide probes consisting of a loop that is complementary to a specific mRNA sequence and a short stem with a fluorophore and a quencher conjugated [18]. This allows a molecular beacon to form a stable stem-loop hairpin structure when no target mRNA is present. Hybridization to the target mRNA sequence opens the molecular beacon, separating the fluorophore from the quencher, and allows for a fluorescent signal upon excitation [1, 2]. Molecular beacons offer significant advantages over traditional gene expression assays, such as real-time PCR and in situ hybridization, because they provide the ability to detect real-time changes in gene expression in single living cells [19-21]. A variety of techniques exist to deliver molecular beacons into cells, but they may require long delivery times [22], cause damage to cells [23], and are susceptible to endosomal degradation [24]. An alternative delivery method involves the use of streptolysin O (SLO) to deliver the beacons through a reversible permeabilization of the cell membrane; allowing for rapid, non-damaging, non-endocytotic delivery of molecular beacons into cells [25].
This study used molecular beacon technology to test the hypothesis that integrin expression in osteoblasts is an early adaptation to substrate chemical and physical properties. We developed molecular beacons targeted to the β1-integrin subunit mRNA in order to visualize surface-dependent changes in its expression in individual osteoblast-like MG63 cells. Specificity of the probes was validated using an MG63 cell line stably silenced for this integrin subunit. In addition, we developed a new methodology for visualizing and quantifying molecular beacon fluorescence on opaque titanium substrates with complex surface architecture.
Materials and Methods
Molecular Beacon Design and Synthesis
Six molecular beacons targeting different segments of the β1 mRNA, along with one random sequence molecular beacon as negative control were designed, synthesized, and tested. Each of the β1-targeting molecular beacons targets a sequence unique to the human β1 mRNA (NM_002211) according to BLAST search results (Table 1). Specifically, molecular beacons were designed to target a β1 exon-exon junction (MB1060), in-situ hybridization sites (MB639, MB899, and MB1695), and a siRNA target site previously identified (MB2103) [4]. A random sequence molecular beacon, with a sequence not match to any reported mammalian gene sequence, was used as a negative control. The beacons were labelled according to the location they target on the integrin β1 mRNA.
Table 1.
Sequence, target, and theoretical temperatures for all molecular beacons designed. The beacons were designed so that the complementary region of the beacon was identical to the in situ probe. The calculations were performed with the MFOLD program assuming the following conditions: 100mM Na+, 5mM Mg++, 37°C.
| Molecular Beacon | Sequence | Hairpin Melting Temperature | Duplex | Duplex | Site Target |
|---|---|---|---|---|---|
| DNA | RNA | ||||
| MB639 | cgacgAGTAATCCTCC TCATTTCAcgtcg | 56.2°C | 56.4°C | 67.1C | In situ Probe |
| MB899 | cgtcgAGTGATCCACA AACTGCAAcgacg | 56.2°C | 61.3°C | 64.0°C | In situ Probe |
| MB1060 | cgtatcGAAGGATAATC ATAATAATGgatacg | 47.9°C | 49.8°C | 45.6°C | Exon Junction |
| MB1695 | cgacgTCTCCATTGTTA CTGCAGATTcgtcg | 53.8°C | 61.1°C | 70.6°C | In situ Probe |
| MB2103 | cgtatcGAACATTCCTG TGTGCATGTgatacg | 46.3°C | 62.8°C | 70.5°C | siRNA |
| Random | cgtcgCAGATACACTT CAGATAGGATcgacg | 53.3°C | ---- | ---- | In situ Probe |
All molecular beacons were synthesized by Biosearch Technologies (Novato, CA) with a DNA backbone labelled with a Quasar 570 dye molecule at the 5′ end and a Black Hole Quencher-2 (BHQ-2) at the 3′ end. Ideal hairpin melting temperatures were calculated using the MFOLD program [26, 27]. All calculations performed with this program were based on the following conditions: 37°C, 100 mM NaCl, 5 mM MgCl2, with 200nM molecular beacons and target concentrations [27].
Beta-1 Silencing
MG63 cells (ATCC, Manassas, VA) were plated at 20,000 cells/cm2 and incubated overnight at 37°C in a 5% CO2 and 100% humidity atmosphere. Five different lentiviral transduction particles, labelled D1 through D5 (Sigma-Aldrich, St. Louis, MO), containing shRNA sequences specific to the β1 gene (NM-002211.3) were added to the cells at 7.5 MOI and incubated for 18 hours. After incubation, transduced cells were selected with 0.25 μg/mL puromycin (Sigma-Aldrich) for 12 days in culture. After puromycin selection, β1 silenced cells were fed media containing 0.25 μg/mL puromycin every 48 hours until used in the experiment. The silencing was initially verified by real-time PCR and western blot after plating the cells at 10,000 cells/cm2 and culturing them until confluence with media containing Dulbecco's modification of Eagle medium (DMEM) supplemented with 10% FBS and 1% penicillin+streptomycin (P/S). Real-time PCR showed that the particle D2 resulted in the greatest reduction (68%) in the expression of integrin β1 (Fig. 1). The cells transduced with the D2 particles were used for the remainder of the silencing studies and are referred to as shRNA MG63 cells.
Figure 1.
Real-time PCR comparing silencing efficiency of five shRNA plasmids (D1-D5). The D2 shRNA particles resulted in the greatest silencing of the integrin β1 on TCPS with a 68% reduction in gene expression, as compared to wild-type MG63 cells grown on TCPS.
Real-time Measurements of Integrin β1 mRNA
Real-time PCR was used to determine the effect of surface chemistry (glass vs. PT) and microtopography (PT vs. SLA) on the level of gene expression of the β1 integrin. Wild-type MG63 and shRNA MG63 cells were plated on TCPS, glass chamber slides, commercially pure titanium disks (PT, Ra<0.2μm), and a sand-blasted/acid etched titanium surface (SLA, Ra=3-4μm) at 10,000 cells/cm2 and incubated at 37°C in a 5% CO2 and 100% humidity atmosphere. The TCPS was used as a control to determine when the cells reached confluence. The glass chamber slides are the traditional surface used for molecular beacon imaging and were used as the control substrate for the remainder of the experiments in this paper. The cells were fed three times weekly with DMEM supplemented with 10% FBS and 1% P/S. This same medium was used for all experiments unless otherwise noted. Total RNA was extracted from confluent cultures (based on visual confluence on TCPS or glass) using TRIzol® reagent (Invitrogen). Reverse transcription was performed on 0.75μg of RNA using the Amersham-Pharmacia-Biotech RT kit (Amersham Biosciences, Piscataway, NJ). The following oligonucleotide primers specific for the human integrin β1 subunit were designed using Beacon Designer Software 2.0 (MWG Biotech, Huntsville, AL): 5′-ATCTGTGTGCCTGACCTG-3′ (sense), 5′-TCCTCCTCATTTCATTCATC-3′ (antisense). In addition, a primer specific for the endogenous gene GAPDH was used to normalize the expression levels. Real-time PCR was performed in an iCycler (I-Cycler I, v3a, Bio-Rad). Each real-time PCR reaction was performed with the following reagents: 12.5μl SYBR green, 200ng each of sense and antisense primer, 25mM MgCl2, and 3 μl of the reverse transcription product, and the appropriate volume of nuclease free water to bring the total reaction volume to 25μL. The amplifications were performed at 57.4°C for 40 cycles for both genes studied.
In addition to experiments performed using confluent cultures, the level of β1 expression was also determined using preconfluent cultures that had been plated on glass at 5,000 cells/cm2 and grown for 72 hours. These are the same conditions that were used for imaging using the molecular beacons and served as a comparison between the two techniques. Total RNA was extracted using TRIzol® (Invitrogen) and the extracts from four wells were combined to make up one sample in order to obtain sufficient RNA to run the PCR assays. The reduction in cell number seen on the PT and rougher SLA surfaces in comparison to glass made it impractical to perform real-time PCR on the titanium surfaces at this pre-confluent time point [4].
Molecular Beacon Delivery and Imaging
Wild-type MG63 cells or shRNA MG63 cells were cultured as described above. Three days (72 hours) after plating, molecular beacons were delivered into live cells using reversible permeabilization with activated SLO (Sigma). SLO was activated by incubating 2U/mL SLO with 5mM TCEP (Sigma) for 30 min at 37°C. Cells were then incubated for 15 minutes in 250μL serum free OPTI-MEM® (Invitrogen) containing 0.1 U/mL activated SLO and 1μM of molecular beacon solution. Cell membranes were then allowed to reseal post delivery by aspirating the SLO solution by adding 250μL DMEM supplemented with 10% FBS. Nuclear staining was done with Hoechst 33342 (Invitrogen) dye and then incubating cells for a further 30 min at 37°C prior to fluorescence imaging.
Live cell fluorescence imaging was performed at 37°C, with 5% CO2 using the DeltaVision™ deconvolution microscope (Applied Precision LLC, Issaquah, WA) equipped with Olympus 60X, Plan Apo N lens, numerical aperture 1.42 and a CoolSNAP_HQ2 ICX285 camera. Images were collected at 0.2μm z intervals. The same exposure times and filters (Quasar570-Cy3 filter 545/570nm, 250ms; Hoechst 33342-DAPI filter 350/460nm, 25ms) were used for all experiments. For each experiment, twenty random fields were selected and the image stack was deconvolved using the DeltaVision™ software. The beacon signal intensity inside each cell was quantified in order to correlate beacon intensity of the cells to its gene expression. This was done by making a projection by summing the image stack from each field and then setting a threshold to remove the background fluorescent signal noise. The majority of the background fluorescence can be attributed to the reflection of the molecular beacon signals off the titanium surfaces. The individual cell boundaries were identified and the intensities of all pixels within each cell were added together. This value is reported as total beacon intensity and takes into account both the number and intensity of the molecular beacon signals. The threshold and display scales were kept constant for all of the images in all of the experiments.
In situ Hybridization and Immunofluorescence
In situ hybridization was performed on wild-type MG63 cells and shRNA MG63 cells cultured under identical conditions as the cells used for molecular beacon imaging. The Cy3 fluorescent-tagged probes used for in situ hybridization were constructed by Eurofins MWG (Enerdberg, Germany) and are listed in Table 2. The in situ hybridization analysis also served as a comparison for the localization patterns seen with the molecular beacons. Cells were fixed at -20°C in methanol: acetone 50:50 v/v for 10 minutes, and washed with 5× SSC (Ambion, Austin, TX). Blocking was performed for 1hr using 2× SSC containing 0.1% Escherichia coli tRNA, 1% RNase-free BSA, 20% formamide (Ambion) at 37°C. After washing the cells with 5× SSC, a mixture of the β1 integrin probes (Table 2) was added at a final concentration of 200nM in 2× SSC containing 0.1% E. coli tRNA and 20% formamide to each well. Slides were heated to 80°C for 1 minute and incubated overnight at 37°C. A scrambled probe tagged with Cy3 was also used at the same concentration. After washing with 2× SSC cells were observed using a Zeiss S100 microscope with SensiCam High Performance Digital CCD Camera Imaging System, at room temperature (Carl Zeiss, Inc., Thornwood, NY).
Table 2.
The sequences for the β1 in situ hybridization probes. The probes used had identical sequences to the complementary region of three of the molecular beacons used. All probes were labeled with Cy3 dye at 5′ end.
| In-situ probes | Sequences |
|---|---|
| 639 | 5′ TCC ACA AAT GAG CCA AAT CCA ATT CTG AAG TCC GAA GTA ATC CTC CTC ATT TCA 3′ |
| 875 | 5′ AGC CAA TCA GTG ATC CAC AAA CTG CAA CTT GCA TGA TGG CAT CGA AAC CAC 3′ |
| 1700 | 5′ CT CTT CCT ACA AAC ACA CTG TCC GCA GAC GCA CTC TCC ATT GTT ACT GC 3′ |
| Random Control | 5′ TCG ACT GCT GAT CTA CGA CGT CGT CAT CCT GCC GAG ATA ACC GAT AAG CTG 3′ |
Immunofluorescence was performed to determine the localization of the β1 integrin protein. Cells were fixed at -20°C in methanol: acetone 50:50 v/v for 10 minutes, and washed briefly in 1× PBS at room temperature. The fixed slides were then blocked in 3% BSA/PBS for 30 minutes at room temperature. The slides were incubated with the primary antibodies against calnexin, an endoplasmic reticulum protein or the β1 integrin subunit (Abcam, Cambridge, MA) for 40 minutes followed by three washes in sterile PBS [28]. Actin co-staining was performed by co-incubating with TRITC-phalloidin (Sigma-Aldrich) in 3% BSA/PBS along with the secondary anti-mouse antibody (Alexa555, Invitrogen). The slides were incubated with secondary antibody for 40 minutes in the dark followed by three more washes in PBS. Cells were then mounted and coverslipped using “Prolong” anti-fade with Dapi mounting medium (Molecular Probes, Eugene, OR) and allowed to dry completely before imaging. All reagents used were DNA/RNase free.
Statistical Analysis
The data presented from the real-time PCR experiments represent one of three separate sets of experiments, all of which yielded similar results. The data shown for each experimental condition represent the mean±SEM from six separate samples. The data from the beacon image quantification represent the intensity information from all of the individual cells in twenty random fields from one set of two separate experiments, all of which yielded similar images. Each data point represents the mean±SEM. Data were analyzed by analysis of variance (ANOVA) and statistical significance between groups was determined by the Bonferroni modification of the Student's t-test. Significance was defined as having α=0.05 and with P<0.05.
Results
Molecular Beacon Hybridization Signals
Molecular beacons were successfully introduced into live MG63 cells using SLO. Four of the molecular beacons (MB639, MB899, MB1060, and MB1695) gave higher signal intensity than cells with the random beacon (Fig. 2), suggesting that the fluorescence signals were specific. All of the beacons showed signals diffusely distributed throughout the cytoplasm and excluded from the nucleus. It is important to note that all of the images represent a two-dimensional projection of the entire image stack, resulting in some overlap of the extra-nuclear beacon signals with the nucleus. MB639 had the greatest signal intensity and was used for the remainder of the imaging studies.
Figure 2.
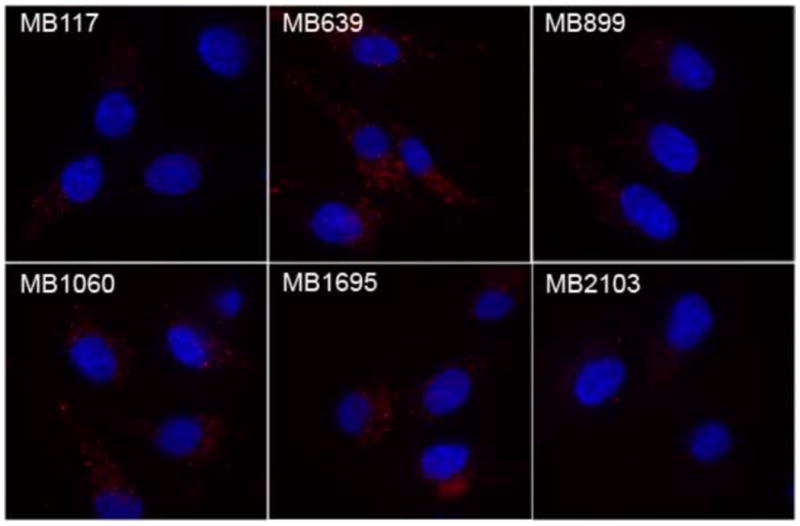
Relative intensity of six different beacon sequences in wild-type MG63 cells. The initial test showed that the molecular MB639 had the highest signal to background ratio of all the molecular beacons tested. As a result, this molecular beacon was used for the remainder of the experiments.
Knock-Down of Integrin β1 mRNA
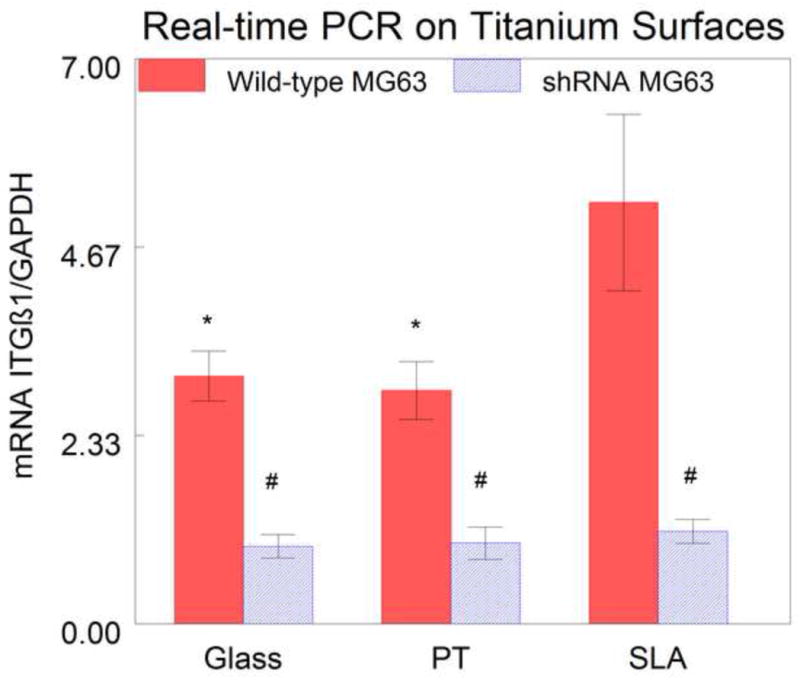
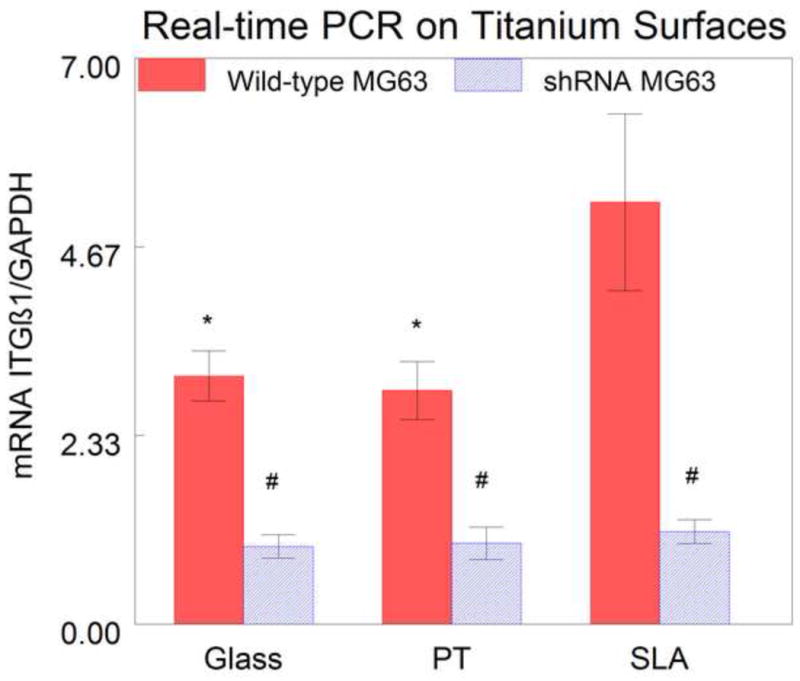
Real-time PCR of RNA isolated from confluent cultures grown on glass confirmed that silencing β1 expression was effective, with a 65% reduction in β1 mRNA in shRNA MG63 compared to wild-type MG63 cells (Fig. 3). The results also showed that β1 mRNA levels in wild-type cells were substrate dependent. Wild-type MG63 cells grown on SLA had a significantly higher level of β1 integrin expression than the cells grown on both glass and PT (Fig. 3). In contrast, β1 mRNA levels of shRNA MG63 cells were comparable on all surfaces. Preconfluent cultures of shRNA MG63 cells exhibited a 62.8% reduction in β1 mRNA in comparison with wild-type MG63 cells (Fig. 4).
Figure 3.
Real-time PCR of β1 mRNA in wild-type (blue) and shRNA (red) MG63 cells cultured on titanium surfaces. There was a decrease in the mRNA in the shRNA MG63 cells on all surfaces, compared to the wild-type MG63 cells. There was an increase in the β1 expression in the wild-type MG63 cells on SLA as compared to wild-type MG63 cells on both PT and glass. There were no differences among the shRNA MG63 on the three surfaces. (#=P<0.05 wild-type vs. shRNA, *=P<0.05 vs. wild-type SLA).
Figure 4.
Real-time PCR of β1 mRNA in wild-type (blue) and shRNA (red) MG63 cells cultured for on glass. Wild-type MG63 cells (blue) and shRNA MG63 cells (red) plated at half density and cultured for 72 hours under identical conditions to the molecular beacons experiments. There was a decrease in the β1 integrin mRNA in the silenced cells on glass. (#=P<0.05 wild-type vs. shRNA,*=P<0.05 vs. MG63 on SLA).
Molecular Beacon Imaging and Quantification
In both wild-type and shRNA MG63 cells grown on glass, signals from the β1–targeting molecular beacons exhibited a similar pattern of very diffuse signals spread evenly throughout the cytoplasm and excluded from the nucleus (Fig. 5A and 5B). The only apparent difference between the samples was a decrease in signal intensity from the β1 shRNA cells in comparison with the wild-type MG63 cells. Quantification of total signal intensity in pre-confluent cultures of shRNA MG63 cells grown on glass indicated that integrin β1 expression in shRNA MG63 cells was 65.0% of the signal intensity of wild-type MG63 cells (Fig. 6).
Figure 5.
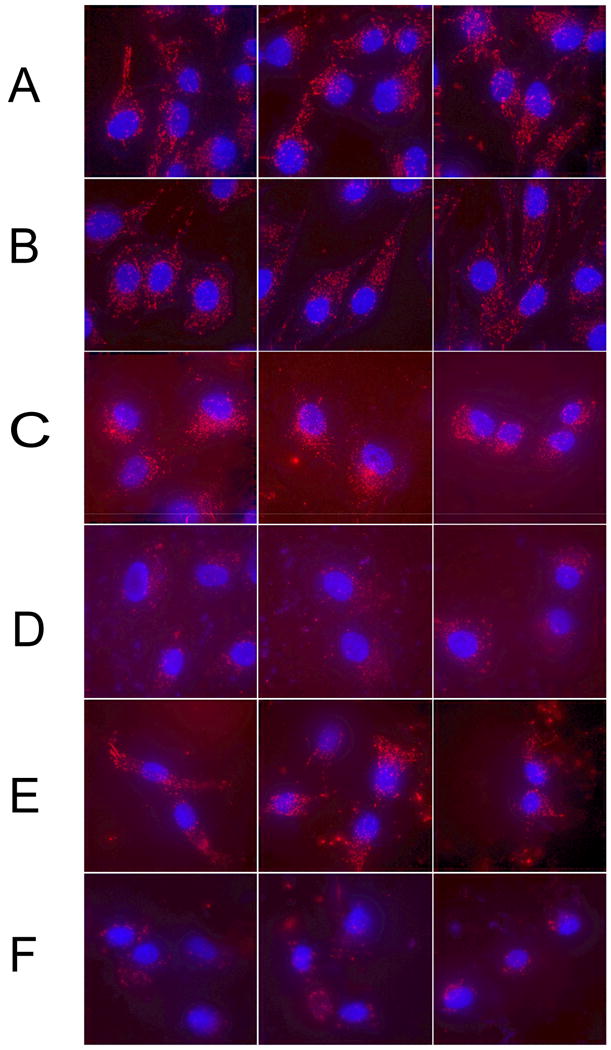
Comparison of molecular beacon signals from wild-type MG63 cells on glass (A), shRNA MG63 cells on glass (B), wild-type MG63 cells on PT (C), shRNA MG63 cells on PT (D), wild-type MG63 cells on SLA (E), and shRNA MG63 cells on SLA (E). The beacons signals (red) were found diffusely throughout the cytoplasm and excluded from the nucleus (blue).
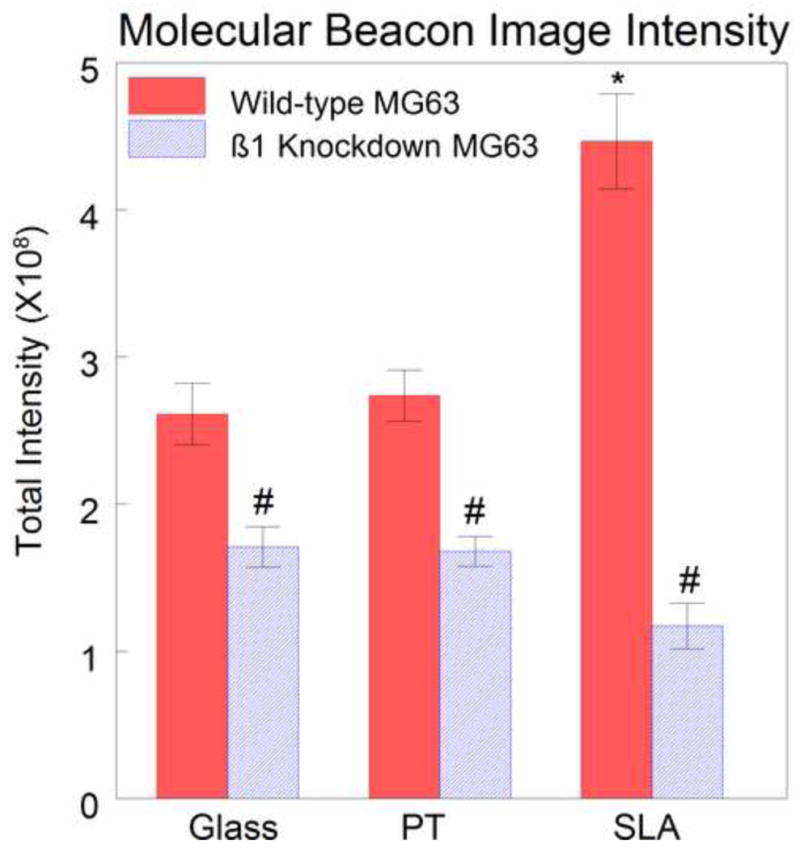
Figure 6.
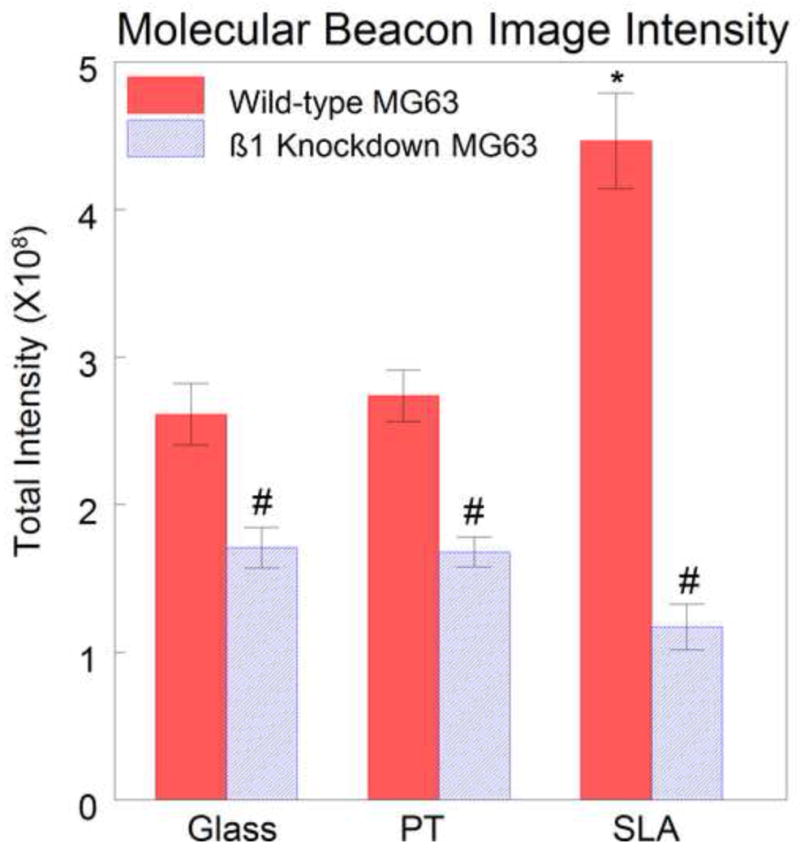
Quantification of molecular beacon images. There was a 35.0% decrease in the signal intensity in the shRNA MG63 cells compared to wild-type MG63 cells on glass, a 38.7% decrease on PT, and 60.3% decrease on SLA. There was a difference in intensity between wild-type MG63 cells on SLA and wild-type cells on glass and PT. There was no surface-dependent difference in shRNA MG63 cells cultured. (#=P<0.001 wild-type vs. shRNA, *P<0.01 vs wild-type SLA).
Molecular beacon signals from wild-type and shRNA MG63 cells grown on PT and SLA surfaces also exhibited a diffuse distribution in the cytoplasm and excluded from the nucleus (Figs. 5C, D, E, and F). The total molecular beacon intensity in shRNA MG63 cells on the PT surfaces was 61.3% of that in wild-type MG63 cells (Fig. 6). On the SLA surfaces, however, the signal intensity of the shRNA MG63 cells was 39.7% of the wild-type MG63 cells (Fig. 6). On both PT and SLA, extracellular beacon signals were also seen in the vicinity of the cells (Figs. 5C and 5E). This may be due to non-specific binding of beacons to different proteins adsorbed onto the titanium surface compared to the glass surfaces. These extracellular signals were not included in the data analysis as they were external to the cells.
Immunofluorescence and In Situ Hybridization of Integrin β1 Protein
The decrease in integrin β1 mRNA also corresponded to a decrease in immunofluorescent protein levels in the shRNA MG63 cells on all surfaces tested (Fig. 7). Wild-type MG63 cells on glass, PT, and SLA all showed the same diffuse localization of β1 integrin throughout the cytoplasm of the cells as seen with the beacon signals. In β1 knock-down cells, the intensity of the β1 integrin protein signal was reduced. As with the molecular beacon images, the integrin signals were found diffusely throughout the cytoplasm and excluded from the nucleus. In situ hybridization with fluorescent-tagged probes having similar sequences to the molecular beacons tested confirmed that mRNA for the β1 integrin had the same diffuse localization pattern all throughout the cytoplasm. In addition, the mRNA co-localized with calnexin in the endoplasmic reticulum (Fig. 8).
Figure 7.
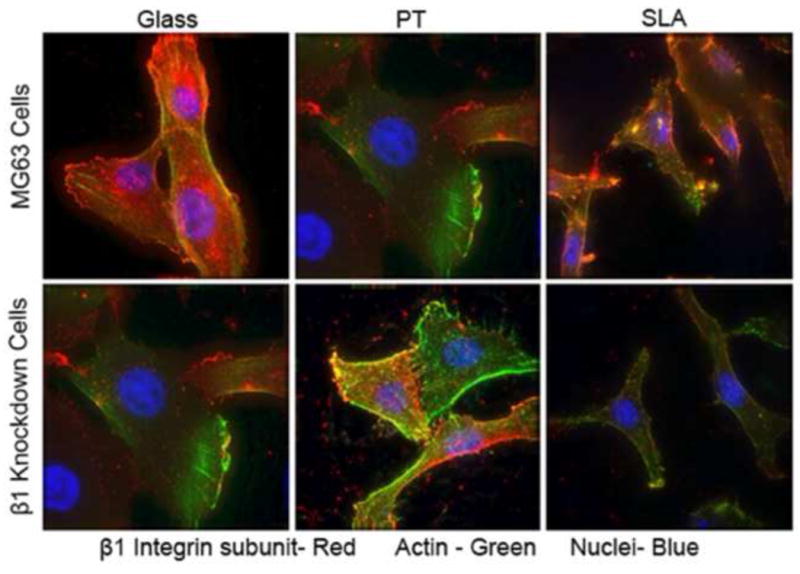
Effect of β1 silencing on β1 integrin subunit protein levels in MG63 cells cultured on titanium substrates. The β1 integrin was detected by immunofluorescence using a specific antibody to the protein (red). Actin was visualized using TRITC-phalloidin (green) and the nuclei using DAPI (blue). The images show the same diffuse pattern of the β1 mRNA (red) throughout the cell and excluded from the nucleus.
Figure 8.
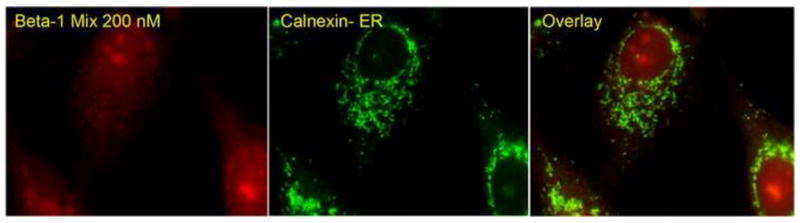
In situ hybridization of integrin β1 mRNA. In wild-type MG63 cells the integrin β1 mRNA (red) was found to be distributed diffusely throughout the cell and was found to partially colocalize with an endoplasmic reticulum protein calnexin (green).
Discussion
This study demonstrates that molecular beacons provide a reliable tool to study integrin expression in live osteoblast-like MG63 cells prior to reaching confluence. Specifically, we identified a molecular beacon design (MB639) that gave a high, specific signal in targeting β1 integrin mRNA in cells grown on titanium surfaces with varying roughness. Moreover, the signal intensities were positively correlated with real-time PCR measurements of mRNA. To our knowledge, this is the first demonstration of the use of molecular beacons to quantify gene expression in live cells on metal surfaces and the first demonstration that mRNA in individual cells can be imaged and quantified on an opaque substrate. The results of this study confirm our previous observations using real time PCR of mRNA isolated from whole cell populations that expression of β1 integrin is greater in MG63 cells cultured on titanium substrates rather than on TCPS or glass, and that it is increased in cells grown on titanium with a rough microtopography [4, 9]. Moreover, the effect of the substrate on β1 integrin expression was evident in preconfluent MG63 cells, supporting the hypothesis that β1-integrin pairs are involved in surface-dependent proliferation as well as osteoblastic differentiation [4, 17].
Traditionally, differences in the baseline intensity of molecular beacons between experiments have made it difficult to compare experiments that were not conducted at the same time. In the present study, however, the results demonstrated that molecular beacon intensity was positively correlated with real-time PCR measurements, supporting the conclusion that molecular beacon signals accurately reflected cellular mRNA levels. In addition to the intensity quantification, sub-cellular molecular beacon localization was confirmed by both immunofluorescence and in-situ hybridization.
MG63 cells that were silenced for β1 integrin had lower beacon signals than wild-type MG63 cells. This differential expression was retained in cultures grown on glass and titanium, and there were essentially no differences in β1 integrin mRNA on these two substrates. In contrast, when the cells were cultured on SLA, fluorescence signal intensity from β1-targeting beacons was increased in wild-type cells but unchanged in shRNA MG63 cells, reflecting the increase in β1 integrin expression on the microtextured surfaces noted previously in wild-type MG63 cells [9]. Even though the studies on the different surfaces were performed at different times, the baseline intensity value showed minimal variation and the trends were identical to those seen with real-time PCR.
An increase in surface roughness results in an increase in the β1 integrin expression and that silencing the β1 integrin blocks the cellular response to the different surfaces when the cells reach confluence [4]. The results of molecular beacon fluorescence intensity obtained this study provide evidence that cells behave similarly prior to reaching confluence. There was a significant increase in the fluorescence signal intensity when wild-type MG63 cells were grown on rougher surfaces, but there were no differences in the signal intensity of the shRNA MG63 cells on different surfaces. This suggests that in pre-confluent cells, like cells at confluence, the β1 integrin plays a major role in directing the cellular response to surface roughness.
Molecular beacons offer significant advantages over traditional techniques because they allow for real-time imaging of individual live cells. More specifically, they overcome the need to have a large number of cells for real-time PCR as well as the need to fix cells for molecular imaging techniques such as in situ hybridization, both limit the ability to investigate how integrin attachment modulates initial cellular attachment up to the point when cells achieve confluence. The method presented in this study overcomes these limitations and provides a reliable tool to track real-time changes in gene expression in living cells over short periods of time. Additionally, the molecular beacons approach allows for the study of changes in mRNA localization in the same live cells.
As with other molecular beacon applications, the length of time that the cells can be imaged is limited by the increase in non-specific signals due to beacon degradation and/or non-specific interaction. It is possible to reduce beacon degradation by changing the beacon backbone from DNA to 2′-O-Methyl [28]. The potential drawback of using this backbone is that it has a higher affinity to the target mRNA thus may interfere with gene translation. The increase in non-specific signals could be addressed by using a dual-FRET molecular beacon approach to target the β1 integrin [29]. However, due to the need to have two molecular beacons binding to the same target mRNA, there might be a decrease in sensitivity and the signal level could be limited due to mRNA accessibility.
Conclusion
This study provides a method to reliably track and quantify gene expression in individual cells on different surfaces. The molecular beacon developed showed similar localization patterns to immunofluorescence and quantification similar to real-time PCR results. The molecular beacon techniques were able to detect changes in gene expression due to both changes in surface roughness and silencing of the β1 integrin, and showed that substrate-dependent differences in β1 integrin subunit mRNA are present in preconfluent cells. The techniques described in the paper overcome the limitations of traditional techniques by allowing for real-time imaging of individual live cells.
Acknowledgments
This work was supported by US PHS Grants AR052102, CA119338, and HL80711, as well as Children's Healthcare of Atlanta. The authors thank Sharon Hyzy for her assistance.
Footnotes
Publisher's Disclaimer: This is a PDF file of an unedited manuscript that has been accepted for publication. As a service to our customers we are providing this early version of the manuscript. The manuscript will undergo copyediting, typesetting, and review of the resulting proof before it is published in its final citable form. Please note that during the production process errors may be discovered which could affect the content, and all legal disclaimers that apply to the journal pertain.
References
- 1.Lim YJ, Oshida Y, Andres CJ, Barco MT. Surface characterizations of variously treated titanium materials. Int J Oral Maxillofac Implants. 2001;16:333–42. [PubMed] [Google Scholar]
- 2.Schwartz Z, Lohmann CH, Oefinger J, Bonewald LF, Dean DD, Boyan BD. Implant surface characteristics modulate differentiation behavior of cells in the osteoblastic lineage. Adv Dent Res. 1999;13:38–48. doi: 10.1177/08959374990130011301. [DOI] [PubMed] [Google Scholar]
- 3.Schwartz Z, Lohmann CH, Vocke AK, Sylvia VL, Cochran DL, Dean DD, et al. Osteoblast response to titanium surface roughness and 1alpha,25-(OH)(2)D(3) is mediated through the mitogen-activated protein kinase (MAPK) pathway. J Biomed Mater Res. 2001;56:417–26. doi: 10.1002/1097-4636(20010905)56:3<417::aid-jbm1111>3.0.co;2-k. [DOI] [PubMed] [Google Scholar]
- 4.Wang L, Zhao G, Olivares-Navarrete R, Bell BF, Wieland M, Cochran DL, et al. Integrin beta1 silencing in osteoblasts alters substrate-dependent responses to 1,25-dihydroxy vitamin D3. Biomaterials. 2006;27:3716–25. doi: 10.1016/j.biomaterials.2006.02.022. [DOI] [PubMed] [Google Scholar]
- 5.Rupp F, Scheideler L, Rehbein D, Axmann D, Geis-Gerstorfer J. Roughness induced dynamic changes of wettability of acid etched titanium implant modifications. Biomaterials. 2004;25:1429–38. doi: 10.1016/j.biomaterials.2003.08.015. [DOI] [PubMed] [Google Scholar]
- 6.Martin JY, Schwartz Z, Hummert TW, Schraub DM, Simpson J, Lankford J, Jr, et al. Effect of titanium surface roughness on proliferation, differentiation, and protein synthesis of human osteoblast-like cells (MG63) J Biomed Mater Res. 1995;29:389–401. doi: 10.1002/jbm.820290314. [DOI] [PubMed] [Google Scholar]
- 7.Lohmann CH, Tandy EM, Sylvia VL, Hell-Vocke AK, Cochran DL, Dean DD, et al. Response of normal female human osteoblasts (NHOst) to 17beta-estradiol is modulated by implant surface morphology. J Biomed Mater Res. 2002;62:204–13. doi: 10.1002/jbm.10290. [DOI] [PubMed] [Google Scholar]
- 8.Olivares-Navarrete R, Hyzy SL, Hutton DL, Erdman CP, Wieland M, Boyan BD, et al. Direct and indirect effects of microstructured titanium substrates on the induction of mesenchymal stem cell differentiation towards the osteoblast lineage. Biomaterials. 2010;31:2728–35. doi: 10.1016/j.biomaterials.2009.12.029. [DOI] [PMC free article] [PubMed] [Google Scholar]
- 9.Raz P, Lohmann CH, Turner J, Wang L, Poythress N, Blanchard C, et al. 1alpha,25(OH)2D3 regulation of integrin expression is substrate dependent. J Biomed Mater Res A. 2004;71:217–25. doi: 10.1002/jbm.a.30134. [DOI] [PubMed] [Google Scholar]
- 10.Zhao G, Schwartz Z, Wieland M, Rupp F, Geis-Gerstorfer J, Cochran DL, et al. High surface energy enhances cell response to titanium substrate microstructure. J Biomed Mater Res A. 2005;74:49–58. doi: 10.1002/jbm.a.30320. [DOI] [PubMed] [Google Scholar]
- 11.Clover J, Dodds RA, Gowen M. Integrin subunit expression by human osteoblasts and osteoclasts in situ and in culture. J Cell Sci. 1992;103(Pt 1):267–71. doi: 10.1242/jcs.103.1.267. [DOI] [PubMed] [Google Scholar]
- 12.Dedhar S. Signal transduction via the beta 1 integrins is a required intermediate in interleukin-1 beta induction of alkaline phosphatase activity in human osteosarcoma cells. Exp Cell Res. 1989;183:207–14. doi: 10.1016/0014-4827(89)90430-8. [DOI] [PubMed] [Google Scholar]
- 13.Xiao G, Wang D, Benson MD, Karsenty G, Franceschi RT. Role of the alpha2-integrin in osteoblast-specific gene expression and activation of the Osf2 transcription factor. J Biol Chem. 1998;273:32988–94. doi: 10.1074/jbc.273.49.32988. [DOI] [PubMed] [Google Scholar]
- 14.Lemieux JM, Horowitz MC, Kacena MA. Involvement of integrins alpha(3)beta(1) and alpha(5)beta(1) and glycoprotein IIb in megakaryocyte-induced osteoblast proliferation. J Cell Biochem. 2010;109:927–32. doi: 10.1002/jcb.22468. [DOI] [PMC free article] [PubMed] [Google Scholar]
- 15.Reyes CD, Garcia AJ. Alpha2beta1 integrin-specific collagen-mimetic surfaces supporting osteoblastic differentiation. J Biomed Mater Res A. 2004;69:591–600. doi: 10.1002/jbm.a.30034. [DOI] [PubMed] [Google Scholar]
- 16.Cutler SM, Garcia AJ. Engineering cell adhesive surfaces that direct integrin alpha5beta1 binding using a recombinant fragment of fibronectin. Biomaterials. 2003;24:1759–70. doi: 10.1016/s0142-9612(02)00570-7. [DOI] [PubMed] [Google Scholar]
- 17.Keselowsky BG, Wang L, Schwartz Z, Garcia AJ, Boyan BD. Integrin alpha(5) controls osteoblastic proliferation and differentiation responses to titanium substrates presenting different roughness characteristics in a roughness independent manner. J Biomed Mater Res A. 2007;80:700–10. doi: 10.1002/jbm.a.30898. [DOI] [PubMed] [Google Scholar]
- 18.Tyagi S, Kramer FR. Molecular beacons: probes that fluoresce upon hybridization. Nat Biotechnol. 1996;14:303–8. doi: 10.1038/nbt0396-303. [DOI] [PubMed] [Google Scholar]
- 19.Sokol DL, Zhang X, Lu P, Gewirtz AM. Real time detection of DNA.RNA hybridization in living cells. Proc Natl Acad Sci U S A. 1998;95:11538–43. doi: 10.1073/pnas.95.20.11538. [DOI] [PMC free article] [PubMed] [Google Scholar]
- 20.Dirks RW, Molenaar C, Tanke HJ. Methods for visualizing RNA processing and transport pathways in living cells. Histochem Cell Biol. 2001;115:3–11. doi: 10.1007/s004180000214. [DOI] [PubMed] [Google Scholar]
- 21.Molenaar C, Marras SA, Slats JC, Truffert JC, Lemaitre M, Raap AK, et al. Linear 2′ O-Methyl RNA probes for the visualization of RNA in living cells. Nucleic Acids Res. 2001;29:E89–9. doi: 10.1093/nar/29.17.e89. [DOI] [PMC free article] [PubMed] [Google Scholar]
- 22.Barton GM, Medzhitov R. Retroviral delivery of small interfering RNA into primary cells. Proc Natl Acad Sci U S A. 2002;99:14943–5. doi: 10.1073/pnas.242594499. [DOI] [PMC free article] [PubMed] [Google Scholar]
- 23.Yin D, Tang JG. Gene therapy for streptozotocin-induced diabetic mice by electroporational transfer of naked human insulin precursor DNA into skeletal muscle in vivo. FEBS Lett. 2001;495:16–20. doi: 10.1016/s0014-5793(01)02352-3. [DOI] [PubMed] [Google Scholar]
- 24.Cheung CY, Murthy N, Stayton PS, Hoffman AS. A pH-sensitive polymer that enhances cationic lipid-mediated gene transfer. Bioconjug Chem. 2001;12:906–10. doi: 10.1021/bc0100408. [DOI] [PubMed] [Google Scholar]
- 25.Faria M, Spiller DG, Dubertret C, Nelson JS, White MR, Scherman D, et al. Phosphoramidate oligonucleotides as potent antisense molecules in cells and in vivo. Nat Biotechnol. 2001;19:40–4. doi: 10.1038/83489. [DOI] [PubMed] [Google Scholar]
- 26.Mathews DH, Sabina J, Zuker M, Turner DH. Expanded sequence dependence of thermodynamic parameters improves prediction of RNA secondary structure. J Mol Biol. 1999;288:911–40. doi: 10.1006/jmbi.1999.2700. [DOI] [PubMed] [Google Scholar]
- 27.Zuker M. Mfold web server for nucleic acid folding and hybridization prediction. Nucleic Acids Res. 2003;31:3406–15. doi: 10.1093/nar/gkg595. [DOI] [PMC free article] [PubMed] [Google Scholar]
- 28.Tsourkas A, Behlke MA, Bao G. Hybridization of 2′-O-methyl and 2′-deoxy molecular beacons to RNA and DNA targets. Nucleic Acids Res. 2002;30:5168–74. [PMC free article] [PubMed] [Google Scholar]
- 29.Santangelo PJ, Nix B, Tsourkas A, Bao G. Dual FRET molecular beacons for mRNA detection in living cells. Nucleic Acids Res. 2004;32:e57. doi: 10.1093/nar/gnh062. [DOI] [PMC free article] [PubMed] [Google Scholar]