

Abstract
Aberrations in the methylation status of non-coding genomic repeat DNA sequences and specific gene promoter region are important epigenetic events in melanoma progression. Promoter methylation status in LINE-1 and Absent in melanoma-1(AIM1;6q21) associated with melanoma progression and disease outcome was assessed. LINE-1 and AIM1 methylation status was assessed in paraffin-embedded archival tissues(PEAT)(n=133) and melanoma patients’ serum(n=56). LINE-1 U-Index(hypomethylation) and AIM1 were analyzed in microdissected melanoma PEAT sections. The LINE-1 U-Index of melanoma(n=100) was significantly higher than that of normal skin(n=14) and nevi(n=12)(P=0.0004). LINE-1 U-Index level was elevated with increasing AJCC stage(P<0.0001). AIM1 promoter hypermethylation was found in higher frequency(P=0.005) in metastatic melanoma(65%) than in primary melanomas(38%). When analyzed, high LINE-1 U-Index and/or AIM1 methylation in melanomas were associated with disease-free survival(DFS) and overall survival(OS) in Stage I/II patients (P=0.017, 0.027; respectively). In multivariate analysis, melanoma AIM1 methylation status was a significant prognostic factor of OS(P=0.032). Furthermore, serum unmethylated LINE-1 was at higher levels in both stage III(n=20) and stage IV(n=36) patients compared to healthy donors(n=14)(P=0.022). Circulating methylated AIM1 was detected in patients’ serum and was predictive of OS in Stage IV patients (P=0.009). LINE-1 hypomethylation and AIM1 hypermethylation have prognostic utility in both melanoma patients’ tumors and serum.
Keywords: LINE-1, AIM1, Melanoma, Methylation, Prognosis
INTRODUCTION
Epigenetic studies have shown that methylation status of CpG islands in the promoter region of tumor-related genes as well as non-coding repeat genomic sequences are associated with progression of cancers(Tanemura et al., 2009; van Hoesel et al., 2011). The former has been linked to transcriptional silencing(Jones and Baylin, 2007), but the latter is poorly understood in cancer progression(de Maat et al., 2010a; de Maat et al., 2010b; Eden et al., 2003; Gaudet et al., 2003; Sunami et al., 2011).
Long interspersed nucleotide elements-1(LINE-1) represent a non-coding repeat sequence in humans. They are 6-8 kb long, GC-poor sequences with two open reading frames(ORF1 and ORF2), encode a reverse-transcriptase, endonuclease, and make up about 17% of the human genome(Lander et al., 2001; Ostertag and Kazazian, 2001; Ovchinnikov et al., 2002). The genome contains about 5000 full-length 6.0 kb LINE-1 elements, 60-100 of which are still capable of retrotransposition(Brouha et al., 2003; Minakami et al., 1992; Scott et al., 1987). LINE-1 is hypermethylated in normal cells and hypomethylated in several malignancies(Estecio et al., 2007; Sunami et al., 2009; Yang et al., 2004). LINE-1 hypomethylation level in tumor has been correlated to tumor progression(Chalitchagorn et al., 2004; Cho et al., 2007; Daskalos et al., 2009; Lee et al., 2009; Ogino et al., 2008a; Pattamadilok et al., 2008; Tellez et al., 2009). The association of LINE-1 hypomethylation status has been assessed in human cutaneous melanoma cell lines(Tellez et al., 2009), and the activation of LINE-1 transcript has also been observed in metastatic melanomas compared to primary melanomas(Haqq et al., 2005). In this study, we assessed melanoma tumor cells microdissected from PEAT of different stages of primary and metastatic melanoma to investigate whether LINE-1 methylation status during tumor progression.
Methylation profiling of melanoma has demonstrated inactivation of tumor-related genes by hypermethylation of CpG islands in the promoter region(Furuta et al., 2004; Hoon et al., 2004; Mirmohammadsadegh et al., 2006; Patino and Susa, 2008; Tanemura et al., 2009; Worm et al., 2004). These epigenetic changes are significant factors in melanoma progression as we have recently shown(Tanemura et al., 2009). A multidomain non-lens member of βγ-crystallin superfamily, with six structural domains formed from 12 βγ-crystallin motifs, Absent in melanoma-1(AIM1), not to be confused with SLC45A2(melanoma antigen Aim1) on chromosome 5p13.2. was originally identified as a candidate tumor suppressor gene(chromosome 6q21)(Aravind et al., 2008; Ray et al., 1997). However, few studies have been carried out on AIM1 in melanoma since then.
Higher prevalence of LINE-1 and tumor suppressor genes silenced by epigenetic aberration have been found on chromosome 6(Mungall et al., 2003) where AIM1 is also located. Previous studies have demonstrated correlation between LINE-1 hypomethylation and CpG island hypermethylation of tumor suppressor genes(Estecio et al., 2010; Poage et al., 2011). As the genetic locus of AIM1 is proximal to the binding site of several known transcription factors, LINE-1 and AIM1 methylation status may be associated.
Studies have shown epigenetic tumor tissue biomarkers can have utility as biomarkers for cell-free circulating DNA(cf-cDNA)(Schwarzenbach et al., 2011). Specific cf-cDNA have demonstrated prognostic utility in melanoma patients(Mori et al., 2005). In this study, we assessed the level of circulating unmethylated LINE-1 and methylated AIM1 DNA in serum of patients with melanoma metastasis. We demonstrated prognostic utility of unmethylated LINE-1 and AIM1 methylation in both melanoma tissue and serum. These studies demonstrate that epigenetic aberrations of both coding and non-coding regions can have potential utility as biomarkers in tumors and serum of melanoma patients.
RESULTS
LINE-1 Hypomethylation in Melanomas
Using Absolute Quantitative Assessment of Methylated Alleles (AQAMA), microdissected melanoma cells were assessed for their LINE-1 U-Index which is calculated by dividing the copy number of unmethylated templates by the total of both unmethylated and methylated templates. The average LINE-1 U-Index of five melanoma cell lines was 0.79, whereas for normal PBL DNA LINE-1 U-Index ranged from <0.1 to 0.2 similar to normal skin and nevi. The LINE-1 U-Index of melanomas, including both primary and metastatic tissues(n=100, mean±SD; 0.32±0.26), was significantly higher than that of normal skin(n=14) and nevi(n=12)(mean±SD; 0.14±0.07)(T-test, P=0.0004)(Figure 1A). The LINE-1 U-Index level of metastatic melanomas(AJCC stage IIIm and IV: n=56, mean±SD; 0.40±0.30) was significantly higher than that of normal skin/nevi or primary melanomas(AJCC stage Ip, IIp, and IIIp: n=44, mean±SD; 0.22±0.14)(Tukey’s HSD P<0.0001 and P=0.0001, respectively)(Figure 1B). Furthermore, LINE-1 U-Index in melanomas showed a significant elevation with increasing stage of disease(mean±SD; I: 0.20±0.05, II: 0.24±0.11, IIIp:0.23±0.19, IIIm:0.27±0.23, and IV:0.50±0.31, respectively)(ANOVA P<0.0001)(Figure 1C). Most notably, LINE-1 U-Index level of stage IV melanomas(mean±SD; 0.50±0.31) was significantly higher than other stages(Newman-Keuls test, P<0.05). LINE-1 U-Index was not correlated with patient age or other histopathological factors including tumor thickness, ulceration, or mitotic index.
Figure 1.
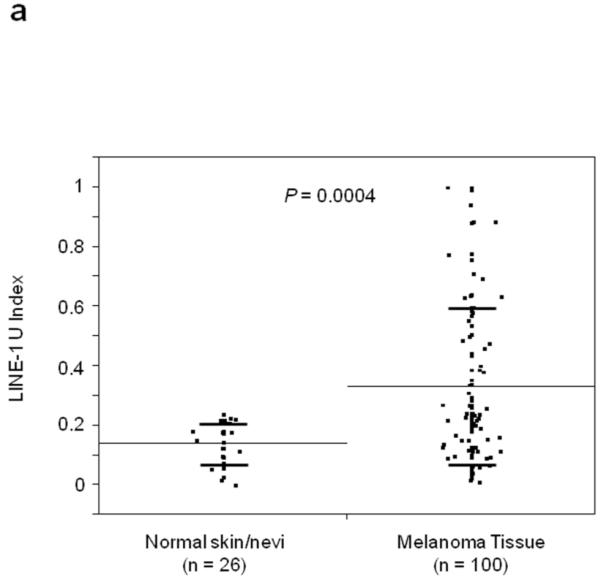


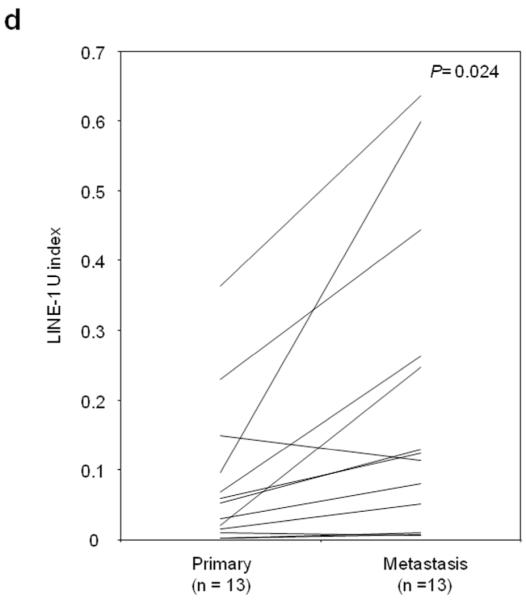
Individual and mean (solid horizontal line) LINE-1 U-Index values for tissue specimens of normal skin vs. primary/metastatic melanoma (A), normal skin vs. primary melanoma vs. metastatic melanoma (B) and according to the AJCC stage (C) and primary and metastatic paired samples (D). P values were obtained by Student’s t-test (A, D), Tukey’s HSD (B) and ANOVA (C).
LINE-1 U-Index was further compared in 13 autologous pairs of primary(2 stage II and 11 stage IIIp) and metastatic(9 stage IIIm, 4 stage IVm) tumors from13 patients. In 11 pairs, LINE-1 U-Index values were higher in metastatic than respective paired primary tumors(Figure 1D). Signed rank test for the difference of LINE-1 U-Index between primary and metastasis was significant(mean±SD; primary: 0.08±0.11, metastasis: 0.20±0.22, P=0.024). These results suggested hypomethylation of LINE-1 was a progressive factor in melanomas.
AIM1 Promoter Methylation Status in Melanoma Cell Lines
Unlike LINE-1, AIM1 is a protein encoding gene, therefore the evaluation of promoter methylation should cover regions or CpG sites relevant to the downstream expression level. Four melanoma lines(M-15, M-24, M-101, and LF-0023) and normal PBL were subjected to MALDITOF MS quantitative analysis of the entire AIM1 promoter region to profile CpG site methylation status. CpG sites of M-15 and M-101 were highly methylated across the whole promoter region compared to M-24, LF-0023, and normal PBL(Figure 2A). The transcription of AIM1 was analyzed by RT-PCR in the same melanoma lines(Figure 2B). AIM1 mRNA was not detected in the two highly AIM1methylated melanoma lines(M-15, M-101). The two AIM1 unmethylated melanoma lines(M-24, LF-0023) and normal PBL showed high expression of AIM1. Specific CpG sites most related to mRNA transcription activity(Figure 2C) were identified for methylation specific PCR(MSP) study in PEAT and cf-cDNA. The average percentage of methylation in the selected region(CpG8-11) in M-15(77%) and M-101(81%) is higher than those of two AIM1 mRNA positive cell lines, M-24 and LF-0023, and donor PBL (<12%).
Figure 2.


AIM1 promoter methylation and gene expression. A: CpG methylation in the promoter region of AIM1 gene as assessed by PCR of three amplicons (A, B, and C) covering over 1000bp of promoter region. B: AIM1 mRNA expression in melanoma cell lines. C: MALDITOF MassARRAY analysis of specific CpG sites as target region of MSP primers for AIM1.
AIM1 expression was significantly increased in the two methylated lines after treatment with 5Aza-dC(Supplementary Figure 1). This demonstrated that demethylation of AIM1 promoter region can re-activate AIM1 mRNA expression, suggesting promoter region methylation regulates AIM1 expression.
AIM1 Methylation Status and mRNA Expression in PEAT
To evaluate the AIM1 methylation status in melanoma tissues, we designed MSP primers to the specific CpG sites(CpG8-11) that were related to transcription levels of AIM1. The AIM1 promoter was found hypermethylated in 57 of 112(51%) melanoma tissues, as compared with none of histopathologically normal skin(n=14) and nevus tissues(n=12)(P<0.0001). AIM1 promoter hypermethylation was identified in 35 of 54(65%) metastatic melanomas, as compared to 22 of 58(38%) primary melanomas(P=0.005); frequency of hypermethylation progressively increased with stage(Table 1).
Table 1. Methylation Status of AIM1_Promoter Region in Melanoma Tissue.
| AJCC stage | Hypermethylation |
|---|---|
| Normal Tissue Total (n=26) | 0 (0%) |
| Skin (n=14) | 0 (0%) |
| Nevi (n=12) | 0 (0%) |
|
| |
| Primary Melanoma Total (n=58) | 22 (38%) |
| Stage I (n=14) | 4 (29%) |
| Stage II (n=14) | 8 (57%) |
| Stage III Primary Tumor (m=30) | 10 (33%) |
|
| |
| Metastasis Tumor Total (n=54) | 35 (65%) |
| Stage III Nodal Metastasis (n=23) | 11 (48%) |
| Stage IV (n=31) | 24 (77%) |
AIM1 mRNA expression was assessed in four hypomethylated stage I melanoma primary tumors and in five hypermethylated stage IV metastatic tumors. AIM1 mRNA was found in all four hypomethylated melanomas but showed limited expression in the five hypermethylated melanomas(Supplementary Figure 2).
Survival Analyses of LINE-1 and AIM1 Methylation Status
We next evaluated the PEAT AIM1 and LINE-1 methylation as biomarkers for prognostic significance. In early stage primary melanoma patients(n=23), stepwise multivariate Cox regression(variables age, gender, ulceration, Breslow, primary site) demonstrated that AIM1 hypermethylation was a significant prognostic predictor of OS in Stage I/II patients when age is included in the model(P=0.032, HR:22.62, 95%CI:1.30-392.24). LINE-1, however, it did not reach significance as an individual biomarker. Univariate analysis of AIM1 or LINE1 alone showed no significance in prediction of OS or DFS. The relatively small sample size of the survival analysis cohort may have contributed to the differences in our survival cohort between univariate and multivariate survival analysis results. In combination, patients were categorized into two groups: patients who had presence of either hypermethylated AIM1 or hypomethylated LINE-1, and patients who did not have either event. The presence of either hypermethylated AIM1 or hypomethylated LINE-1 correlated to significantly poorer patient OS and DFS in univariate analysis of Stage I/II melanoma (P=0.027 and 0.017, respectively)(Figure 3A&B). In multivariate analysis, the combination was a significant prognostic predictor of both OS and DFS in Stage I/II patients(OS: P=0.028, HR:6.46, 95%CI:1.22-34.15; DFS:P=0.046, HR:8.65, 95%CI:1.04-72.06). Table 2 lists clinicopathological factors for patients included in survival analysis along with biomarker prediction of OS results from Cox regression model.
Figure 3.


Kaplan-Meier survival curves for melanoma patients using combination of LINE-1 and AIM1 methylation status in PEAT. M=hypermethylated, U=hypomethylated. A: OS of patients with LINE-1 hypomethylation and/or AIM1 hypermethylation versus LINE-1 hypermethylation and AIM1 hypomethylation. B: DFS of stage I-II melanoma patients with LINE-1 hypomethylation and/or AIM1 hypermethylation vs. LINE-1 hypermethylation and AIM1 hypomethylation.
Table 2. Clinicopathological Factors of AIM1/LINE1 Survival Analysis set (n=72).
| Clinicopathological Factors | ||||
|---|---|---|---|---|
|
| ||||
| Stage I/II (n = 23) |
Cox OS | Stage III (n=26) |
Stage IV (n=23) |
|
| Gender | NS | |||
| Male | 12 | 15 | 15 | |
| Female | 11 | 11 | 8 | |
|
| ||||
| Age (years) | p=0.0203, HR:1.15, 95%CI(1.02-1.30) |
|||
| Mean (SD) | 68.4 (±8.9) | 62.4 (±17.1) | 59.5 (±14.7) | |
|
| ||||
| Primary Site | NS | |||
| Extremities | 12 | |||
| Head/Neck | 6 | |||
| Trunk | 5 | |||
|
| ||||
| # Distant Sites | ||||
| 1 | 3 | |||
| 2 | 8 | |||
| 3+ | 12 | |||
|
| ||||
| Breslow Thickness | NS | |||
| ≤ 1.00mm | 8 | 3 | ||
| 1.01-2.00mm | 6 | 5 | ||
| 2.01-4.00mm | 6 | 8 | ||
| >4.00mm | 1 | 10 | ||
| Unknown | 2 | 0 | ||
|
| ||||
| Ulceration | NS | |||
| Present | 7 | 13 | ||
| Absent | 13 | 11 | ||
| Unknown | 3 | 2 | ||
|
| ||||
| Mitotic Index | NS | |||
| High ≥11/mm2 | 2 | |||
|
Intermediate 5-
10/mm2 |
1 | |||
| Low ≤4/mm2 | 17 | |||
| Unknown | 3 | |||
|
| ||||
| # Lymph Nodes (+) | ||||
| 1 | 7 | |||
| 2-3 | 13 | |||
| 4+ | 1 | |||
| 0 (Skin Met) | 2 | |||
| Unknown | 3 | |||
|
| ||||
| LINE1 or AIM1 | p=0.0282, HR:6.46, 95%CI(1.22-34.15) |
|||
| LINE1/AIM1 | 11 | 12 | 22 | |
| Neither | 12 | 14 | 1 | |
Serum cf-cDNA
To determine whether LINE-1 and/or AIM1 could be used for prognostic assessment of serum(Mori et al., 2005), we examined levels of circulating unmethylated LINE-1 and methylated AIM1 in stage III and IV melanoma patients. Patient serum samples had significantly higher unmethylated LINE-1 than healthy donor serum(T-test; P=0.022)(Supplementary Figure 3), and none of the normal healthy donor serum had detectable unmethylated LINE-1 before 25 PCR cycles. The serum MSP assay detected AIM1 circulating methylated DNA in 15%(3 of 20) of stage III patients and 22%(8 of 36) of stage IV patients. Unmethylated LINE-1 status in patients’ serum was limited in prognostic utility in this set of patients. However, serum methylated AIM1 DNA was correlated to OS in Stage IV patients(P=0.0085, Log-Rank; Figure 4) and not associated with M stage. Patients found to have either serum unmethylated LINE-1 or methylated AIM1 DNA have worse prognosis compared to patients with neither(P=0.0009, Log-Rank)(Figure 4).
Figure 4.


Kaplan-Meier survival curves for stage IV patients in serum studies. A: OS of stage IV patients with methylated vs. unmethylated AIM1 cf-cDNA. B: OS of stage IV patients with LINE1 unmethylated and/or AIM1 methylated cf-cDNA vs. those with LINE-1 methylated and AIM1 unmethylated cf-cDNA.
DISCUSSION
The progressive demethylation of LINE-1 in malignancies has been correlated to increased aberrant genomic and epigenomic events(Sunami et al., 2011). We demonstrated that LINE-1 became progressively hypomethylated during melanoma progression. LINE-1 hypomethylation level was higher in stage IV melanomas compared to other stages. These results suggested that LINE-1 hypomethylation may be a significant factor in melanoma progression. Sigalotti previously demonstrated within stage IIIC melanomas that higher methylation percentage of LINE-1 is correlated to worse OS(Sigalotti et al., 2011); in this study, we further demonstrated that increasing hypomethylation of LINE-1 in advancing stages of melanomas and in metastasis of autologous metastasis-primary paired tissues. The observation of LINE-1 hypomethylation during tumor progression is in accordance with that found in gastrointestinal cancers(Ogino et al., 2008a; Ogino et al., 2008b; Sunami et al., 2011). These LINE-1 hypomethylation findings support the pattern of genomic instability occurring during melanoma progression(Fujiwara et al., 1999). LINE-1 hypomethylation has been suggested to facilitate genomic instability in cancer cells(Sunami et al., 2011), and may have a role in the activation of LINE-1 transcription in metastatic melanoma(Haqq et al., 2005).
Chromosome 6q21-22 has been long presumed as a tumor suppressor region in melanoma, and several candidate tumor suppressor genes located at 6q21-23 have been proposed. Trent et al. demonstrated that melanoma lines directly introduced with a normal copy of chromosome 6 lost their ability to form tumors in nude mice, and the loss of chromosome 6 from melanoma microcell hybrids resulted in reversion to tumorigenicity of these cells(Trent et al., 1990). High frequency of loss of heterozygosity(LOH) of chromosome 6q has also been reported in melanoma lines and tissues(Bahrami et al., 2007; Fujiwara et al., 1999; Stark and Hayward, 2007). However, it still remains unclear which key genes are specifically involved in melanoma progression in the 6q21-22 region of melanomas. Recently, lower levels of AIM1 expression was shown to be correlated with 6q21 deletion, and promoter hypermethylation of AIM1 down-regulated AIM1 expression in natural killer(NK)-cell malignancies(Iqbal et al., 2009). We found AIM1 to be significantly suppressed during melanoma progression.
Our study showed a significant association between LINE-1 hypomethylation or AIM1 hypermethylation and poorer survival. The combination analysis of LINE-1(U) and/or AIM1(M) in melanomas was a significant predictor for OS and DFS, suggesting that the combination analysis of LINE-1 hypomethylation and AIM1 hypermethylation can improve their sensitivity as prognostic biomarkers. Studies have demonstrated that genomic methylation status is dynamic during tumor progression(Tanemura et al., 2009) where genomic repeats and specific gene promoter region can, independently or concurrently, become aberrantly methylated during tumor progression(de Maat et al., 2007b; de Maat et al., 2008).
cf-cDNA has been shown as a promising clinical biomarker for various malignancies(Mori et al., 2005; Schwarzenbach et al., 2011; Umetani et al., 2006). We have reported the prognostic utility of specific circulating methylated DNA; RASSF1A, and RAR-β2 in stage IV melanoma patients(Mori et al., 2005). Although serum unmethylated LINE-1 was higher in advanced melanoma patients, it was not correlated to disease outcome. A larger defined cohort of patients may be needed to demonstrate its potential prognostic utility. Patients with circulating methylated AIM1 DNA, on the other hand, had worse OS than those who did not. The combination of AIM1 or LINE-1 cf-cDNA was significantly correlated to OS. The analysis indicated that both unmethylated and methylated cf-cDNA can be utilized for prognostic utility.
In conclusion, we demonstrated that LINE-1 hypomethylation and AIM1 hypermethylation status are related to tumor progression. Together, these two factors have prognostic value as shown with detection of cf-cDNA in melanoma patients’ serum for predicting outcome in tissue and in detecting serum cf-cDNA for realtime disease status.
MATERIALS AND METHODS
Specimens
Melanoma patients treated at Saint John’s Health Center (SJHC) between 1993-2008 were reviewed for inclusion in this study. PEAT melanomas from the patients were obtained under an IRB protocol that was approved by the SJHC/JWCI Joint IRB and Western IRB(WIRB).
The LINE-1 study included 126 PEAT(113 patients). Among these were 13 pairs of autologous tissues from a primary tumor and its synchronous regional metastasis(5 pairs) or metachronous regional/distant metastasis(8 pairs). Of the remaining 100 specimens, 44 were from the primary tumors of patients with AJCC melanoma stage I(n=13), stage II(n=11) or stage III(n=20); 56 were from metastases of patients with stage III(n=23) or stage IV(n=33).
The AIM1 study included 112 PEAT from 92 patients with AJCC stage I(n=14), stage II(n=14), stage III(n=30 primaries and 23 lymph node metastases), and stage IV(n=31 distant metastases) melanoma. Seventy-two patients from the AIM1 study overlapped with the LINE-1 study, with AJCC stage I(n=13), stage II(n=10), stage III(n=15 primary tumors and 11 lymph node metastases), and stage IV(n=23 distant metastases) melanoma. Twenty-Six negative controls were obtained from histopathologically negative normal skin(n=14) and nevi tissue(n=12).
Serum from 56 AJCC stage III(n=20) and IV(n=36) melanoma patients, and 14 healthy donors with serum separator tubes, filtered, cryopreserved(-80°C)(Koyanagi et al., 2010; Mori et al., 2005). All patients’ sera were obtained after informed consent.
Melanoma Cell Lines and Treatment
Melanoma cell lines(M-12, M-15, M-24, M-101, LF-0023) established from metastatic tumors at JWCI were cultured and harvested for the study and as assay controls. The melanoma lines were cultured as previously described(Narita et al., 2009). Three melanoma cell lines, M-15, M-101, and M-24 were treated with 5-aza-2′ deoxycytidine(5Aza-dC; Sigma-Aldrich) for AIM1 reactivation. Melanoma cells were cultured, and then treated with culture medium containing 5 μM 5Aza-dC or dimethyl sulfoxide as a vehicle control. 5Aza-dC containing medium was administered daily, and the cells were collected for assessment after 48 h.
DNA Isolation From PEAT and Serum Samples
Tissue sections were cut for H&E and microdissected(de Maat et al., 2010a; de Maat et al., 2007b). Microdissected tissues were incubated at 50°C overnight in lysis buffer(50 mM Tris, 1mM EDTA, 2.5% Tween 20, 6.0 mAU proteinase K) followed by 95°C(10min) incubation. DNA was extracted by phenol-chloroform isoamyl extraction and ethanol precipitation. DNA concentration was determined by both spectrophotometer reading at 260/280 nm, and Quant-iT™ PicoGreen® dsDNA assay kit(Invitrogen, Carlsbad, CA).
Serum samples(500μL) were diluted with 0.9% NaCl and mixed with a premix consisting of proteinase K and 10% sodium docecylsulfate. Samples were incubated at 50°C(3 hrs). After incubation, phenol-chloroform isoamyl(25:24:1, pH 8.0)(Sigma-Aldrich, St. Louis, MO) was added to each sample. DNA was extracted and quantified; up to 300 ng of DNA was subjected to sodium bisulfite modification using EpiTect bisulfite kit(Qiagen, Valencia, CA)(de Maat et al., 2010b).
AQAMA
We previously reported accurate, targeted methylation analysis of PEAT using AQAMA, an assay based on bisulfite modification of DNA and real-time PCR using two hydrolysis minor groove binder(MGB) probes specific for the methylated or unmethylated templates labeled with fluorophores(de Maat et al., 2007a; Tanemura et al., 2009). Assays were in triplicates and the average copy number was used. LINE-1 hypomethylated melanoma line DNA and LINE-1 methylated PBL of healthy donors were included as controls. The LINE-1 hypomethylation level was a continuous variable defined as the copy number of unmethylated LINE-1(U) relative to the total LINE-1 copy number which is the sum of the copy number of methylated LINE-1(M) and U(U/[U+M]), hereafter referred to as LINE-1 U-Index. The LINE-1 U-Index of each sample was compared for hypomethylation status. For assessment of cf-cDNA, modifications of the assay included the use of 4μL of bisulfite-treated DNA as template and PerfeCTa qPCR Supermix(Quanta BioScience). For serum, qPCR quantification cycle(Cq) cut-off at 25 was used to qualify whether there is sufficient level of unmethylated LINE-1 DNA present above that of a healthy donor serum.
RNA Isolation and RT-PCR
Total RNA from cultured cells was extracted using TRI-Reagent(Molecular Research Center, Cincinnati, OH). For melanomas, 5x10-μm sections were cut from PEAT blocks on a microtome. Apart from deparaffinization, RNA was extracted from PEAT using RNAwiz(Ambion, Austin, TX) after proteinase K digestion as previously described(Koyanagi et al., 2006b; Takeuchi et al., 2004). RNA quantity and quality were accessed by spectrophotometry and Quant-iT RiboGreen RNA assay(Invitrogen).
Reverse transcription of total RNA(1 g) and PCR with 5 ul of cDNA was performed as previously described(Koyanagi et al., 2006a). AIM1-specific primers are 5′-TTAGTTTTAGACATTAAAGGGGG-3′ and 5′-TGGAAGGACCTCCAGAAGAT-3′. GAPDH was assessed by RT-PCR as reference and for normalization. Specimens were amplified with a pre-cycling hold at 95°C(10min), followed by 25 cycles of 95°C, 55°C for GAPDH/58°C for AIM1, and 72°C(1min).
MALDI-TOF Mass Spectrometry
EpiTYPER assay(Sequenom, San Diego, CA) is a tool for detection and quantification of DNA methylation using MALDI-TOF MS and MassCLEAVE analysis based on a base-specific cleavage reaction(Radpour et al., 2008). This assay enables accurate quantification of DNA methylation(Coolen et al., 2007). Each CpG site within an amplicon is assessed for methylation status. Three pairs of primers were designed to cover AIM1’s promoter region as predicted by Promoter Scan Web(http://www-bimas.cit.nih.gov/molbio/proscan/) using EpiDesigner (Sequenom)(Supplementary Figure 4). Bisulfite-treated DNA PCR amplification was performed with a pre-cycling hold at 94°C(15min) followed by 45 cycles of 94°C(20s), 58°C(30s), and at 72°C(1min) and a final extension at 72°C(2min). Post-PCR amplicons are assessed as previously reported using MassARRAY(Yoshimura et al., 2011).
MSP
Bisulfite-conversion based PCR primers were designed to cover the region where methylation percentage was well-correlated with mRNA expression. For MSP on PEAT, the forward and reverse methylation-specific were 5′-D4-TTTGTTTTTTCGTTTTTTTAGGTTC-3′, and 5′-ACTAACATCCAATACCCGCG-3′, respectively. Forward and reverse unmethylated-specific primers were 5′-D3-TGTTTTTTTGTTTTTTTAGGTTTGT-3′, and 5′-ACTAACATCCAATACCCACAC-3′, respectively. For serum DNA MSP, different reverse primers were selected to reduce product size for optimal detection: methylation, 5′-CGCGATAACGCTCCG-3′and unmethylation, 5′-CAATAAACACAATAACACTCCA-3′.
For PEAT, PCR were performed with Accustart Taq DNA polymerase(0.5U)(Quanta BioSciences), 1xPCR buffer, 4.5mM MgCl2, 0.2μmol/L each of forward and reverse primer, 800μmol/L deoxynucleotide triphosphates, and 1μL bisulfite-treated DNA. Amplifications were carried out: 95°C(3min) followed by 40 cycles of 95°C, 61°C, and 72°C(30s) for both methylated and unmethylated reaction, and a final extension at 72°C(7min). For circulating AIM1 DNA in serum, 3μL of bisulfite-treated DNA was used as template in the PCR reaction, and PerfeCTa qPCR Supermix is used in place of Accustart Taq DNA polymerase cocktail. Amplifications were carried out: 95°C(3min) followed by 40 cycles of 95°C, 59°C, and 72°C(30s). PCR products were analyzed by capillary array electrophoresis(Beckman Coulter CEQ 8000X; Beckman Coulter, Brea, CA) as previously reported (Tanemura et al., 2009). Methylation assay control includes PBL DNA methylated in vitro with excess SssI methyltransferase(New England BioLabs, Ipswich, MA)(Umetani et al., 2005). Unmethylated assay control includes leukocyte DNA that was amplified by phi-29 DNA polymerase to produce universally unmethylated control(UUC).
Biostatistical Analysis
All data were analyzed using SAS software(version 9.1.3, SAS Institute, Cary, NC). Chi-square test or Fisher’s exact test were used to analyze categorical variables. ANOVA, Student’s t-test, Kruskal Wallis test, or Tukey’s HSD test was used to compare independent continuous variables across different strata. The Cochran Armitage trend test analyzed LINE-1 hypomethylation across AJCC stages. LINE-1 U indices were compared at each AJCC stage using the Student-Newman-Keuls test. Signed rank test and McNemar’s test were used to compare LINE-1 U-Index in primary and metastatic paired tissues. Correlation between LINE-1 U-Index and patients’ age was analyzed using Spearman’s rank test correlation efficient. Association between methylation status of AIM1 and AJCC stage was assessed by the Chi-square test, while trend analysis was conducted using the Cochran Armitage trend test. Cox proportional hazards(PH) regression models for OS and DFS were built incorporating methylation status of LINE-1 and AIM1 along with other clinical variables such as Breslow, age, gender, and number of metastases. To convert LINE-1 U-Index into a categorical value for analysis, a cutoff of 0.297 was established using the average of LINE-1 U-Indices from normal skin samples plus 2 S.D. A sample with LINE-1 U-Index ≥0.297was considered hypomethylated in LINE-1. When combining both AIM1 and LINE-1 status, patients with either AIM1 hypermethylation or LINE-1 hypomethylation were compared to patients who had neither event. The PH assumption was tested in building the Cox PH regression model. Survival curves were generated using the Kaplan-Meier method. A p-value <0.05 was considered statistically significant. These analyses were performed in compliance with REMARK(McShane et al., 2005).
Supplementary Material
ACKNOWLEDGMENTS
We thank Gwen Berry and Kana Sato for editorial support, and Nicholas Donovan and Dept of Molecular Oncology for their technical support.
Financial Support: This work was supported by the Dr. Miriam and Sheldon G. Adelson Medical Research Foundation, Ruth and Martin H. Weil Fund, and the Award Number P0 CA029605 and P0 CA012582 from the National Institutes of Health, National Cancer Institute. The content is solely the responsibility of the authors and does not necessarily represent the official view of the National Cancer Institute or the National Institutes of Health.
Abbreviations
- AIM1
Absent in melanoma-1
- AQAMA
Absolute Quantitative Assessment of Methylated Alleles
- cf-cDNA
circulating cell-free DNA
- LINE-1
long interspersed nucleotide elements-1
- MALDI-TOF MS
matrix-assisted laser desorption/ionization time-of-flight mass spectrometry
- M
methylated
- MSP
methylation specific PCR
- MGB
minor groove binder
- NK
natural killer
- ORF
open reading frames
- PEAT
paraffin-embedded archival tissues
- PH
proportional hazards
- PBL
peripheral blood lymphocyte
- UMC
universally methylated control
- UUC
universally unmethylated control
- U
unmethylated
- WIRB
Western Institutional Review Board
Footnotes
CONFLICT OF INTEREST: None.
Disclosure: Authors have no commercial/financial conflict of interests.
REFERENCES
- Aravind P, Wistow G, Sharma Y, Sankaranarayanan R. Exploring the limits of sequence and structure in a variant betagamma-crystallin domain of the protein absent in melanoma-1 (AIM1) J Mol Biol. 2008;381:509–518. doi: 10.1016/j.jmb.2008.06.019. [DOI] [PMC free article] [PubMed] [Google Scholar]
- Bahrami S, Cheng L, Wang M, Jones TD, Malone JC, Billings SD. Clonal relationships between epidermotropic metastatic melanomas and their primary lesions: a loss of heterozygosity and X-chromosome inactivation-based analysis. Mod Pathol. 2007;20:821–827. doi: 10.1038/modpathol.3800833. [DOI] [PubMed] [Google Scholar]
- Brouha B, Schustak J, Badge RM, Lutz-Prigge S, Farley AH, Moran JV, et al. Hot L1s account for the bulk of retrotransposition in the human population. Proc Natl Acad Sci U S A. 2003;100:5280–5285. doi: 10.1073/pnas.0831042100. [DOI] [PMC free article] [PubMed] [Google Scholar]
- Chalitchagorn K, Shuangshoti S, Hourpai N, Kongruttanachok N, Tangkijvanich P, Thong-ngam D, et al. Distinctive pattern of LINE-1 methylation level in normal tissues and the association with carcinogenesis. Oncogene. 2004;23:8841–8846. doi: 10.1038/sj.onc.1208137. [DOI] [PubMed] [Google Scholar]
- Cho NY, Kim BH, Choi M, Yoo EJ, Moon KC, Cho YM, et al. Hypermethylation of CpG island loci and hypomethylation of LINE-1 and Alu repeats in prostate adenocarcinoma and their relationship to clinicopathological features. J Pathol. 2007;211:269–277. doi: 10.1002/path.2106. [DOI] [PubMed] [Google Scholar]
- Coolen MW, Statham AL, Gardiner-Garden M, Clark SJ. Genomic profiling of CpG methylation and allelic specificity using quantitative high-throughput mass spectrometry: critical evaluation and improvements. Nucleic Acids Res. 2007;35:e119. doi: 10.1093/nar/gkm662. [DOI] [PMC free article] [PubMed] [Google Scholar]
- Daskalos A, Nikolaidis G, Xinarianos G, Savvari P, Cassidy A, Zakopoulou R, et al. Hypomethylation of retrotransposable elements correlates with genomic instability in non-small cell lung cancer. Int J Cancer. 2009;124:81–87. doi: 10.1002/ijc.23849. [DOI] [PubMed] [Google Scholar]
- de Maat MF, Narita N, Benard A, Yoshimura T, Kuo C, Tollenaar RA, et al. Development of sporadic microsatellite instability in colorectal tumors involves hypermethylation at methylated-in-tumor loci in adenoma. Am J Pathol. 2010a;177:2347–2356. doi: 10.2353/ajpath.2010.091103. [DOI] [PMC free article] [PubMed] [Google Scholar]
- de Maat MF, Umetani N, Sunami E, Turner RR, Hoon DS. Assessment of methylation events during colorectal tumor progression by absolute quantitative analysis of methylated alleles. Mol Cancer Res. 2007a;5:461–471. doi: 10.1158/1541-7786.MCR-06-0358. [DOI] [PubMed] [Google Scholar]
- de Maat MF, van de Velde CJ, Benard A, Putter H, Morreau H, van Krieken JH, et al. Identification of a quantitative MINT locus methylation profile predicting local regional recurrence of rectal cancer. Clin Cancer Res. 2010b;16:2811–2818. doi: 10.1158/1078-0432.CCR-09-2717. [DOI] [PubMed] [Google Scholar]
- de Maat MF, van de Velde CJ, Umetani N, de Heer P, Putter H, van Hoesel AQ, et al. Epigenetic silencing of cyclooxygenase-2 affects clinical outcome in gastric cancer. J Clin Oncol. 2007b;25:4887–4894. doi: 10.1200/JCO.2006.09.8921. [DOI] [PubMed] [Google Scholar]
- de Maat MF, van de Velde CJ, van der Werff MP, Putter H, Umetani N, Klein-Kranenbarg EM, et al. Quantitative analysis of methylation of genomic loci in early-stage rectal cancer predicts distant recurrence. J Clin Oncol. 2008;26:2327–2335. doi: 10.1200/JCO.2007.14.0723. [DOI] [PubMed] [Google Scholar]
- Eden A, Gaudet F, Waghmare A, Jaenisch R. Chromosomal instability and tumors promoted by DNA hypomethylation. Science. 2003;300:455. doi: 10.1126/science.1083557. [DOI] [PubMed] [Google Scholar]
- Estecio MR, Gallegos J, Vallot C, Castoro RJ, Chung W, Maegawa S, et al. Genome architecture marked by retrotransposons modulates predisposition to DNA methylation in cancer. Genome Res. 2010;20:1369–1382. doi: 10.1101/gr.107318.110. [DOI] [PMC free article] [PubMed] [Google Scholar]
- Estecio MR, Gharibyan V, Shen L, Ibrahim AE, Doshi K, He R, et al. LINE-1 hypomethylation in cancer is highly variable and inversely correlated with microsatellite instability. PLoS ONE. 2007;2:e399. doi: 10.1371/journal.pone.0000399. [DOI] [PMC free article] [PubMed] [Google Scholar]
- Fujiwara Y, Chi DD, Wang H, Keleman P, Morton DL, Turner R, et al. Plasma DNA microsatellites as tumor-specific markers and indicators of tumor progression in melanoma patients. Cancer Res. 1999;59:1567–1571. [PubMed] [Google Scholar]
- Furuta J, Umebayashi Y, Miyamoto K, Kikuchi K, Otsuka F, Sugimura T, et al. Promoter methylation profiling of 30 genes in human malignant melanoma. Cancer Sci. 2004;95:962–968. doi: 10.1111/j.1349-7006.2004.tb03184.x. [DOI] [PMC free article] [PubMed] [Google Scholar]
- Gaudet F, Hodgson JG, Eden A, Jackson-Grusby L, Dausman J, Gray JW, et al. Induction of tumors in mice by genomic hypomethylation. Science. 2003;300:489–492. doi: 10.1126/science.1083558. [DOI] [PubMed] [Google Scholar]
- Haqq C, Nosrati M, Sudilovsky D, Crothers J, Khodabakhsh D, Pulliam BL, et al. The gene expression signatures of melanoma progression. Proc Natl Acad Sci U S A. 2005;102:6092–6097. doi: 10.1073/pnas.0501564102. [DOI] [PMC free article] [PubMed] [Google Scholar]
- Hoon DS, Spugnardi M, Kuo C, Huang SK, Morton DL, Taback B. Profiling epigenetic inactivation of tumor suppressor genes in tumors and plasma from cutaneous melanoma patients. Oncogene. 2004;23:4014–4022. doi: 10.1038/sj.onc.1207505. [DOI] [PMC free article] [PubMed] [Google Scholar]
- Iqbal J, Kucuk C, Deleeuw RJ, Srivastava G, Tam W, Geng H, et al. Genomic analyses reveal global functional alterations that promote tumor growth and novel tumor suppressor genes in natural killer-cell malignancies. Leukemia. 2009;23:1139–1151. doi: 10.1038/leu.2009.3. [DOI] [PubMed] [Google Scholar]
- Jones PA, Baylin SB. The epigenomics of cancer. Cell. 2007;128:683–692. doi: 10.1016/j.cell.2007.01.029. [DOI] [PMC free article] [PubMed] [Google Scholar]
- Koyanagi K, Mori T, O’Day SJ, Martinez SR, Wang HJ, Hoon DS. Association of circulating tumor cells with serum tumor-related methylated DNA in peripheral blood of melanoma patients. Cancer Res. 2006a;66:6111–6117. doi: 10.1158/0008-5472.CAN-05-4198. [DOI] [PMC free article] [PubMed] [Google Scholar]
- Koyanagi K, O’Day SJ, Boasberg P, Atkins MB, Wang HJ, Gonzalez R, et al. Serial monitoring of circulating tumor cells predicts outcome of induction biochemotherapy plus maintenance biotherapy for metastatic melanoma. Clin Cancer Res. 2010;16:2402–2408. doi: 10.1158/1078-0432.CCR-10-0037. [DOI] [PMC free article] [PubMed] [Google Scholar]
- Koyanagi K, O’Day SJ, Gonzalez R, Lewis K, Robinson WA, Amatruda TT, et al. Microphthalmia transcription factor as a molecular marker for circulating tumor cell detection in blood of melanoma patients. Clin Cancer Res. 2006b;12:1137–1143. doi: 10.1158/1078-0432.CCR-05-1847. [DOI] [PMC free article] [PubMed] [Google Scholar]
- Lander ES, Linton LM, Birren B, Nusbaum C, Zody MC, Baldwin J, et al. Initial sequencing and analysis of the human genome. Nature. 2001;409:860–921. doi: 10.1038/35057062. [DOI] [PubMed] [Google Scholar]
- Lee HS, Kim BH, Cho NY, Yoo EJ, Choi M, Shin SH, et al. Prognostic Implications of and Relationship Between CpG Island Hypermethylation and Repetitive DNA Hypomethylation in Hepatocellular Carcinoma. Clin Cancer Res. 2009;15:812–820. doi: 10.1158/1078-0432.CCR-08-0266. [DOI] [PubMed] [Google Scholar]
- McShane LM, Altman DG, Sauerbrei W, Taube SE, Gion M, Clark GM. Reporting recommendations for tumor marker prognostic studies. J Clin Oncol. 2005;23:9067–9072. doi: 10.1200/JCO.2004.01.0454. [DOI] [PubMed] [Google Scholar]
- Minakami R, Kurose K, Etoh K, Furuhata Y, Hattori M, Sakaki Y. Identification of an internal cis-element essential for the human L1 transcription and a nuclear factor(s) binding to the element. Nucleic Acids Res. 1992;20:3139–3145. doi: 10.1093/nar/20.12.3139. [DOI] [PMC free article] [PubMed] [Google Scholar]
- Mirmohammadsadegh A, Marini A, Nambiar S, Hassan M, Tannapfel A, Ruzicka T, et al. Epigenetic silencing of the PTEN gene in melanoma. Cancer Res. 2006;66:6546–6552. doi: 10.1158/0008-5472.CAN-06-0384. [DOI] [PubMed] [Google Scholar]
- Mori T, O’Day SJ, Umetani N, Martinez SR, Kitago M, Koyanagi K, et al. Predictive utility of circulating methylated DNA in serum of melanoma patients receiving biochemotherapy. J Clin Oncol. 2005;23:9351–9358. doi: 10.1200/JCO.2005.02.9876. [DOI] [PMC free article] [PubMed] [Google Scholar]
- Mungall AJ, Palmer SA, Sims SK, Edwards CA, Ashurst JL, Wilming L, et al. The DNA sequence and analysis of human chromosome 6. Nature. 2003;425:805–811. doi: 10.1038/nature02055. [DOI] [PubMed] [Google Scholar]
- Narita N, Tanemura A, Murali R, Scolyer RA, Huang S, Arigami T, et al. Functional RET G691S polymorphism in cutaneous malignant melanoma. Oncogene. 2009;28:3058–3068. doi: 10.1038/onc.2009.164. [DOI] [PMC free article] [PubMed] [Google Scholar]
- Ogino S, Kawasaki T, Nosho K, Ohnishi M, Suemoto Y, Kirkner GJ, et al. LINE-1 hypomethylation is inversely associated with microsatellite instability and CpG island methylator phenotype in colorectal cancer. Int J Cancer. 2008a;122:2767–2773. doi: 10.1002/ijc.23470. [DOI] [PMC free article] [PubMed] [Google Scholar]
- Ogino S, Nosho K, Kirkner GJ, Kawasaki T, Chan AT, Schernhammer ES, et al. A cohort study of tumoral LINE-1 hypomethylation and prognosis in colon cancer. J Natl Cancer Inst. 2008b;100:1734–1738. doi: 10.1093/jnci/djn359. [DOI] [PMC free article] [PubMed] [Google Scholar]
- Ostertag EM, Kazazian HH., Jr. Biology of mammalian L1 retrotransposons. Annu Rev Genet. 2001;35:501–538. doi: 10.1146/annurev.genet.35.102401.091032. [DOI] [PubMed] [Google Scholar]
- Ovchinnikov I, Rubin A, Swergold GD. Tracing the LINEs of human evolution. Proc Natl Acad Sci U S A. 2002;99:10522–10527. doi: 10.1073/pnas.152346799. [DOI] [PMC free article] [PubMed] [Google Scholar]
- Patino WD, Susa J. Epigenetics of cutaneous melanoma. Adv Dermatol. 2008;24:59–70. doi: 10.1016/j.yadr.2008.09.003. [DOI] [PubMed] [Google Scholar]
- Pattamadilok J, Huapai N, Rattanatanyong P, Vasurattana A, Triratanachat S, Tresukosol D, et al. LINE-1 hypomethylation level as a potential prognostic factor for epithelial ovarian cancer. Int J Gynecol Cancer. 2008;18:711–717. doi: 10.1111/j.1525-1438.2007.01117.x. [DOI] [PubMed] [Google Scholar]
- Poage GM, Houseman EA, Christensen BC, Butler R, Avissar-Whiting M, McClean MD, et al. Global Hypomethylation Identifies Loci Targeted for Hypermethylation in Head and Neck Cancer. Clin Cancer Res. 2011 doi: 10.1158/1078-0432.CCR-11-0044. [DOI] [PMC free article] [PubMed] [Google Scholar]
- Radpour R, Haghighi MM, Fan AX, Torbati PM, Hahn S, Holzgreve W, et al. High-throughput hacking of the methylation patterns in breast cancer by in vitro transcription and thymidine-specific cleavage mass array on MALDI-TOF silico-chip. Mol Cancer Res. 2008;6:1702–1709. doi: 10.1158/1541-7786.MCR-08-0262. [DOI] [PubMed] [Google Scholar]
- Ray ME, Wistow G, Su YA, Meltzer PS, Trent JM. AIM1, a novel non-lens member of the betagamma-crystallin superfamily, is associated with the control of tumorigenicity in human malignant melanoma. Proc Natl Acad Sci U S A. 1997;94:3229–3234. doi: 10.1073/pnas.94.7.3229. [DOI] [PMC free article] [PubMed] [Google Scholar]
- Schwarzenbach H, Hoon DS, Pantel K. Cell-free nucleic acids as biomarkers in cancer patients. Nat Rev Cancer. 2011;11:426–437. doi: 10.1038/nrc3066. [DOI] [PubMed] [Google Scholar]
- Scott AF, Schmeckpeper BJ, Abdelrazik M, Comey CT, O’Hara B, Rossiter JP, et al. Origin of the human L1 elements: proposed progenitor genes deduced from a consensus DNA sequence. Genomics. 1987;1:113–125. doi: 10.1016/0888-7543(87)90003-6. [DOI] [PMC free article] [PubMed] [Google Scholar]
- Sigalotti L, Fratta E, Bidoli E, Covre A, Parisi G, Colizzi F, et al. Methylation levels of the “long interspersed nucleotide element-1” repetitive sequences predict survival of melanoma patients. J Transl Med. 2011;9:78. doi: 10.1186/1479-5876-9-78. [DOI] [PMC free article] [PubMed] [Google Scholar]
- Stark M, Hayward N. Genome-wide loss of heterozygosity and copy number analysis in melanoma using high-density single-nucleotide polymorphism arrays. Cancer Res. 2007;67:2632–2642. doi: 10.1158/0008-5472.CAN-06-4152. [DOI] [PubMed] [Google Scholar]
- Sunami E, de Maat M, Vu A, Turner RR, Hoon DS. LINE-1 hypomethylation during primary colon cancer progression. PLoS One. 2011;6:e18884. doi: 10.1371/journal.pone.0018884. [DOI] [PMC free article] [PubMed] [Google Scholar]
- Sunami E, Vu AT, Nguyen SL, Hoon DS. Analysis of methylated circulating DNA in cancer patients’ blood. Methods Mol Biol. 2009;507:349–356. doi: 10.1007/978-1-59745-522-0_25. [DOI] [PubMed] [Google Scholar]
- Takeuchi H, Morton DL, Kuo C, Turner RR, Elashoff D, Elashoff R, et al. Prognostic significance of molecular upstaging of paraffin-embedded sentinel lymph nodes in melanoma patients. J Clin Oncol. 2004;22:2671–2680. doi: 10.1200/JCO.2004.12.009. [DOI] [PMC free article] [PubMed] [Google Scholar]
- Tanemura A, Terando AM, Sim MS, van Hoesel AQ, de Maat MF, Morton DL, et al. CpG island methylator phenotype predicts progression of malignant melanoma. Clin Cancer Res. 2009;15:1801–1807. doi: 10.1158/1078-0432.CCR-08-1361. [DOI] [PMC free article] [PubMed] [Google Scholar]
- Tellez CS, Shen L, Estecio MR, Jelinek J, Gershenwald JE, Issa JP. CpG island methylation profiling in human melanoma cell lines. Melanoma Res. 2009;19:146–155. doi: 10.1097/cmr.0b013e32832b274e. [DOI] [PubMed] [Google Scholar]
- Trent JM, Stanbridge EJ, McBride HL, Meese EU, Casey G, Araujo DE, et al. Tumorigenicity in human melanoma cell lines controlled by introduction of human chromosome 6. Science. 1990;247:568–571. doi: 10.1126/science.2300817. [DOI] [PubMed] [Google Scholar]
- Umetani N, de Maat MF, Mori T, Takeuchi H, Hoon DS. Synthesis of universal unmethylated control DNA by nested whole genome amplification with phi29 DNA polymerase. Biochem Biophys Res Commun. 2005;329:219–223. doi: 10.1016/j.bbrc.2005.01.088. [DOI] [PubMed] [Google Scholar]
- Umetani N, Kim J, Hiramatsu S, Reber HA, Hines OJ, Bilchik AJ, et al. Increased integrity of free circulating DNA in sera of patients with colorectal or periampullary cancer: direct quantitative PCR for ALU repeats. Clin Chem. 2006;52:1062–1069. doi: 10.1373/clinchem.2006.068577. [DOI] [PubMed] [Google Scholar]
- van Hoesel AQ, van de Velde CJ, Kuppen PJ, Putter H, de Kruijf EM, van Nes JG, et al. Primary tumor classification according to methylation pattern is prognostic in patients with early stage ER-negative breast cancer. Breast Cancer Res Treat. 2011 doi: 10.1007/s10549-011-1485-3. Epub Ahead of Print. [DOI] [PubMed] [Google Scholar]
- Worm J, Christensen C, Gronbaek K, Tulchinsky E, Guldberg P. Genetic and epigenetic alterations of the APC gene in malignant melanoma. Oncogene. 2004;23:5215–5226. doi: 10.1038/sj.onc.1207647. [DOI] [PubMed] [Google Scholar]
- Yang AS, Estecio MR, Doshi K, Kondo Y, Tajara EH, Issa JP. A simple method for estimating global DNA methylation using bisulfite PCR of repetitive DNA elements. Nucleic Acids Res. 2004;32:e38. doi: 10.1093/nar/gnh032. [DOI] [PMC free article] [PubMed] [Google Scholar]
- Yoshimura T, Nagahara M, Kuo C, Turner RR, Soon-Shiong P, Hoon DS. Lymphovascular invasion of colorectal cancer is correlated to SPARC expression in the tumor stromal microenvironment. Epigenetics. 2011;6:1001–1011. doi: 10.4161/epi.6.8.16063. [DOI] [PubMed] [Google Scholar]
Associated Data
This section collects any data citations, data availability statements, or supplementary materials included in this article.