

Abstract
The actin-binding protein plastin 3 (PLS3) has been identified as a modifier of the human motoneuron disease spinal muscular atrophy (SMA). SMA is caused by decreased levels of the survival motor neuron protein (SMN) and in its most severe form causes death in infants and young children. To understand the mechanism of PLS3 in SMA, we have analyzed pls3 RNA and protein in zebrafish smn mutants. We show that Pls3 protein levels are severely decreased in smn−/− mutants without a reduction in pls3 mRNA levels. Moreover, we show that both pls3 mRNA and protein stability are unaffected when Smn is reduced. This indicates that SMN affects PLS3 protein production. We had previously shown that, in smn mutants, the presynaptic protein SV2 is decreased at neuromuscular junctions. Transgenically driving human PLS3 in motoneurons rescues the decrease in SV2 expression. To determine whether PLS3 could also rescue function, we performed behavioral analysis on smn mutants and found that they had a significant decrease in spontaneous swimming and turning. Driving PLS3 transgenically in motoneurons rescued both of these defects. These data show that PLS3 protein levels are dependent on SMN and that PLS3 is able to rescue the neuromuscular defects and corresponding movement phenotypes caused by low levels of Smn suggesting that decreased PLS3 contributes to SMA motor phenotypes.
Introduction
Modifiers of human disease lend insight into disease processes. Disease modifiers can be identified by a number of approaches including genome association analysis and subsequent identification of proteins, analysis of discordant families, and genetics screens in animal models. However, the identification of modifiers is still relatively rare for human diseases. Spinal muscular atrophy (SMA) is primarily a motoneuron disease that in its most severe form is fatal in infancy or childhood. The survival motoneuron (SMN) gene is genetically linked to SMA (Lefebvre et al., 1995). In the human genome, there are two copies of the SMN gene, SMN1 and SMN2; a situation unique to humans since all other species only have SMN1 (Rochette et al., 2001). SMN2, however, undergoes splicing so that only ∼10% of transcripts encode full-length RNA (Lorson et al., 1999; Monani et al., 1999). Thus, patients missing or carrying a mutation in their SMN1 gene have insufficient SMN protein levels and develop SMA. SMN functions in the assembly of RNA and protein complexes involved in pre-mRNA splicing and as such is an essential protein (Schrank et al., 1997; Paushkin et al., 2002). SMN has also been shown to interact with a number of other proteins, suggesting alternative functions (Rossoll and Bassell, 2009). Thus, although SMN is genetically linked to SMA, the function of SMN critical to SMA remains unclear (Burghes and Beattie, 2009).
Whereas SMN2 copy number is linked to disease severity (Prior et al., 2004, 2009), other genetic factors appear to also modify the SMA phenotype. Knowledge of these modifiers has the potential to identify key functions of SMN that contribute to disease severity. To reveal modifiers of SMA, Wirth and colleagues (Oprea et al., 2008) examined gene expression in cell lines derived from siblings with the same genetics but a different disease severity (i.e., discordant siblings). It was found that plastin 3 (PLS3) was expressed at higher levels in cell lines derived from the less affected siblings. Further studies showed that overexpressing PLS3 in both cultured neurons and in zebrafish could rescue the axon defects caused by low Smn levels (Oprea et al., 2008). Actin dynamics is an essential mechanism in axon outgrowth and synapse formation (Cingolani and Goda, 2008; Dent et al., 2011). PLS3 belongs to a family of actin-binding proteins and bundles and binds actin (Glenney et al., 1981). A number of studies have suggested a role for actin dynamics in SMA. For example, in a moderate model of SMA (SMN2B/−), the actin-binding protein profilin IIA is increased, PLS3 is decreased, and rhoA kinase, a negative regulator of actin dynamics, is overactive (Bowerman et al., 2009, 2010). Interestingly, when rhoA kinase is chemically inactivated in this model, survival is prolonged (Bowerman et al., 2010). Thus, a further understanding of how actin dynamics becomes altered by low SMN levels is warranted.
Here, we show using zebrafish that Smn influences Pls3 protein levels by a posttranscriptional mechanism. Moreover, we show that PLS3 driven only in motoneurons rescues presynaptic neuromuscular junction (NMJ) defects and movement defects in smn mutants. These data indicate that a reduction of Pls3, caused by decreased Smn, contributes to key aspects of SMA.
Materials and Methods
Zebrafish maintenance
Zebrafish used in this study were on the *AB/TL (Tupfel long fin) background. smnY262stop mutants have been described previously (Boon et al., 2009). Adult zebrafish and embryos were kept at temperatures between 27 and 29°C and maintained by standard protocols (Westerfield, 1995).
Nomenclature
Gene and protein nomenclature conform to species conventions (Trends in Genetics, 1998). Zebrafish gene or RNA is denoted as lowercase italics, smn, pls3, and protein as Smn, Pls3. The human gene or RNA is uppercase italics, SMN, PLS3, and protein, SMN, PLS3. When speaking of the protein or RNA in the general sense, the human convention is used.
DNA constructs used for making transgenic lines
Hsp70: RFP-hSMN construct.
The RFP-hSMN (Zhang et al., 2007) in pCS2 was digested with BamHI and NotI and cloned into pBluescript vector that contained two SceI sites (RFP-hSMN/pBluescripSceI plasmid). The 1.5 kb heat shock 70 promoter (hsp70) was released from the pHSP70/4 EGFP-1 plasmid (Halloran et al., 2000) using the BamHI site and cloned into the RFP-hSMN/pBluescript plasmid containing I-SceI sites to enhance transgenesis (Thermes et al., 2002). The orientation of the hsp70 promoter was determined by injecting DNA into one-cell embryos following heat shock at day 1 and screening for RFP-SMN at day 2. The hsp70: RFP-hSMN/pBluescript-ISceI that gave an RFP signal was used to make transgenic line Tg(hsp70: RFP-hSMN)os36 as described below.
mnx1:0.6hsp70:GFP construct.
This construct was made as described previously (Dalgin et al., 2011). Briefly, the zebrafish mnx1 (hb9) promoter (Flanagan-Steet et al., 2005) was cloned into a pBSK plasmid containing a 0.6 kb fragment of the zebrafish hsp70 promoter and GFP generated from Halloran et al. (2000) and Shoji and Sato-Maeda (2008).
mnx1:PLS3;0.6hsp70:GFP construct.
The human PLS3 cDNA fragment was released from pcDNA3.1 vector (Oprea et al., 2008) using BamHI and XhoI and cloned into the pCS2 vector to obtain the poly(A) tail. The human PLS3-poly(A) fragment was then cloned into the mnx1:0.6hsp70:GFP/pBSK-ISceI plasmid described above using BamHI and SacII. The final DNA construct mnx1:0.6hsp70:GFP; mnx1:PLS3/pBSK-ISceI was used to make mnx1:PLS3;0.6hsp70:GFP transgenic line Tg(mnx1:PLS3; 0.6hsp70:GFP)os26.
Once we generated Tg(mnx1:PLS3;0.6hsp70:GFP) fish, we found that, even without heat shocking, GFP was expressed in motoneurons and their axons starting at 19 h postfertilization (hpf), suggesting that the mnx1 promoter was also acting to drive GFP. Therefore, we used the GFP in motoneurons as a marker for screening transgenic fish. We also found that the 0.6 kb fragment of hsp70 acted as an enhancer to increase the expression from the mnx1 promoter. This was confirmed by comparing fish with the 0.6 kb hsp70 to those made that lacked this construct.
mnx1:1.5hsp70:PLS3;0.6hsp70:GFP construct.
The 1.5 kb hsp70 promoter was released from the hsp70/4 EGFP-1 (Halloran et al., 2000; Shoji and Sato-Maeda, 2008) plasmid using BamBI site and cloned into mnx1:PLS3;0.6hsp70GFP/pBSK-ISceI. The orientation of the hsp70 promoter was determined by injecting DNA into one-cell stage embryos followed by heat shock induction at 1 d postfertilization (dpf) followed by a PLS3 Western blot at 3 dpf. The final DNA construct was used to make the transgenic line Tg(mnx1:1.5hsp70:PLS3;0.6hsp70:GFP). Although this line has both the mnx1 and the 1.5 kb hsp70 promoters, it was used just for the heat shock induction experiments.
Generating transgenic lines
DNA injections were performed as described previously (Rembold et al., 2006). DNA plasmid samples were prepared using QIAGEN Plasmid Mini kit and diluted to ∼50 ng/L in I-SceI buffer (10 mm Tris-HCl, 1 mm dithiothreitol, 10 mm MgCl2, pH 8.8), 5 U of I-SceI enzyme (New England Biolabs), and 0.1% phenol red. DNA samples were freshly prepared before each injection as this increased the rate of transgenesis. DNA was injected into embryos at the early one-cell stage (∼0.5 nl). Injected embryos were transferred into fish water containing 50 U of penicillin and 5 g of streptomycin (Invitrogen). Injected fish (F0s) were heat shocked at 1 dpf at 37°C for 30 min in a PCR machine and screened at 2 dpf. Only fish expressing RFP or GFP (depending on the line) in all/most cells were selected for growing to adulthood. F0s were outcrossed to wild types, and the resulting F1s were screened for RFP or GFP fluorescence signal after heat shock induction. Fluorescent F1s were kept as F1 founders for the transgenic lines. Upon reaching adulthood, they were crossed to smnY262stop+/− fish to establish the transgenic line on the mutant background. Each transgenic line is given a laboratory (os, Ohio State) designation. The smnY262stop+/− mutants were genotyped as described previously (Boon et al., 2009).
Quantitative reverse transcriptase-PCR
RNA was isolated using Trizol reagent (Invitrogen). Quantitative reverse transcriptase-PCR (qRT-PCR) was performed using the two-step method. First, cDNA was made using iScript cDNA synthesis kit (Bio-Rad). qPCR was performed on the iCycler (Bio-Rad) with IqSYBR Green Supermix (Bio-Rad) containing 5 ng of cDNA and 10 pmol of each primer. Primers for zebrafish pls3 (forward, 5′-GGTGATGGTATAGTCTTGTG-3′, and reverse, 5′-TCTGGAGACAGTTTCATCAG-3′) gave a 320 bp PCR product. Primers for human PLS3 (forward, 5′-GTTGGTGATGGAATTGTGCT-3′, and reverse, 5′-GAAGCTCTTCTGGAGACAAT-3′) gave a 231 bp PCR product. Primers for zebrafish β-actin (forward, 5′-GATGACATGGAGAAGATCTG-3′, and reverse, 5′-ACCAGAGTCCATCACAATAC-3′) gave a 231 bp PCR product. qPCR was performed under the following conditions: one cycle at 94°C for 5 min; 45 cycles of 94°C for 30 s, 60°C for 30 s, and 72°C for 30 s; and then a step down from 94 to 4°C, by 0.5°C every 10 s. RNA expression levels were determined as described previously (Yin et al., 2008).
To examine PLS3 RNA decay, RNA was isolated from three embryos at each time point. This was done three times on embryos from different clutches, and each sample was run in triplicate for both β-actin and PLS3.
To examine endogenous zebrafish pls3 RNA levels, smnY262stop heterozygotes (smn+/) fish were incrossed and grown until 8 dpf, and then genotyped as described previously (Boon et al., 2009). Tg(hsp70:RFP-SMN)+/+;smn+/− were outcrossed with smn+/−. At 5 and 7 dpf, fish were heat shocked at 37°C for 1 h. On 8 dpf, fish in both the heat shocked and non-heat-shocked groups were genotyped for smn−/−. RNA was isolated from three embryos. This was done three times on embryos from different clutches, and each sample was run in triplicate for both β-actin and pls3.
To analyze zebrafish pls3 splicing, total RNA from 11 dpf zebrafish wild-type or mutant embryos were isolated using Trizol reagent (Invitrogen) as per the manufacturer's protocol. RT-PCR was performed using QIAGEN one-step RT-PCR kit. Full-length zebrafish pls3 RNA was amplified by primers Fish-pls3-FL-F, 5′-ATGGCTGGTAAGATATCCAAAGAAGAGCTG, and Fish-pls3-FL-R, 5′-TTAAGCCCTTTTCATACCCTCTGCCCATTAG. PCR products were run on 8% polyacrylamide gel to aid in resolving any splice products.
RNA and protein half-life determination
The half-life (T1/2) of human PLS3 RNA and protein in control and smn morphants was determined by measuring RNA (by qRT-PCR) or protein (by Westerns) at subsequent hours or days after heat shock. This was plotted on a log scale and the formula T1/2 = ln2/X (where X is the slope of the line) was used to calculate the half-life.
Antisense morpholino injections
The antisense morpholinos (MOs) (GeneTools) used for Smn knockdown and the control MO were used as previously described (McWhorter et al., 2003). Each embryo was injected with a dose of MO that resulted in ∼80% knockdown of Smn protein. This ranged from 3 to 9 ng of smn MO depending on the efficacy of the batch purchased. The concentration of MO delivered per embryo was determined as previously described (Carrel et al., 2006). For pls3 knockdown, two different MOs were used: a spice blocking MO, 5′-AAAGTAAAATCAAACCTGTATTGTG-3′ (Oprea et al., 2008), and a translation blocking MO, 5′-ATATCTTACCAGCCATCTCCCAAAG-3′. A standard MO (5′-CCTCTTACCTCAGTTACAATTTATA-3′) was used for control injections. Different doses of the splice pls3 MO (9–12 ng) were injected into one-cell stage embryos. Consistent with previous result, 9 ng of pls3 MO resulted in only 30–40% knockdown, without a phenotypic effect on motor axons; a higher dose of pls3 MO (12 ng) resulted in 100% lethality (Oprea et al., 2008). Eleven nanograms of pls3 MO resulted in deformed embryos, and 10 ng resulted in slow development but normal morphology and very low levels of Pls3; thus, this dose was used for the splice blocking pls3 MO. Since the splice blocking pls3 MO was so difficult to titrate, we decided to use the translation blocking pls3 MO. A dose–response revealed that at 9 ng all embryos were deformed, at 6 ng all embryos developed slowly, and at 4 ng embryos developed normally and Western blot confirmed low levels of Pls3 protein (see text). Thus, we chose to use 4 ng of the translation blocking MO for our experiments. Note, all experiments with pls3 MO were confirmed with both MOs, but data shown here were obtained with the translation blocking pls3 MO. For the human PLS3 RNA rescue experiments, 200 pg of PLS3 RNA was coinjected with the translation blocking pls3 MO. Neither pls3 MO recognizes human PLS3 RNA. The tdp43 MO sequence and concentration used have been described previously (Kabashi et al., 2010). Motor axons were visualized and classified as described previously (Carrel et al., 2006). Approximately 25 embryos were scored from at least three separate injections.
Western blotting
Three zebrafish embryos or larvae were dissolved in 10 μl of blending buffer (50 mm Tris, pH 6.8, 10 mm EDTA, and 10% SDS) and boiled for 10 min. An equal volume of loading buffer was then added to the samples that were then boiled for 2 additional minutes and resolved on a 12.5% polyacrylamide gels. Gels were electrotransferred to the Protran BA 83 Nitrocellulose membranes (Whatman). Membranes were probed with primary antibodies and signal was detected with horseradish peroxidase-conjugated goat anti-mouse antibody (1/5000) (Jackson ImmunoResearch Laboratories) or horseradish peroxidase-conjugated goat anti-rabbit IgG (1/5000) (Santa Cruz Biotechnology), ECL reagents, and GE Healthcare Hyperfilm ECL (GE Healthcare). The following antibodies were used for Western blot in this study: SMN monoclonal antibody MANSMA12 (1/500) (gift from Dr. Glenn Morris, Robert Jones and Agnes Hunt Orthopaedic Hospital, Oswestry, UK) (Young et al., 2000), PLS3 polyclonal antibody (1/5000) (gift from Dr. Brunhilde Wirth, Genetics University Hospital of Cologne, Cologne, Germany) (Oprea et al., 2008), profilin IIb monoclonal antibody PF2A3 (1/100) (gift from Dr. Glenn Morris) (Sharma et al., 2005), gemin 2 monoclonal antibody (1/10) (gift from Dr. Livio Pellizzoni, Columbia University, New York, NY) (McWhorter et al., 2008), gemin 5 monoclonal antibody GEM5E (1/100) (gift from Dr. Glenn Morris) (Hao et al., 2007), SOD1 polyclonal antibody (1/1000) (Santa Cruz Biotechnology), and β-actin monoclonal antibody (1/5000) (Santa Cruz Biotechnology). Under these conditions, proteins run as follows: zebrafish gemin 5, 170 kDa; zebrafish gemin 2, 32 kDa; zebrafish Pls3, 65 kDa; human PLS3, 75 kDa; zebrafish Smn, 42 kDa; human SMN, 38 kDa; zebrafish Sod, 16 kDa; zebrafish profilin, 16 kDa; zebrafish β-actin, 42 kDa. PLS3 and Smn were always run on the same gel, and then the blot cut and probed separately with anti-PLS3 antibody (top half) or anti-Smn antibody (bottom half). The bottom half was subsequently stripped and reprobed with β-actin. Western blots were quantitated as previously described (Hao et al., 2011).
Immunofluorescence staining and confocal microscopy
Zebrafish larvae were anesthetized with tricaine (Sigma-Aldrich; A-5040), and their heads were removed for genotyping. Trunks were fixed in 4% paraformaldehyde/PBS and 1% DMSO overnight at 4°C. Larvae were then washed in 1× PBS for 10 min, and then distilled water for 10 min. This was followed by a 15 min incubation at room temperature with −20°C acetone, and then a final incubation in distilled water for 20 min. Samples were incubated overnight at 4°C with presynaptic antibody SV2 (Developmental Studies Hybridoma Bank), diluted 1/100 in PBDT buffer (1×PBS, 1% DMSO, 1% BSA, 0.5% Triton X-100) and 2.5% normal goat serum. Samples were washed for 10 min five times with PBST at room temperature and incubated overnight at 4°C with Alexa Fluor 633 goat-anti mouse IgG (Invitrogen) diluted 1/400 in PBDT and 2.5% normal goat serum. Samples were washed for 10 min five times in PBST, mounted on slides using Vectashield (Vector Laboratories), and images were captured with the Leica TCS-SL scanning confocal microscope system. The intensity of the SV2 immunostaining was calculated using MetaMorph software (Molecular Devices). Single-plane grayscale images were first corrected by arithmetically subtracting the background from the original images and intensity thresholds were adjusted. Six regions per fish were chosen throughout the ventral hemisegments excluding lateral hemisegment boundaries. The number of pixels per fish was then calculated and reported as mean ± SD.
For pls3 morphants, acetylated tubulin (1/500; Sigma-Aldrich; Alexa Fluor 488 anti-mouse, 1/500; Invitrogen) labeling was performed on 34 hpf fish and analyzed by confocal microscopy (Leica TCS-SL scanning confocal microscope).
Movement analysis
To examine spontaneous larval motor behaviors, we captured video recordings using a Motionpro high speed camera (Redlake) at 1000 frames per second with 512 × 512 pixel resolution, using a 50 mm macro lens. Using a 4 × 4 grid, we simultaneously analyzed the movement of 16 individually housed 9 dpf larvae and recorded 400 ms bouts at 3 s intervals for a total of 60 trials. Before testing for spontaneous movement, larvae were preadapted to the intensity of light in the testing arena for at least 2 h. Video recordings were initiated 5 min after moving larvae to the testing grid to allow sufficient time for locomotor activity to stabilize. Behavioral experiments were performed at 26–27°C. All behavioral measurements were made with the FLOTE software package (Burgess and Granato, 2007a,b). This software performs tracking of individual larvae and then performs automated analysis of body curvature on each larva to extract kinematic details of swimming and turning movements. The software then classifies each movement according to previously defined kinematic parameters that distinguish discrete motor behaviors. Based on these kinematic details, the software assigns a discrete motor behavior using previously defined kinematic parameters. For each larva, the movement frequency was calculated by dividing the number of turns (or swims) by 60. Larvae were genotyped following behavioral testing; thus, all behavioral analysis was done blinded to the genotype.
Results
PLS3 is dramatically downregulated in smn mutants
To better understand the relationship between SMN and PLS3, we analyzed Pls3 protein levels in zebrafish smn mutants. We have previously shown that Smn protein in the smnY262stop−/− zebrafish larvae (hereafter referred to as smn−/−) was present at high levels until ∼4 dpf due to maternal contribution of RNA and protein in the yolk. These levels gradually decreased reaching low levels by ∼7 dpf until the mutants died at ∼12 dpf (Boon et al., 2009) (Fig. 1A). Analysis of smn−/− revealed a similar decrease in Pls3 protein expression. Pls3 was initially present but decreased to very low levels as Smn decreased (Fig. 1A). To determine whether Pls3 reduction was unique among actin modifying proteins, we examined profilin II levels. Profilin II is a regulator of cytoskeletal and actin dynamics in the nervous system and is known to bind to SMN (Giesemann et al., 1999). Western blot analysis revealed that profilin II (a and b) levels were not altered when Smn levels decreased. Furthermore, we examined levels of other SMN binding partners, gemin 2 and gemin 5. Gemins are proteins that form a complex with SMN necessary for snRNP assembly and splicing (Paushkin et al., 2002; Kolb et al., 2007). Gemin 2 is an SMN binding protein that decreases in cultured cells and in mice when SMN is decreased (Wang and Dreyfuss, 2001; Feng et al., 2005; Gabanella et al., 2007). Consistent with these data, we found that gemin 2 was also decreased in smn−/− zebrafish. Gemin 5 has been show in mouse SMA models and cell culture data to not be affected by SMN levels (Feng et al., 2005; Hao et al., 2007), and our analysis of gemin 5 was consistent with these results as well. Together, we show that Pls3 levels correlate with Smn levels. Moreover, our data in zebrafish are consistent with previous data in mouse and cell culture, indicating that the relationship between Smn and these proteins is conserved among species.
Figure 1.

Pls3 protein levels are severely decreased when Smn is decreased. A, Western blot analysis of protein extracted from wild-type (WT) or smn−/− larvae at 4–11 dpf. B, Western blot of 3 dpf WT and smn morphant (smn MO) larvae. C, Western blot of 3 dpf WT and pls3 morphant (pls3 MO) larvae. D, Western blot of 11 dpf WT and Tg(sodG93R) larvae. E, Western blot of 3 dpf WT and tdp43 morphants (tdp43 MO). β-Actin is used as a control.
Before ∼4 dpf, Smn levels in smn−/− larvae are present at wild-type levels due to maternally deposited RNA. Protein from these maternal transcripts can be transiently reduced using a translation blocking antisense MO against zebrafish smn (smn MO) as previously described (McWhorter et al., 2003; Carrel et al., 2006). Therefore, we asked whether Pls3 levels were decreased when Smn was reduced transiently in embryonic development. Either smn or control MO was injected into wild-type zebrafish (MO injected embryos are referred to as morphants) and protein for Western blots collected at 1 dpf. As in the smn−/− mutants, Pls3 levels were also reduced in smn morphants during embryogenesis (Fig. 1B). To address the reciprocal question, we asked whether Pls3 affects Smn protein levels. Using a morpholino against pls3, we decreased Pls3 levels but saw no change in Smn levels in 1 dpf larvae (Fig. 1C). Thus, decreasing Smn results in decreased Pls3, but decreasing Pls3 does not affect Smn.
Pls3 is not reduced in two other models of motoneuron disease
To determine whether decreased Pls3 was a common phenotype of motoneuron disease in general, we examined Pls3 expression in two zebrafish models of ALS. We had previously generated and characterized a transgenic line, Tg(sodG93R), overexpressing mutant zebrafish Sod1 as a genetic model of ALS (Ramesh et al., 2010). Subtle NMJ changes were observed at 11 dpf in these animals; thus, we examined Pls3 expression at this time. Western blot analysis revealed an increase in Sod protein consistent with overexpressing the mutant zebrafish Sod protein, SodG93R, via the transgene. However, no change was observed in Pls3 expression levels in Tg(sodG93R) larvae compared with wild-type controls (Fig. 1D). Since we do not see motor axon defects in this line, we wanted to examine a zebrafish motoneuron disease model that, like smn morphants, also showed motor axon defects. TDP43 has been genetically linked to ALS (Kwiatkowski et al., 2009) and knockdown experiments in zebrafish have shown that tdp43 morphants exhibit motor axon defects (Kabashi et al., 2010) (data not shown). Thus, we examined Pls3 expression in tdp43 morphants. Western blot analysis on 3 dpf larvae showed that neither Smn nor Pls3 were reduced in tdp43 morphants (Fig. 1E). These data indicate that decreased Pls3 levels are not a common occurrence across motoneuron diseases but may be unique to SMA.
Restoring SMN rescues Pls3 levels
If Pls3 levels were dependent on Smn levels, then we would expect that restoring Smn expression in an Smn-depleted animal would rescue Pls3 protein levels. To test this, we created a transgenic zebrafish line overexpressing RFP-tagged human SMN (RFP-hSMN) (Rossoll et al., 2003) under the control of the zebrafish heat shock 70 promoter (hsp70), Tg(hsp70:RFP-hSMN) (Table 1, Fig. 2A). Upon heat shock for 1 h at 37°C, RFP-hSMN is expressed throughout the whole embryo (Fig. 2A). To analyze the RFP-hSMN level after heat shock induction, we performed Western blot on protein obtained from embryos/larvae 0.5–120 h after heat shock. We found that RFP-hSMN was detectable 0.5 h after induction and was constant between 1 and 6 h after induction (data not shown). We then examined protein turnover after induction. We heat shocked at 1 dpf, and then looked at 1–5 d after induction (2–6 dpf). The levels were highest 1 d after induction, reduced at 3 d, and present at only very low levels at 5 d after induction (Fig. 2B, lanes 2–6). We then repeated the heat shock induction at 6 and 8 dpf, and in so doing kept the RFP-hSMN at levels comparable with endogenous Smn (Fig. 2B, lanes 6–9). Therefore, by heat shocking for 1 h every other day, we could maintain RFP-hSMN in these transgenic fish.
Table 1.
Transgenic lines
| Line | Expression | Abbreviation | Use |
|---|---|---|---|
| Tg(1.5hsp70:RFP-hSMN)os36 | RFP-tagged SMN ubiquitous after heat shock induction | Tg(hsp70:RFP-SMN) | Conditionally inducing SMN (Figs. 2, 3) |
| Tg(mnx1:1.5hsp70:hPLS3;0.6hsp70:GFP)os42 | Human PLS3 and GFP in motoneurons and their axons | Tg(hsp70:PLS3) | Conditionally inducing PLS3 (Figs. 3–5) |
| Human PLS3 and GFP ubiquitous after heat shock induction | |||
| Tg(mnx1:hPLS3;0.6hsp70:GFP)os41 | Human PLS3 and GFP in motoneurons and their axons | Tg(mnx1:PLS3) | Adding PLS3 to motoneurons (Figs. 5, 7–9) |
| GFP ubiquitous after heat shock induction | |||
| Tg(mnx1:0.6hsp70:GFP)os26 | GFP in motoneurons and their axons | Tg(mnx1:GFP) | Visualizing motor axons (Fig. 7) |
| GFP ubiquitous after heat shock induction |
Transgenic lines used in this work are listed along with their expression patterns. For details, see Materials and Methods.
Figure 2.
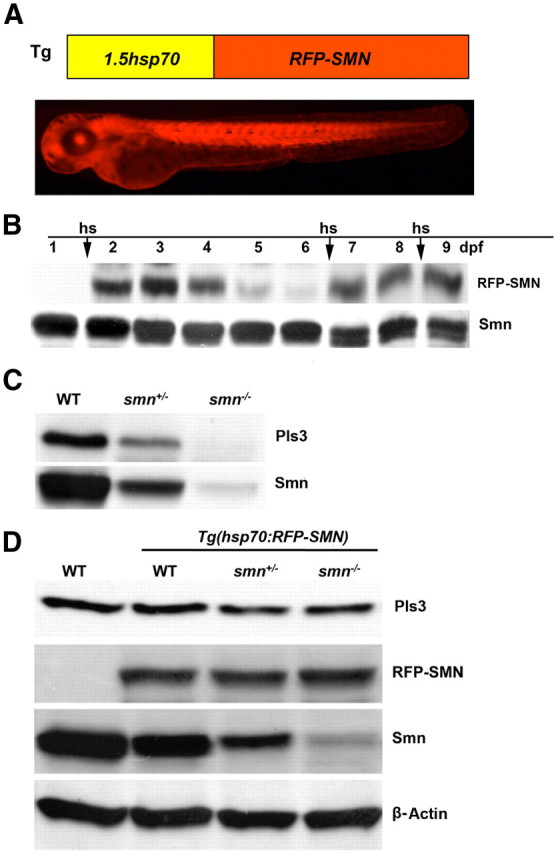
Inducing SMN rescues Pls3 expression in smn mutants. A, Schematic diagram of the 1.5 kb zebrafish heat shock 70 promoter (hsp70) controlling expression of RFP tagged human SMN (RFP-SMN) transgene and a 2 dpf Tg(hsp70:RFP-SMN) embryo 1 d after heat shock (hs). B, RFP-SMN protein levels after heat shock induction. Lane 1, 1 dpf embryo preinduction; lanes 2–6, 2–6 dpf larvae after induction (hs) at 1 dpf; lanes 7 and 8, 7–8 dpf larvae after induction (hs) again at 6 dpf; lane 9, 9 dpf larvae after induction (hs) again at 8 dpf. C, Western blot for endogenous Smn and Pls3 in wild-type (WT), smn heterozygous (smn+/−), and smn homozygous (smn−/−) mutants at 8 dpf. D, Western blot of protein from 8 dpf Tg(hsp70:RFP-SMN) larvae after heat shocking at 5 and 7 dpf. Pls3, RFP-SMN, Smn, and β-Actin were analyzed in WT, Tg(hsp70:RFP-hSMN), Tg(hsp70:RFP-hSMN);smn+/−, and Tg(hsp70:RFP-hSMN);smn−/−.
To determine whether restoring SMN to fish with low Smn affects Pls3 protein levels, we crossed this transgenic line onto the smn−/− background. Embryos were first heat shocked at 1 dpf to select transgenic embryos, and then those carrying the transgene were heat shocked again at 5 and 7 dpf. At 8 dpf, all of the larvae were genotyped and protein extracted. Western blots revealed that when RFP-SMN was added back to smn−/− larvae, Pls3 levels increased to levels comparable with those seen in wild types (Fig. 2C,D). These data indicate that SMN levels modulate Pls3 protein levels.
SMN does not affect PLS3 transcription, PLS3 RNA stability, or PLS3 protein stability
To determine whether reduced Pls3 expression was the result of low levels of pls3 RNA, we examined pls3 RNA in smn−/− larvae. Eight-day-old larvae from an smn+/− incross were genotyped and RNA prepared and quantitated by qRT-PCR. We found that pls3 RNA levels in wild-type and smn−/− were not statistically different (Fig. 3A). To ensure that the Tg(hsp70:RFP-SMN) was not altering pls3 RNA levels, we analyzed pls3 RNA in Tg(hsp70:RFP-SMN);smn−/− larvae with and without heat shock. Again, we found that the pls3 RNA levels were not affected (Fig. 3A). SMN is known to function in the assembly of RNAs and proteins important for RNA splicing (Meister et al., 2002; Paushkin et al., 2002). Thus, we examined whether pls3 RNA was misspliced in smn mutants. RNA was extracted from 11 dpf smn−/− larvae, and full-length zebrafish pls3 RNA was amplified by PCR. PCR products were run on 8% polyacrylamide gel to aid in resolving any splice products. Using this approach, we did not find any alterations in splicing of endogenous pls3 (data not shown). These data indicate that pls3 RNA is not affected by Smn.
Figure 3.
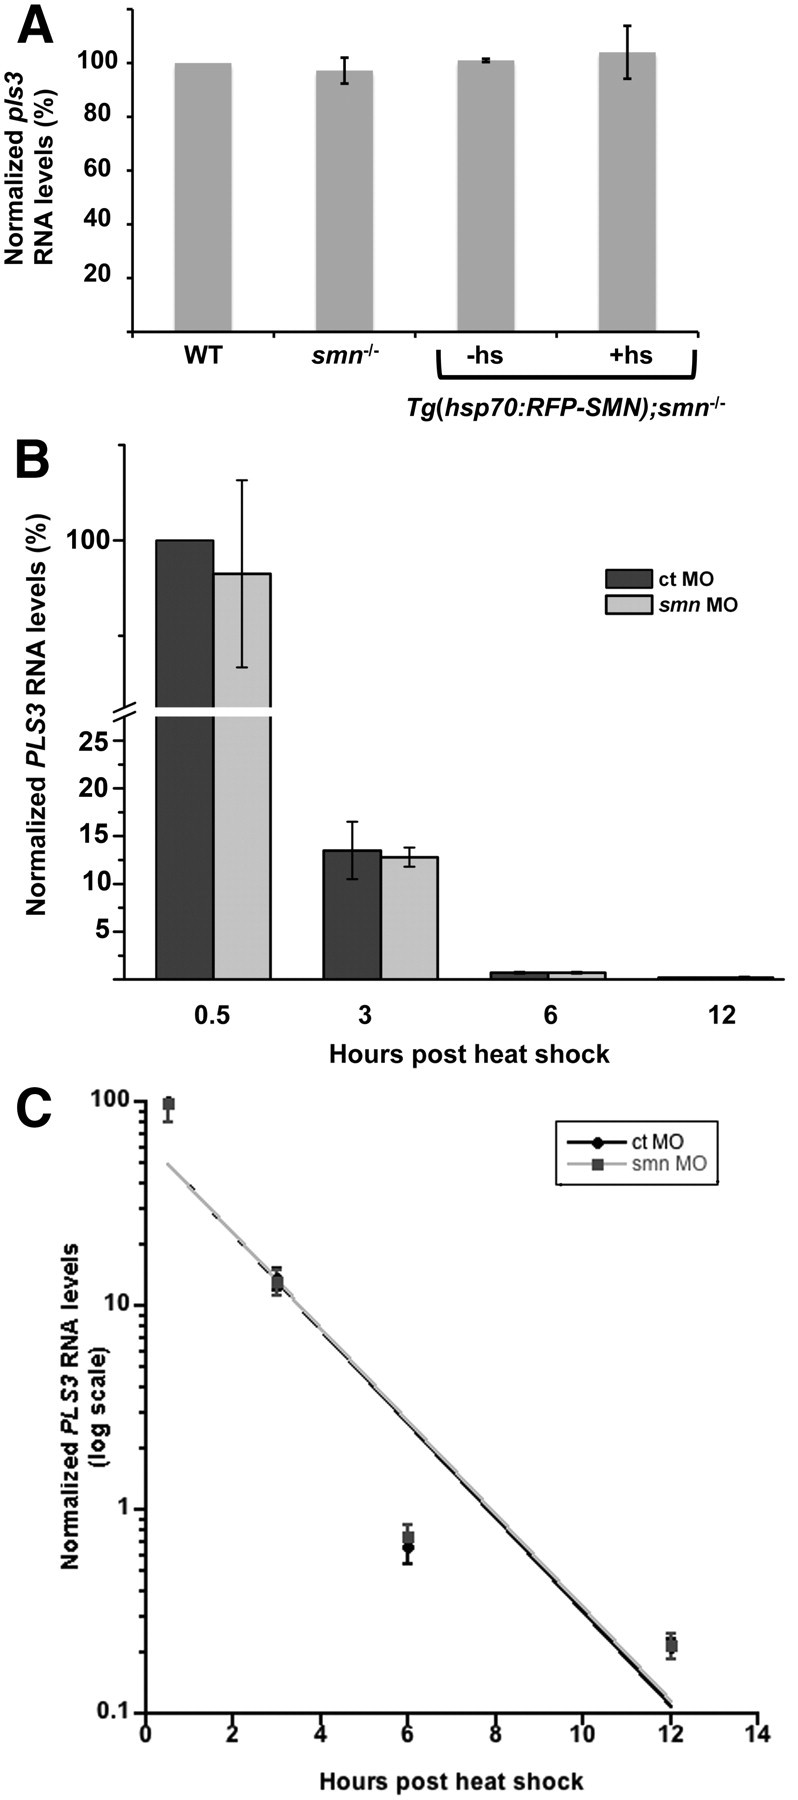
Pls3 RNA is not affected by Smn reduction. A, To analyze endogenous zebrafish pls3 RNA, RNA was isolated from 8 dpf WT, smn−/−, and Tg(hsp70:RFP-SMN);smn−/− larvae with (+hs) or without (−hs) heat shock at 5 and 7 dpf from three separate experiments. Quantitative RT-PCR was run, and data were normalized to WT and plotted as a percentage (mean ± SD). B, To analyze PLS3 stability, PLS3 RNA levels were measured after a pulse of PLS3 RNA. Tg(hsp70:PLS3) embryos were injected with either control (ct) or smn MO at the one- to two-cell stage. At 1 dpf, embryos were heat shocked and RNA was isolated 0.5, 3, 6, and 12 h after heat shock. RNA levels were determined by qRT-PCR from three separate experiments. Values were normalized to PLS3 at 0.5 h after heat shock from control morphants and plotted as a percentage (mean ± SD). C, To calculate the half-life of PLS3 RNA in control and smn morphants, qRT-PCR values were normalized to the PLS3 level at 0.5 h after heat shock from control morphants and plotted as exponential decay. The half-life was derived from the slope (see Materials and Methods).
To address whether Smn could be affecting pls3 RNA stability, we generated a transgenic line driving human PLS3 under the hsp70 promoter, Tg(hsp70:PLS3) (Table 1). This transgene was used to induce a pulse of PLS3 expression throughout the animal upon heat shock induction. By measuring PLS3 turnover in wild-type and Smn-depleted larvae, we could calculate PLS3 RNA half-life. We injected one- to two-cell Tg(hsp70:PLS3) embryos with control or smn MO and at 1 dpf heat shocked the embryos to induce PLS3. RNA was collected at various time points and levels quantitated using qRT-PCR (Fig. 3B). RNA decay was then calculated from the slope of the log plot (see Materials and Methods) (Fig. 3C). Using this approach, we found no difference in the amount of PLS3 RNA generated in control versus smn morphants (Fig. 3B). Moreover, we found that the half-life of PLS3 RNA in control and smn morphants was not statistically different (1.31 ± 0.02 vs 1.33 ± 0.01 h; p = 0.42) indicating that PLS3 RNA stability was not affected by Smn levels (Fig. 3C).
Since PLS3 RNA is unaffected by Smn levels and thus could not explain why Pls3 levels decrease in smn−/−, we next examined the effect of Smn on PLS3 protein induction and stability. We performed the same experiment as above for analyzing RNA, but this time analyzed PLS3 protein levels. We heat shocked control and smn morphant Tg(hsp70:PLS3) embryos at 1 dpf and collected protein 0.5 h after heat shock. Surprisingly, we found at this early time point that control morphants had a 4-fold greater amount of induced PLS3 than smn morphants (Fig. 4A,B). To determine whether this was due to protein stability, we analyzed protein turnover by collecting larvae and extracting protein at 3–6 d after induction. At all times examined, there was significantly less PLS3 protein in smn compared with control morphants as determined by Western blot (Fig. 4C). We also found that the half-life of PLS3 in control and smn morphants was not different (1.92 ± 0.09 vs 1.72 ± 0.15 d; p = 0.14) (Fig. 4D). Together, these data rule out a role for Smn in PLS3 transcription, splicing, and RNA and protein stability, and suggest that Smn affects PLS3 translation.
Figure 4.

PLS3 induction is decreased when Smn is reduced. A, B, Western blot (A) and quantitation (mean ± SD) (B) of protein from 1 dpf Tg(hsp70:PLS3) embryos injected with control (ct) or smn MO 0.5 h either with (+hs) or without heat shock (−hs). C, Western blot of protein from Tg(hsp70:PLS3) embryos injected with control (ct) or smn MO and heat shocked at 1 dpf. Larvae were collected at 3, 4, 5, and 6 d after heat shock. A wild-type (WT) 7 dpf larvae was included as a control. D, To calculate the half-life of PLS3, protein values were normalized to control MO at 3 d after heat shock, plotted as exponential decay, and the half-life derived from the slope. Data were obtained from three separate experiments.
Low levels of PLS3 do not extend survival of smn−/− fish
Although we could not induce high levels of PLS3 in smn−/−, we wanted to know whether even this slight increase could rescue survival on a low SMN background. For these experiments, we used the transgenic line discussed above, Tg(hsp70:PLS3), to express PLS3 ubiquitously upon heat shock induction (Table 1). To elucidate the role of PLS3 solely in motoneurons, we also generated a transgenic line expressing PLS3 just in motoneurons by using the zebrafish mnx1 (hb9) promoter driving expressing of PLS3, Tg(mnx1:PLS3) (Table 1). We crossed both the Tg(hsp70:PLS3) and the Tg(mnx1:PLS3) onto the smn−/− background. Transgenic fish were selected based on GFP expression (see Materials and Methods) (Table 1) at 1 dpf, and then grown until 20 dpf, and survival determined as described previously (Boon et al., 2009). Fish carrying Tg(hsp70:PLS3) were heat shocked every other day to induce ubiquitous expression. Analyzing these lines, we found no difference in the survival of smn−/−, Tg(hsp70:PLS3);smn−/−, and Tg(mnx1:PLS3);smn−/− larvae (Fig. 5). These data indicate that low levels of PLS3 cannot rescue survival of smn−/− larvae. We are not able to test higher levels of PLS3 since PLS3 is not produced well when Smn levels are low (Figs. 1, 2, 4).
Figure 5.

Low levels of PLS3 do not extend survival of smn−/− larvae. Transgenes that drive expression of PLS3 just in motoneurons, Tg(mnx1:PLS3), or ubiquitously upon heat shock induction, Tg(hsp70:PLS3), were crossed onto the smn−/− background. Survival was monitored until 20 dpf, and a Kaplan–Meier plot was generated. Blue line, smn−/−, n = 22; green line, Tg(mnx1:PLS3);smn−/−, n = 18; red line, Tg(hsp70:PLS3); smn−/− (−hs), n = 21; purple line, Tg(hsp70:PLS3); smn−/− (+hs), n = 22.
Expressing PLS3 in motoneurons rescues NMJ defects in smn mutants
Our previous data showed that PLS3 could rescue the motor axon defects caused by low Smn levels in zebrafish (Oprea et al., 2008). We also reported in this paper that decreasing PLS3 using a MO was difficult as the embryos were either deformed or died. We have since performed a large number of injections using two different pls3 MOs and found a concentration of the translation blocking pls3 MO that decreased Pls3 protein (Fig. 6A) but did not affect embryonic development. This was confirmed by morphological analysis (Fig. 6B,C) and primordia (prim) staging at ∼28 hpf with control morphants at prim stage of 10.0 ± 0.5 (n = 9) and pls3 morphants at prim stage 9.8 ± 0.9 (mean ± SD) (Kimmel et al., 1995). Analysis of pls3 morphants revealed that these embryos displayed motor axon defects such as aberrant branching and large growth cones (Fig. 7A,C,F). These defects were similar, but not identical, to the motor axon defects in smn morphants and show that decreasing Pls3 can lead to motor axon defects. We did not observe defects in the trigeminal peripheral sensory axons, Rohon–Beard peripheral sensory axons, or the lateral line nerve in pls3 morphants, suggesting that axial motor axons are more sensitive to decreased Pls3 levels (Fig. 6D–G). To show that these motor axon defects were indeed caused by a decrease in Pls3, we coinjected pls3 MO and PLS3 RNA and found that we could rescue the motor axon defects compared with pls3 morphants (Fig. 7A–D,F; p < 0.0001). We next asked whether decreased Pls3 in motoneurons caused these defects. To test this, we injected pls3 MO into Tg(mnx1:PLS3) embryos that express PLS3 in their motoneurons and observed statistically fewer motor axon defects compared with pls3 morphants (p < 0.0001; Fig. 7C,E,F). These data indicate that motor axon defects are indeed caused by decreasing Pls3 in motoneurons since they can be statistically rescued by driving PLS3 expression solely in motoneurons.
Figure 6.
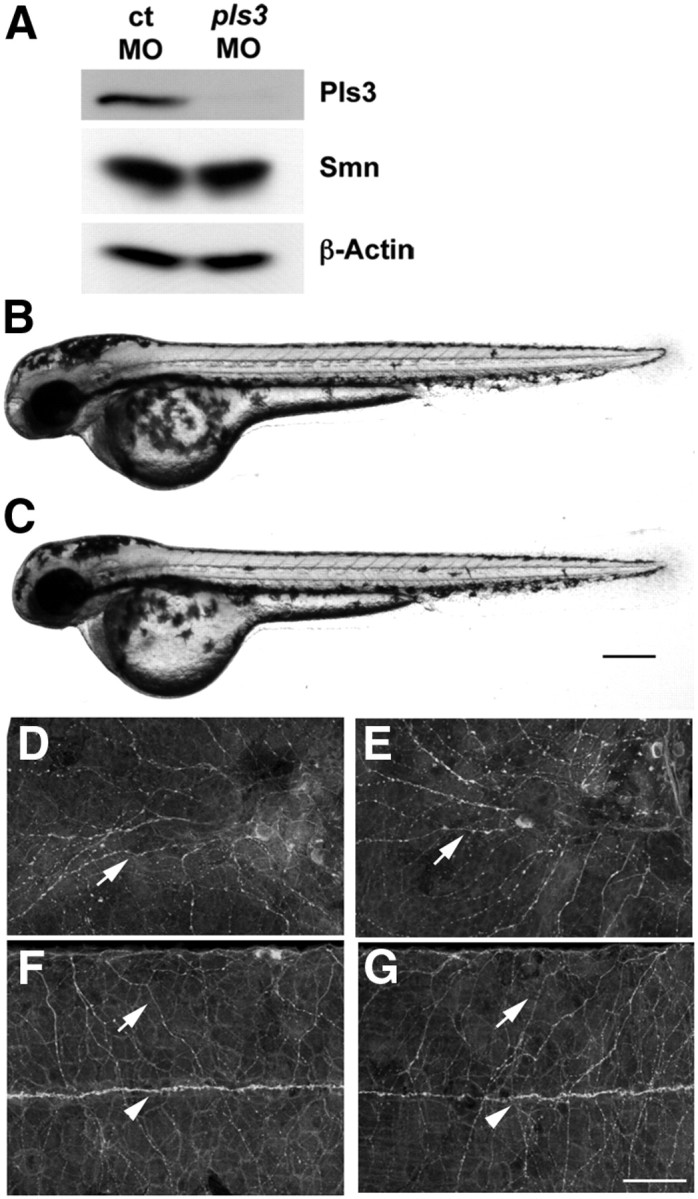
pls3 morphants develop normally. A, Western blot of protein from 1 dpf control (ct) and pls3 MO-injected embryos. Lateral views of 2 dpf live control (B) and pls3 (C) morphants. Acetylated tubulin labeling showing trigeminal sensory axons (D, E, arrows), Rohon–Beard sensory axons (F, G, arrows), and the lateral line nerve (F, G, arrowheads) in 2 dpf control (D, F) and pls3 (E, G) morphants. Scale bars: (in B) B, C, 120 μm; (in G) D–G, 50 μm.
Figure 7.

Decreasing Pls3 independent of Smn causes motor axon defects. Lateral views of Tg(mnx1:GFP) injected with ct MO (n = 75) (A), PLS3 RNA (n = 72) (B), pls3 MO (n = 78) (C), or pls3 MO plus PLS3 RNA (n = 75) (D). E, Tg(mnx1:PLS3) injected with pls3 MO (n = 78). F, Defects were scored at 36 hpf from three separate injections, plotted as mean ± SD, and analyzed for significance by Mann–Whitney rank test. ***p < 0.0001 for pls3 MO versus pls3 MO plus PLS3 RNA and pls3 MO versus Tg(mnx1:PLS3) injected with pls3 MO. For all experiments, the translation blocking pls3 MO was used, and only developmentally normal embryos, as shown in Figure 6, were scored. Scale bar, 50 μm.
We next wanted to test whether PLS3, even at low levels, could rescue other defects in the neuromuscular system caused by Smn deficiency. We previously showed that smn−/− larvae had decreased SV2 NMJ expression at 11 dpf (Boon et al., 2009). This indicates that the NMJs are altered when Smn levels are depleted. Furthermore, expressing human SMN protein exclusively in motoneurons in these mutants rescued the SV2 phenotype (Boon et al., 2009). To test whether PLS3 could rescue this defect, we analyzed NMJs in Tg(mnx1:PLS3);smn−/− fish. At 11 dpf, fish were genotyped and stained with SV2 antibody (Fig. 8A). Quantification of SV2 immunohistochemistry confirmed earlier data showing that smn−/− had decreased SV2 at 11 dpf (Fig. 8) (Boon et al., 2009). Importantly, when PLS3 was expressed in motoneurons, the SV2 defect was rescued (p < 0.0001; Fig. 8). These data reveal that PLS3 expressed in motoneurons, even at low levels, rescues the presynaptic NMJ defect caused by low Smn.
Figure 8.

Adding PLS3 back to motoneurons rescues NMJ defects in smn−/− larvae. A, Lateral view of 11 dpf. Left panel, Tg(mnx1:PLS3); middle panel, Tg(mnx1:GFP);smn−/−; and right panel, Tg(mnx1:PLS3);smn−/− (n = 8 fish for each group) immunolabeled with anti-SV2. B, Quantification of the number of pixels per area (A, white box) using confocal microscopy and MetaMorph software. Six myotomes were measured per fish. ***p < 0.0001 for smn−/− versus Tg(mnx1:PLS3);smn−/− (Student's t test). Scale bar, 80 μm.
PLS3 in motoneurons rescues movement deficits in smn mutants
To determine whether rescue of the SV2 NMJ defect resulted in enhanced motor function, we examined movement behavior in smn−/− fish in the presence of PLS3. Zebrafish have characteristic movements that can be measured by analysis of motor output (Wolman and Granato, 2012). To capture larval motor behaviors, we examined the initiation of spontaneous turning and swimming bouts at 9 dpf by recording video at 1000 frames/s for 400 ms at 3 s intervals. Using the automated tracking analysis FLOTE (Burgess and Granato, 2007a,b), we determined whether each larva performed a “swim,” “routine turn,” or did not move for 60 trials of 400 ms videos. Interestingly, smn−/− larvae initiated turning and swimming bouts significantly less frequently than their wild-type and smn+/− siblings (Fig. 9; p < 0.001), suggesting that the presynaptic motoneuron deficits in smn−/− mutants reduced motor activity. To test whether PLS3 could rescue these motor defects, we analyzed motor behavior in Tg(mnx1:PLS3);smn−/− larvae. We found that driving PLS3 in motoneurons could significantly rescue the behavioral deficits in smn−/− larvae. Indeed, Tg(mnx1:PLS3);smn−/− larvae initiated turning and swimming bouts statistically better than smn−/− mutants (p < 0.001) and similar to wild types (p = 0.16). These data show that PLS3 expression in motoneurons rescues the motor behavioral deficits caused by low levels of Smn, indicating that loss of Pls3 significantly contributes to SMA phenotypes.
Figure 9.

Adding PLS3 back to motoneurons rescues motor defects in smn−/− larvae. The frequency of spontaneous turning and swimming bouts performed by 9 dpf larvae were measured. Data from each group were normalized to the movement frequency of wild-type larvae. smn−/− mutants performed fewer turns and swims than their wild-type siblings (***p < 0.0001) and driving PLS3 in motoneurons, Tg(mnx1:PLS3);smn−/−, significantly rescued this deficit (**p < 0.001) (Student's t test). Data are plotted as mean ± SEM, and the number of larvae examined (n) is shown within each bar.
Discussion
PLS3 is an actin-binding protein that decreases the disassembly rate of actin and controls actin turnover and the length of actin filaments (Giganti et al., 2005). Because actin dynamics are important for both axonal outgrowth and synaptic regulation (Cingolani and Goda, 2008; Dent et al., 2011), alterations in actin dynamics can greatly affect these processes. Our data show that, when Smn is decreased, Pls3 levels are also decreased and this is likely controlled at the level of translation. This causes presynaptic changes at the NMJ and aberrant motor behaviors that can be significantly rescued by adding low levels of PLS3 back to motoneurons. Decreasing Pls3 independent of Smn supports that motor axons are sensitive to low levels of Pls3 even more so than other axons. Therefore, when SMN levels are decreased, as in SMA, PLS3 decreases, thus compromising axons and synapses, leading to motoneuron dysfunction. This is a cell-autonomous effect that can be rescued by adding PLS3 back to motoneurons. These data support that changes in the actin cytoskeleton contribute to SMA phenotypes.
Work by others has also shown a link between SMA phenotypes and actin dynamics (Bowerman et al., 2007, 2009, 2010; Nölle et al., 2011). RhoA, a small GTPase that promotes growth cone collapse and axon stalling, increases when SMN is depleted from cultured PC12 cells (Bowerman et al., 2007). In addition rho-kinase is upregulated via a mechanism that includes profilin (Nölle et al., 2011), a protein that binds SMN (Giesemann et al., 1999). Blocking rho-kinase improved NMJs and survival in an intermediate SMA mouse model (Bowerman et al., 2010), supporting that changes in the actin cytoskeleton are an important component of SMA phenotypes. Data from an SMA mouse model also supports a link between SMN and PLS3 levels. Bowerman et al. (2009) showed in a mild model of SMA that PLS3 is decreased ∼40% in spinal cord. The less dramatic decrease likely derives from the fact that these animals have higher levels of SMN than smn−/− zebrafish and are a milder model of SMA. Two studies in humans have shown a correlation between PLS3 expression in blood and SMA severity in females (Oprea et al., 2008; Stratigopoulos et al., 2010), while another failed to show a strong correlation (Bernal et al., 2011). It is perhaps not surprising that these studies are somewhat variable since a modifier may not be present in all patient populations. It may be that PLS3 levels are higher in some individuals and that this affords protection when SMN levels are low. Last, genetic modifier screens in Caenorhabditis elegans and Drosophila have also identified pls3 as a gene that can modify phenotypes caused by low Smn levels (Dimitriadi et al., 2010). Thus, PLS3 as a modifier spans human, zebrafish, Drosophila, and C. elegans. SMA models across species have indicated defects at synapses, which depend on endocytosis for synaptic vesicle recycling. Interestingly the yeast homolog of pls3, sac6, affects endocytosis (Adams et al., 1989; Kübler and Riezman, 1993), and a report has shown a link between huntingtin, ataxin 2, the endocytic protein endophilin, and Pls3 (Ralser et al., 2005). Thus, Pls3 pathways may play an important role in synaptic maintenance and function in disease.
We were surprised to find such a dramatic decrease in Pls3 in smn−/− larvae. To investigate the mechanism, we analyzed both RNA and protein levels. Decreased levels of SMN lead to defects in RNA splicing (Gabanella et al., 2007; Zhang et al., 2008); however, we did not find any splicing defects in smn−/− pls3 or changes in pls3 RNA levels or RNA decay. We therefore reasoned that Smn could be impacting either Pls3 protein translation or stability. To look at these parameters, we analyzed production and stability of PLS3 via an inducible transgene. As early as 0.5 h after induction, there was dramatically less (approximately fourfold) PLS3 protein under conditions of low Smn compared with wild-type. This was not due to delayed production, since at all subsequent time points PLS3 levels were significantly lower compared with PLS3 levels in wild types. We reasoned that this could be caused by decreased PLS3 stability. It has been suggested that the decrease in gemin 2 observed upon SMN reduction is due to decreased gemin 2 protein stability (Feng et al., 2005). Thus, we examined PLS3 protein half-life in the context of low Smn but found no significant difference when compared with PLS3 half-life in wild types. These data strongly suggest that PLS3 translation is severely compromised when SMN is decreased. The mechanism and whether SMN is acting directly or indirectly in this process remains to be determined. Whereas the endogenous zebrafish pls3 has introns and a 3′-UTR, the human PLS3 cDNA used to make the transgenics did not contain either, yet both the endogenous and transgenic PLS3 were affected similarly when Smn was decreased. This does not, however, rule out mechanisms such as micro-RNAs (miRNAs) as some have been shown to bind to sequences in open reading frames (Forman et al., 2008; Huang et al., 2010). There is also a suggested link between SMN and miRNAs. Gemin3, which binds to SMN, is also found in a complex with eIF2C2 and miRNAs (Mourelatos et al., 2002). Since SMN binding to gemin 3 is decreased when SMN levels are decreased (Charroux et al., 1999), this could affect gemin 3 function. Another possible mechanism is that decreased Smn levels could cause a protein change (perhaps because it is splicing improperly) in a protein important for translation initiation (Sonenberg and Hinnebusch, 2009). Although the mechanism of how SMN is affecting translation is unknown at this time, it raises the question of whether other proteins are also not effectively translated under conditions of low SMN.
Because PLS3 could not be expressed well in an Smn-deficient background, we really could not test its impact on survival. Therefore, it is rather remarkable that PLS3 from the Tg(mnx1:PLS3) transgene could rescue both the SV2 presynaptic defect and the motor behavior. This indicates that even small increases in PLS3 can have an effect on neuromuscular phenotypes. This is a characteristic consistent with a modifier in that small changes in a modifier protein would be expected to alter the phenotype. We had previously shown that driving SMN in motoneurons on a smn−/− background could rescue the SV2 NMJ defect but could not rescue survival (Boon et al., 2009), much like driving PLS3 in motoneurons could rescue the SV2 NMJ defect and motor behavior but not survival. These data indicate that SMN levels need to reach a certain threshold in all cells, not just motoneurons, for survival of the animal. This is consistent with data from a reciprocal experiment in SMA mice showing that decreasing SMN just in motoneurons yields a more mild disease phenotype compared with when SMN is decreased to low levels in all tissues (Park et al., 2010).
Our data support a role for SMN in PLS3 translation and indicate that decreased PLS3 levels lead to phenotypes seen in SMA such as presynaptic defects and movement defects. Thus, PLS3 is not merely an informational suppressor but has a direct link to SMN and SMA. We speculate that decreased PLS3 contributes to SMA phenotypes, along with other cellular defects caused by low SMN levels such as splicing (Gabanella et al., 2007; Zhang et al., 2008) and changes in RNA localization in motoneurons (Rossoll and Bassell, 2009; Akten et al., 2011; Fallini et al., 2011). The accumulation of these defects together could lead to SMA. These data also raise the issue of whether translation control could be a downstream effect of low SMN.
Footnotes
This work was supported by National Institutes of Health Grant NS050414 (C.E.B.), by The SMA Foundation (C.E.B.) with additional support from The Ohio State University Neuroscience Center Core Grant P30 NS045758, by National Research Service Award Postdoctoral Fellowship 5F32EY019434-03 (M.W.), and by National Institutes of Health Grant MH092257 (M.G.). We thank The Ohio State University fish facility staff for fish care and Dr. Brunhilde Wirth for the PLS3 antibody, Dr. Livio Pellizzoni for the gemin 2 antibody, and Dr. Glenn Morris for the SMN, gemin 5, and profillin 2 antibodies. The SV2 monoclonal antibody developed by K. M. Buckley was obtained from the Developmental Studies Hybridoma Bank developed under the auspices of the National Institute of Child Health and Human Development and maintained by the Department of Biology, University of Iowa (Iowa City, IA).
The authors declare no competing financial interests.
References
- Adams AE, Botstein D, Drubin DG. A yeast actin-binding protein is encoded by SAC6, a gene found by suppression of an actin mutation. Science. 1989;243:231–233. doi: 10.1126/science.2643162. [DOI] [PubMed] [Google Scholar]
- Akten B, Kye MJ, Hao le T, Wertz MH, Singh S, Nie D, Huang J, Merianda TT, Twiss JL, Beattie CE, Steen JA, Sahin M. Interaction of survival of motor neuron (SMN) and HuD proteins with mRNA cpg15 rescues motor neuron axonal deficits. Proc Natl Acad Sci U S A. 2011;108:10337–10342. doi: 10.1073/pnas.1104928108. [DOI] [PMC free article] [PubMed] [Google Scholar]
- Bernal S, Also-Rallo E, Martínez-Hernández R, Alías L, Rodríguez-Alvarez FJ, Millán JM, Hernández-Chico C, Baiget M, Tizzano EF. Plastin 3 expression in discordant spinal muscular atrophy (SMA) siblings. Neuromuscul Disord. 2011;21:413–419. doi: 10.1016/j.nmd.2011.03.009. [DOI] [PubMed] [Google Scholar]
- Boon KL, Xiao S, McWhorter ML, Donn T, Wolf-Saxon E, Bohnsack MT, Moens CB, Beattie CE. Zebrafish survival motor neuron mutants exhibit presynaptic neuromuscular junction defects. Hum Mol Genet. 2009;18:3615–3625. doi: 10.1093/hmg/ddp310. [DOI] [PMC free article] [PubMed] [Google Scholar]
- Bowerman M, Shafey D, Kothary R. Smn depletion alters profilin II expression and leads to upregulation of the RhoA/ROCK pathway and defects in neuronal integrity. J Mol Neurosci. 2007;32:120–131. doi: 10.1007/s12031-007-0024-5. [DOI] [PubMed] [Google Scholar]
- Bowerman M, Anderson CL, Beauvais A, Boyl PP, Witke W, Kothary R. SMN, profilin IIa and plastin 3: a link between the deregulation of actin dynamics and SMA pathogenesis. Mol Cell Neurosci. 2009;42:66–74. doi: 10.1016/j.mcn.2009.05.009. [DOI] [PubMed] [Google Scholar]
- Bowerman M, Beauvais A, Anderson CL, Kothary R. Rho-kinase inactivation prolongs survival of an intermediate SMA mouse model. Hum Mol Genet. 2010;19:1468–1478. doi: 10.1093/hmg/ddq021. [DOI] [PubMed] [Google Scholar]
- Burgess HA, Granato M. Sensorimotor gating in larval zebrafish. J Neurosci. 2007a;27:4984–4994. doi: 10.1523/JNEUROSCI.0615-07.2007. [DOI] [PMC free article] [PubMed] [Google Scholar]
- Burgess HA, Granato M. Modulation of locomotor activity in larval zebrafish during light adaptation. J Exp Biol. 2007b;210:2526–2539. doi: 10.1242/jeb.003939. [DOI] [PubMed] [Google Scholar]
- Burghes AH, Beattie CE. Spinal muscular atrophy: why do low levels of survival motor neuron protein make motor neurons sick? Nat Rev Neurosci. 2009;10:597–609. doi: 10.1038/nrn2670. [DOI] [PMC free article] [PubMed] [Google Scholar]
- Carrel TL, McWhorter ML, Workman E, Zhang H, Wolstencroft EC, Lorson C, Bassell GJ, Burghes AH, Beattie CE. Survival motor neuron function in motor axons is independent of functions required for small nuclear ribonucleoprotein biogenesis. J Neurosci. 2006;26:11014–11022. doi: 10.1523/JNEUROSCI.1637-06.2006. [DOI] [PMC free article] [PubMed] [Google Scholar]
- Charroux B, Pellizzoni L, Perkinson RA, Shevchenko A, Mann M, Dreyfuss G. Gemin3: A novel DEAD box protein that interacts with SMN, the spinal muscular atrophy gene product, and is a component of gems. J Cell Biol. 1999;147:1181–1194. doi: 10.1083/jcb.147.6.1181. [DOI] [PMC free article] [PubMed] [Google Scholar]
- Cingolani LA, Goda Y. Actin in action: the interplay between the actin cytoskeleton and synaptic efficacy. Nat Rev Neurosci. 2008;9:344–356. doi: 10.1038/nrn2373. [DOI] [PubMed] [Google Scholar]
- Dalgin G, Ward AB, Hao le T, Beattie CE, Nechiporuk A, Prince VE. Zebrafish mnx1 controls cell fate choice in the developing endocrine pancreas. Development. 2011;138:4597–4608. doi: 10.1242/dev.067736. [DOI] [PMC free article] [PubMed] [Google Scholar]
- Dent EW, Gupton SL, Gertler FB. The growth cone cytoskeleton in axon outgrowth and guidance. Cold Spring Harb Perspect Biol. 2011;3:pii, a001800. doi: 10.1101/cshperspect.a001800. [DOI] [PMC free article] [PubMed] [Google Scholar]
- Dimitriadi M, Sleigh JN, Walker A, Chang HC, Sen A, Kalloo G, Harris J, Barsby T, Walsh MB, Satterlee JS, Li C, Van Vactor D, Artavanis-Tsakonas S, Hart AC. Conserved genes act as modifiers of invertebrate SMN loss of function defects. PLoS Genet. 2010;6:e1001172. doi: 10.1371/journal.pgen.1001172. [DOI] [PMC free article] [PubMed] [Google Scholar]
- Fallini C, Zhang H, Su Y, Silani V, Singer RH, Rossoll W, Bassell GJ. The survival of motor neuron (SMN) protein interacts with the mRNA-binding protein HuD and regulates localization of poly(A) mRNA in primary motor neuron axons. J Neurosci. 2011;31:3914–3925. doi: 10.1523/JNEUROSCI.3631-10.2011. [DOI] [PMC free article] [PubMed] [Google Scholar]
- Feng W, Gubitz AK, Wan L, Battle DJ, Dostie J, Golembe TJ, Dreyfuss G. Gemins modulate the expression and activity of the SMN complex. Hum Mol Genet. 2005;14:1605–1611. doi: 10.1093/hmg/ddi168. [DOI] [PubMed] [Google Scholar]
- Flanagan-Steet H, Fox MA, Meyer D, Sanes JR. Neuromuscular synapses can form in vivo by incorporation of initially aneural postsynaptic specializations. Development. 2005;132:4471–4481. doi: 10.1242/dev.02044. [DOI] [PubMed] [Google Scholar]
- Forman JJ, Legesse-Miller A, Coller HA. A search for conserved sequences in coding regions reveals that the let-7 microRNA targets Dicer within its coding sequence. Proc Natl Acad Sci U S A. 2008;105:14879–14884. doi: 10.1073/pnas.0803230105. [DOI] [PMC free article] [PubMed] [Google Scholar]
- Gabanella F, Butchbach ME, Saieva L, Carissimi C, Burghes AH, Pellizzoni L. Ribonucleoprotein assembly defects correlate with spinal muscular atrophy severity and preferentially affect a subset of spliceosomal snRNPs. PLoS One. 2007;2:e921. doi: 10.1371/journal.pone.0000921. [DOI] [PMC free article] [PubMed] [Google Scholar]
- Giesemann T, Rathke-Hartlieb S, Rothkegel M, Bartsch JW, Buchmeier S, Jockusch BM, Jockusch H. A role for polyproline motifs in the spinal muscular atrophy protein SMN. Profilins bind to and colocalize with smn in nuclear gems. J Biol Chem. 1999;274:37908–37914. doi: 10.1074/jbc.274.53.37908. [DOI] [PubMed] [Google Scholar]
- Giganti A, Plastino J, Janji B, Van Troys M, Lentz D, Ampe C, Sykes C, Friederich E. Actin-filament cross-linking protein T-plastin increases Arp2/3-mediated actin-based movement. J Cell Sci. 2005;118:1255–1265. doi: 10.1242/jcs.01698. [DOI] [PubMed] [Google Scholar]
- Glenney JR, Jr, Kaulfus P, Matsudaira P, Weber K. F-actin binding and bundling protein properties of Fimbrin, a major cytoskeletal protein of microvillus core filaments. J Biol Chem. 1981;256:9283–9288. [PubMed] [Google Scholar]
- Halloran MC, Sato-Maeda M, Warren JT, Su F, Lele Z, Krone PH, Kuwada JY, Shoji W. Laser-induced gene expression in specific cells of transgenic zebrafish. Development. 2000;127:1953–1960. doi: 10.1242/dev.127.9.1953. [DOI] [PubMed] [Google Scholar]
- Hao le T, Fuller HR, Lam le T, Le TT, Burghes AH, Morris GE. Absence of gemin5 from SMN complexes in nuclear Cajal bodies. BMC Cell Biol. 2007;8:28. doi: 10.1186/1471-2121-8-28. [DOI] [PMC free article] [PubMed] [Google Scholar]
- Hao le T, Burghes AH, Beattie CE. Generation and characterization of a genetic zebrafish model of SMA carrying the human SMN2 gene. Mol Neurodegener. 2011;6:24. doi: 10.1186/1750-1326-6-24. [DOI] [PMC free article] [PubMed] [Google Scholar]
- Huang S, Wu S, Ding J, Lin J, Wei L, Gu J, He X. MicroRNA-181a modulates gene expression of zinc finger family members by directly targeting their coding regions. Nucleic Acids Res. 2010;38:7211–7218. doi: 10.1093/nar/gkq564. [DOI] [PMC free article] [PubMed] [Google Scholar]
- Kabashi E, Lin L, Tradewell ML, Dion PA, Bercier V, Bourgouin P, Rochefort D, Bel Hadj S, Durham HD, Vande Velde C, Rouleau GA, Drapeau P. Gain and loss of function of ALS-related mutations of TARDBP (TDP-43) cause motor deficits in vivo. Hum Mol Genet. 2010;19:671–683. doi: 10.1093/hmg/ddp534. [DOI] [PubMed] [Google Scholar]
- Kimmel CB, Ballard WW, Kimmel SR, Ullmann B, Schilling TF. Stages of embryonic development of the zebrafish. Dev Dyn. 1995;203:253–310. doi: 10.1002/aja.1002030302. [DOI] [PubMed] [Google Scholar]
- Kolb SJ, Battle DJ, Dreyfuss G. Molecular functions of the SMN complex. J Child Neurol. 2007;22:990–994. doi: 10.1177/0883073807305666. [DOI] [PubMed] [Google Scholar]
- Kübler E, Riezman H. Actin and fimbrin are required for the internalization step of endocytosis in yeast. EMBO J. 1993;12:2855–2862. doi: 10.1002/j.1460-2075.1993.tb05947.x. [DOI] [PMC free article] [PubMed] [Google Scholar]
- Kwiatkowski TJ, Jr, Bosco DA, Leclerc AL, Tamrazian E, Vanderburg CR, Russ C, Davis A, Gilchrist J, Kasarskis EJ, Munsat T, Valdmanis P, Rouleau GA, Hosler BA, Cortelli P, de Jong PJ, Yoshinaga Y, Haines JL, Pericak-Vance MA, Yan J, Ticozzi N, et al. Mutations in the FUS/TLS gene on chromosome 16 cause familial amyotrophic lateral sclerosis. Science. 2009;323:1205–1208. doi: 10.1126/science.1166066. [DOI] [PubMed] [Google Scholar]
- Lefebvre S, Bürglen L, Reboullet S, Clermont O, Burlet P, Viollet L, Benichou B, Cruaud C, Millasseau P, Zeviani M, et al. Identification and characterization of a spinal muscular atrophy-determining gene. Cell. 1995;80:155–165. doi: 10.1016/0092-8674(95)90460-3. [DOI] [PubMed] [Google Scholar]
- Lorson CL, Hahnen E, Androphy EJ, Wirth B. A single nucleotide in the SMN gene regulates splicing and is responsible for spinal muscular atrophy. Proc Natl Acad Sci U S A. 1999;96:6307–6311. doi: 10.1073/pnas.96.11.6307. [DOI] [PMC free article] [PubMed] [Google Scholar]
- McWhorter ML, Monani UR, Burghes AH, Beattie CE. Knockdown of the survival motor neuron (Smn) protein in zebrafish causes defects in motor axon outgrowth and pathfinding. J Cell Biol. 2003;162:919–931. doi: 10.1083/jcb.200303168. [DOI] [PMC free article] [PubMed] [Google Scholar]
- McWhorter ML, Boon KL, Horan ES, Burghes AH, Beattie CE. The SMN binding protein Gemin2 is not involved in motor axon outgrowth. Dev Neurobiol. 2008;68:182–194. doi: 10.1002/dneu.20582. [DOI] [PubMed] [Google Scholar]
- Meister G, Eggert C, Fischer U. SMN-mediated assembly of RNPs: a complex story. Trends Cell Biol. 2002;12:472–478. doi: 10.1016/s0962-8924(02)02371-1. [DOI] [PubMed] [Google Scholar]
- Monani UR, Lorson CL, Parsons DW, Prior TW, Androphy EJ, Burghes AH, McPherson JD. A single nucleotide difference that alters splicing patterns distinguishes the SMA gene SMN1 from the copy gene SMN2. Hum Mol Genet. 1999;8:1177–1183. doi: 10.1093/hmg/8.7.1177. [DOI] [PubMed] [Google Scholar]
- Mourelatos Z, Dostie J, Paushkin S, Sharma A, Charroux B, Abel L, Rappsilber J, Mann M, Dreyfuss G. miRNPs: a novel class of ribonucleoproteins containing numerous microRNAs. Genes Dev. 2002;16:720–728. doi: 10.1101/gad.974702. [DOI] [PMC free article] [PubMed] [Google Scholar]
- Nölle A, Zeug A, van Bergeijk J, Tönges L, Gerhard R, Brinkmann H, Al Rayes S, Hensel N, Schill Y, Apkhazava D, Jablonka S, O'mer J, Srivastav RK, Baasner A, Lingor P, Wirth B, Ponimaskin E, Niedenthal R, Grothe C, Claus P. The spinal muscular atrophy disease protein SMN is linked to the Rho-kinase pathway via profilin. Hum Mol Genet. 2011;20:4865–4878. doi: 10.1093/hmg/ddr425. [DOI] [PubMed] [Google Scholar]
- Oprea GE, Kröber S, McWhorter ML, Rossoll W, Müller S, Krawczak M, Bassell GJ, Beattie CE, Wirth B. Plastin 3 is a protective modifier of autosomal recessive spinal muscular atrophy. Science. 2008;320:524–527. doi: 10.1126/science.1155085. [DOI] [PMC free article] [PubMed] [Google Scholar]
- Park GH, Maeno-Hikichi Y, Awano T, Landmesser LT, Monani UR. Reduced survival of motor neuron (SMN) protein in motor neuronal progenitors functions cell autonomously to cause spinal muscular atrophy in model mice expressing the human centromeric (SMN2) gene. J Neurosci. 2010;30:12005–12019. doi: 10.1523/JNEUROSCI.2208-10.2010. [DOI] [PMC free article] [PubMed] [Google Scholar]
- Paushkin S, Gubitz AK, Massenet S, Dreyfuss G. The SMN complex, an assemblyosome of ribonucleoproteins. Curr Opin Cell Biol. 2002;14:305–312. doi: 10.1016/s0955-0674(02)00332-0. [DOI] [PubMed] [Google Scholar]
- Prior TW, Swoboda KJ, Scott HD, Hejmanowski AQ. Homozygous SMN1 deletions in unaffected family members and modification of the phenotype by SMN2. Am J Med Genet A. 2004;130A:307–310. doi: 10.1002/ajmg.a.30251. [DOI] [PMC free article] [PubMed] [Google Scholar]
- Prior TW, Krainer AR, Hua Y, Swoboda KJ, Snyder PC, Bridgeman SJ, Burghes AH, Kissel JT. A positive modifier of spinal muscular atrophy in the SMN2 gene. Am J Hum Genet. 2009;85:408–413. doi: 10.1016/j.ajhg.2009.08.002. [DOI] [PMC free article] [PubMed] [Google Scholar]
- Ralser M, Nonhoff U, Albrecht M, Lengauer T, Wanker EE, Lehrach H, Krobitsch S. Ataxin-2 and huntingtin interact with endophilin-A complexes to function in plastin-associated pathways. Hum Mol Genet. 2005;14:2893–2909. doi: 10.1093/hmg/ddi321. [DOI] [PubMed] [Google Scholar]
- Ramesh T, Lyon AN, Pineda RH, Wang C, Janssen PM, Canan BD, Burghes AH, Beattie CE. A genetic model of amyotrophic lateral sclerosis in zebrafish displays phenotypic hallmarks of motoneuron disease. Dis Model Mech. 2010;3:652–662. doi: 10.1242/dmm.005538. [DOI] [PMC free article] [PubMed] [Google Scholar]
- Rembold M, Lahiri K, Foulkes NS, Wittbrodt J. Transgenesis in fish: efficient selection of transgenic fish by co-injection with a fluorescent reporter construct. Nat Protoc. 2006;1:1133–1139. doi: 10.1038/nprot.2006.165. [DOI] [PubMed] [Google Scholar]
- Rochette CF, Gilbert N, Simard LR. SMN gene duplication and the emergence of the SMN2 gene occurred in distinct hominids: SMN2 is unique to Homo sapiens. Hum Genet. 2001;108:255–266. doi: 10.1007/s004390100473. [DOI] [PubMed] [Google Scholar]
- Rossoll W, Bassell GJ. Spinal muscular atrophy and a model for survival of motor neuron protein function in axonal ribonucleoprotein complexes. Results Probl Cell Differ. 2009;48:289–326. doi: 10.1007/400_2009_4. [DOI] [PMC free article] [PubMed] [Google Scholar]
- Rossoll W, Jablonka S, Andreassi C, Kröning AK, Karle K, Monani UR, Sendtner M. Smn, the spinal muscular atrophy-determining gene product, modulates axon growth and localization of beta-actin mRNA in growth cones of motoneurons. J Cell Biol. 2003;163:801–812. doi: 10.1083/jcb.200304128. [DOI] [PMC free article] [PubMed] [Google Scholar]
- Schrank B, Götz R, Gunnersen JM, Ure JM, Toyka KV, Smith AG, Sendtner M. Inactivation of the survival motor neuron gene, a candidate gene for human spinal muscular atrophy, leads to massive cell death in early mouse embryos. Proc Natl Acad Sci U S A. 1997;94:9920–9925. doi: 10.1073/pnas.94.18.9920. [DOI] [PMC free article] [PubMed] [Google Scholar]
- Sharma A, Lambrechts A, Hao le T, Le TT, Sewry CA, Ampe C, Burghes AH, Morris GE. A role for complexes of survival of motor neurons (SMN) protein with gemins and profilin in neurite-like cytoplasmic extensions of cultured nerve cells. Exp Cell Res. 2005;309:185–197. doi: 10.1016/j.yexcr.2005.05.014. [DOI] [PubMed] [Google Scholar]
- Shoji W, Sato-Maeda M. Application of heat shock promoter in transgenic zebrafish. Dev Growth Differ. 2008;50:401–406. doi: 10.1111/j.1440-169X.2008.01038.x. [DOI] [PubMed] [Google Scholar]
- Sonenberg N, Hinnebusch AG. Regulation of translation initiation in eukaryotes: mechanisms and biological targets. Cell. 2009;136:731–745. doi: 10.1016/j.cell.2009.01.042. [DOI] [PMC free article] [PubMed] [Google Scholar]
- Stratigopoulos G, Lanzano P, Deng L, Guo J, Kaufmann P, Darras B, Finkel R, Tawil R, McDermott MP, Martens W, Devivo DC, Chung WK. Association of plastin 3 expression with disease severity in spinal muscular atrophy only in postpubertal females. Arch Neurol. 2010;67:1252–1256. doi: 10.1001/archneurol.2010.239. [DOI] [PubMed] [Google Scholar]
- Thermes V, Grabher C, Ristoratore F, Bourrat F, Choulika A, Wittbrodt J, Joly JS. I-SceI meganuclease mediates highly efficient transgenesis in fish. Mech Dev. 2002;118:91–98. doi: 10.1016/s0925-4773(02)00218-6. [DOI] [PubMed] [Google Scholar]
- Trends in Genetics. Genetic nomenclature guide, Supplement. Cambridge, UK: Elsevier Scientific; 1998. pp. S1–S49. [Google Scholar]
- Wang J, Dreyfuss G. A cell system with targeted disruption of the SMN gene: functional conservation of the SMN protein and dependence of Gemin2 on SMN. J Biol Chem. 2001;276:9599–9605. doi: 10.1074/jbc.M009162200. [DOI] [PubMed] [Google Scholar]
- Westerfield M. The zebrafish book. Ed 3. Eugene, OR: University of Oregon; 1995. [Google Scholar]
- Wolman M, Granato M. Behavioral genetics in larval zebrafish-learning from the young. Dev Neurobiol. 2011;72:366–372. doi: 10.1002/dneu.20872. [DOI] [PMC free article] [PubMed] [Google Scholar]
- Yin X, Dewille JW, Hai T. A potential dichotomous role of ATF3, an adaptive-response gene, in cancer development. Oncogene. 2008;27:2118–2127. doi: 10.1038/sj.onc.1210861. [DOI] [PubMed] [Google Scholar]
- Young PJ, Man NT, Lorson CL, Le TT, Androphy EJ, Burghes AH, Morris GE. The exon 2b region of the spinal muscular atrophy protein, SMN, is involved in self-association and SIP1 binding. Hum Mol Genet. 2000;9:2869–2877. doi: 10.1093/hmg/9.19.2869. [DOI] [PubMed] [Google Scholar]
- Zhang H, Xing L, Singer RH, Bassell GJ. QNQKE targeting motif for the SMN-Gemin multiprotein complexin neurons. J Neurosci Res. 2007;85:2657–2667. doi: 10.1002/jnr.21308. [DOI] [PubMed] [Google Scholar]
- Zhang Z, Lotti F, Dittmar K, Younis I, Wan L, Kasim M, Dreyfuss G. SMN deficiency causes tissue-specific perturbations in the repertoire of snRNAs and widespread defects in splicing. Cell. 2008;133:585–600. doi: 10.1016/j.cell.2008.03.031. [DOI] [PMC free article] [PubMed] [Google Scholar]