

Abstract
NMDA receptors are ligand-gated ion channels that mediate excitatory neurotransmission in the brain and are involved in numerous neuropathological conditions. NMDA receptors are activated upon simultaneous binding of coagonists glycine and glutamate to the GluN1 and GluN2 subunits, respectively. Subunit-selective modulation of NMDA receptor function by ligand binding to modulatory sites distinct from the agonist binding sites could allow pharmacological intervention with therapeutically beneficial mechanisms. Here, we show the mechanism of action for 3-chloro-4-fluoro-N-[(4-[(2-(phenylcarbonyl)hydrazino)carbonyl]phenyl)methyl]-benzenesulfonamide (TCN-201), a new GluN1/GluN2A-selective NMDA receptor antagonist whose inhibition can be surmounted by glycine. Electrophysiological recordings from chimeric and mutant rat NMDA receptors suggest that TCN-201 binds to a novel allosteric site located at the dimer interface between the GluN1 and GluN2 agonist binding domains. Furthermore, we demonstrate that occupancy of this site by TCN-201 inhibits NMDA receptor function by reducing glycine potency. TCN-201 is therefore a negative allosteric modulator of glycine binding.
Introduction
Ionotropic glutamate receptors, which include NMDA, AMPA, and kainate receptors, are ligand-gated ion channels that mediate fast excitatory neurotransmission in the CNS (Traynelis et al., 2010). NMDA receptors are involved in a myriad of neurological processes, including neuronal development and experience-dependent plasticity, but are also implicated in numerous neuropathological conditions, such as stroke, traumatic brain injury, and Alzheimer's and Parkinson's diseases (Kalia et al., 2008; Traynelis et al., 2010). NMDA receptors are tetramers comprising two GluN1 and two GluN2 subunits (Ulbrich and Isacoff, 2007). The GluN1 subunit is an obligate part of all NMDA receptors and is widely expressed in the CNS. By contrast, the different GluN2 subunits (GluN2A-D) have distinct temporal and spatial expression in the brain (Watanabe et al., 1992; Ishii et al., 1993; Monyer et al., 1994). Furthermore, the different GluN2 subunits endow NMDA receptors with markedly different biophysical and pharmacological properties (Monyer et al., 1992; Vicini et al., 1998; Gielen et al., 2009; Yuan et al., 2009).
Since the discovery of ifenprodil as a noncompetitive NMDA receptor antagonist with >500-fold selectivity for GluN2B-containing NMDA receptors (Williams, 1993), there has been considerable focus on the development of subunit-selective antagonists for therapeutic gain (Kalia et al., 2008; Ogden and Traynelis, 2011). Ifenprodil and related GluN2B-selective antagonists have proven to be invaluable tools to dissect the contribution of specific NMDA receptor subtypes to neurophysiological processes (Mony et al., 2009; Hansen et al., 2010). Despite the utility of GluN2B-selective antagonists, there has been a lag in discovery of antagonists selective for other GluN2 subunits. However, several recent reports describe novel subunit-selective ligands for GluN2C- and GluN2D-containing receptors (Costa et al., 2010; Mosley et al., 2010; Mullasseril et al., 2010; Acker et al., 2011; Hansen and Traynelis, 2011). In addition, a new class of antagonists selective for GluN2A- over GluN2B-containing NMDA receptors was recently described (Bettini et al., 2010; McKay et al., 2011). Inhibition of GluN1/GluN2A receptors by a compound in this class, 3-chloro-4-fluoro-N-[(4-[(2-(phenylcarbonyl)hydrazino)carbonyl]phenyl)methyl]-benzenesulfonamide (hereafter referred to as TCN-201) (see Fig. 1A), was surmounted by glycine, but not glutamate, suggestive of competitive inhibition at the glycine binding site. However, it remains unclear how TCN-201 inhibition can discriminate between GluN2 subunits and yet, at the same time, be surmounted by agonist binding to the GluN1 subunit.
Figure 1.
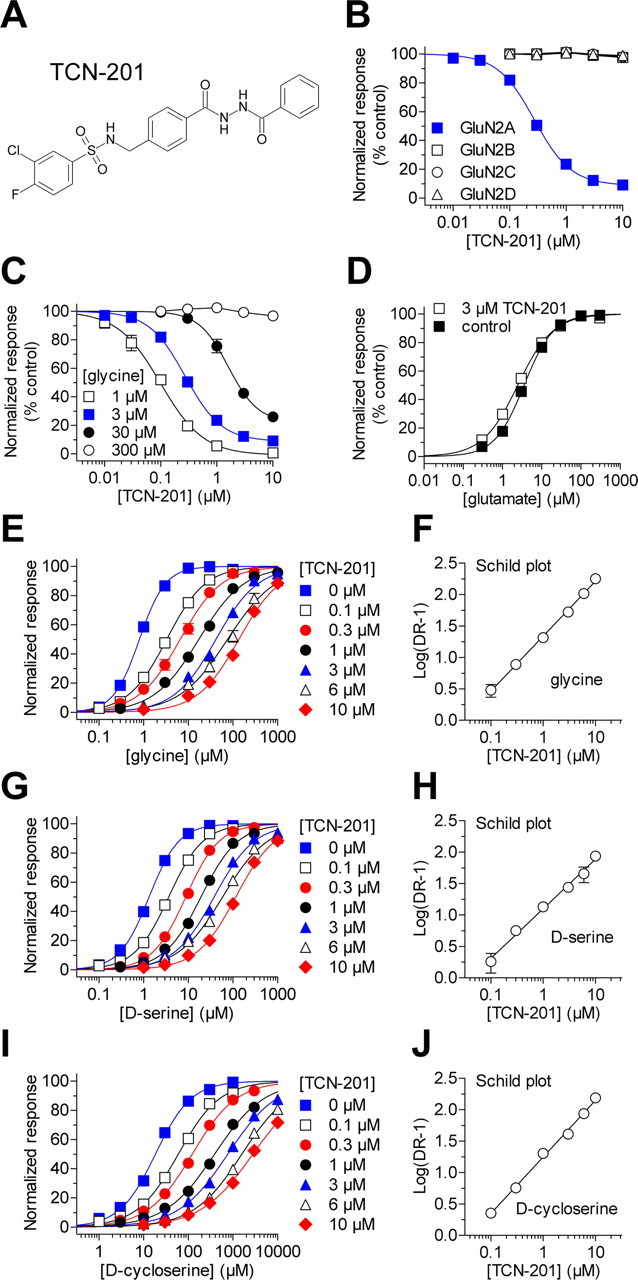
TCN-201 binding reduces potency of glycine at the GluN1 subunit. A, Chemical structure of 3-chloro-4-fluoro-N-[(4-[(2-(phenylcarbonyl)hydrazino)carbonyl]phenyl)methyl]-benzenesulfonamide (TCN-201) (Bettini et al., 2010). B, The effects of increasing concentrations of TCN-201 on responses to 100 μm glutamate plus 3 μm glycine from recombinant NMDA receptors expressed in Xenopus oocytes were measured using two-electrode voltage-clamp recordings. Data are from 4–25 oocytes. C, Concentration–response data for TCN-201 inhibition of GluN1/GluN2A activated by 100 μm glutamate plus different concentrations of glycine (1–300 μm). The data obtained in the presence of 300 μm glycine could not be fitted to the Hill equation. Data are from 5–25 oocytes. D, Glutamate concentration–response data for GluN1/GluN2A coactivated by 30 μm glycine in the absence (control) and presence of 3 μm TCN-201. Glutamate EC50 was 3.6 ± 0.2 μm (N = 8) in the absence of TCN-201 and 2.5 ± 0.1 μm (N = 7) in the presence of TCN-201. E, Glycine concentration–response data for GluN1/GluN2A coactivated by 100 μm glutamate in the absence (0 μm) and presence of increasing concentrations of TCN-201. Data are from five to seven oocytes. F, A Schild plot of the glycine concentration–response data produced a pA2 value of 7.53 corresponding to 30 nm and a Schild slope of 0.87 (95% confidence interval, 0.83–0.92). G, d-Serine concentration–response data for GluN1/GluN2A in 100 μm glutamate. Data are from six to eight oocytes. H, A Schild plot of the d-serine concentration–response data produced a pA2 value of 7.39 corresponding to 41 nm and a Schild slope of 0.79 (95% confidence interval, 0.69–0.89). I, d-Cycloserine concentration–response data for GluN1/GluN2A in 100 μm glutamate. Data are from five to seven oocytes for each condition. J, A Schild plot of the d-cycloserine concentration–response data produced a pA2 value of 7.39 corresponding to 41 nm and a Schild slope of 0.90 (95% confidence interval, 0.82–0.98).
To facilitate development of therapeutic agents, it is important to identify modulatory binding sites on the NMDA receptor. To this end, we investigated the mechanism of action for TCN-201 inhibition. We show that TCN-201 binding reduces potency of agonists at the GluN1 subunit and vice versa. We identify residues located at the dimer interface between the GluN1 and GluN2 agonist binding domains that control the subunit selectivity of TCN-201 inhibition. The results demonstrate that TCN-201 is a negative allosteric modulator of glycine binding and implicate the agonist binding domain interface between GluN1 and GluN2 as a putative binding site for allosteric modulators of NMDA receptors.
Materials and Methods
DNA constructs and ligands.
Rat cDNAs for GluN1-1a (GenBank IDs U11418 and U08261; hereafter GluN1), GluN1-1b (U08263), GluN2A (D13211), GluN2B (U11419), GluN2C (M91563), GluN2D (L31611), GluA1 (X17184), and GluK2 (Z11548) were provided by Drs. S. Heinemann (Salk Institute, La Jolla, CA), S. Nakanishi (Kyoto University, Kyoto, Japan), and P. Seeburg (University of Heidelberg, Heidelberg, Germany). Amino acid composition for GluN2A-GluN2D chimeras (listed as the residues included from GluN2A and GluN2D) is the following: 2A-ΔATD, 405–1464 (GluN2A); 2A-(2D ATD), 405–1464 (GluN2A) and 1–427 (GluN2D); 2A-(2D M1M2M3), 1–552 + 661–1464 (GluN2A) and 578–685 (GluN2D); 2A-(2D S1+S2), 1–403 + 539–660 + 98–1464 (GluN2A) and 427–563 + 686–822 (GluN2D); 2A-(2D S1), 1–403 + 539–1464 (GluN2A) and 427–563 (GluN2D); 2A-(2D S2), 1–660 + 798–1464 (GluN2A) and 686–822 (GluN2D); 2A-(2D D1), 1–403 + 539–765 + 798–1464 (GluN2A) and 427–563 + 791–822 (GluN2D); 2A-(2D D2), 1–660 + 756–1464 (GluN2A) and 686–780 (GluN2D); 2D-(2A S1), 405–538 (GluN2A) and 1–427 + 564–1464 (GluN2D); 2D-(2A S2), 661–797 (GluN2A) and 1–685 + 823–1464 (GluN2D). The GluN2A ATD deletion construct (2A-ΔATD) was generated from wild-type GluN2A and GluN2B-(ΔS28-M394) (Yuan et al., 2009). The amino acids are numbered according to the full-length protein, including the signal peptide. Site-directed mutagenesis was performed using the QuikChange method and verified by DNA sequencing. For expression in Xenopus oocytes, DNA constructs were linearized by restriction enzymes to produce template for cRNA synthesis in vitro (mMessage mMachine; Ambion). TCN-201 was purchased from Tocris Bioscience and Enamine; all other ligands were purchased from Sigma-Aldrich. The maximum solubility of TCN-201 in extracellular oocyte recording solution was determined to be 18 μm using a nephelometer (NEPHELOstar; BMG Labtech).
Two-electrode voltage-clamp recordings from Xenopus oocytes.
Injection of cRNA and maintenance of oocytes from female Xenopus laevis were performed as previously described (Traynelis et al., 1998). Two-electrode voltage-clamp recordings were performed 3–4 d after injection at room temperature (23°C). The extracellular recording solution contained the following (in mm): 90 NaCl, 1 KCl, 10 HEPES, 0.5 BaCl2, 0.01 EDTA, pH 7.4 with NaOH. Voltage and current electrodes were filled with 0.3 and 3.0 m KCl, respectively, and current responses were recorded at a holding potential of −40 mV. Voltage control was accomplished with a two-electrode voltage-clamp amplifier (OC725; Warner Instruments).
Whole-cell voltage-clamp electrophysiology.
HEK293 cells (CRL 1573; ATCC) were plated on poly-d-lysine-coated (0.1 mg/ml) glass coverslips ∼48 h before the experiments. The culture medium was DMEM with GlutaMax-I (Invitrogen) supplemented with 10% dialyzed fetal bovine serum, 10 U/ml penicillin, and 10 μg/ml streptomycin. Cells were transiently cotransfected using the calcium phosphate precipitation method with plasmid cDNAs encoding GluN1 and GluN2 subunits as well as GFP in a 1:1:1 ratio. Immediately following transfection, 200 μm d,l-2-amino-5-phosphonovalerate and 200 μm 7-chlorokynurenic acid were added to the culture medium. The cells were used for experiments ∼24 h following transfection.
Whole-cell voltage-clamp recordings were performed at −60 mV using an Axopatch 200B amplifier (Molecular Devices) at room temperature (23°C). Recording electrodes (3–4 ΜΩ) were made from thin-wall glass micropipettes (TW150F-4; World Precision Instruments) pulled using a horizontal puller (P-1000; Sutter Instrument). The electrodes were filled with internal solution containing the following (in mm): 110 d-gluconic acid, 110 CsOH, 30 CsCl, 5 HEPES, 4 NaCl, 0.5 CaCl2, 2 MgCl2, 5 BAPTA, 2 NaATP, and 0.3 NaGTP, pH 7.35 with CsOH. The extracellular recording solution was composed of the following (in mm): 150 NaCl, 10 HEPES, 3 KCl, 0.5 CaCl2, 0.01 EDTA, pH 7.4 with NaOH. Rapid solution exchange was achieved on lifted cells with a two-barrel theta-glass pipette controlled by a piezoelectric translator (Burleigh Instruments). Whole-cell 10–90% solution exchange times were ∼4 ms (Vance et al., 2011), and 10–90% open-tip solution exchange times were 0.4–0.8 ms.
Data analysis.
Concentration–response data were analyzed using GraphPad Prism (GraphPad Software). Data for individual oocytes were fitted to the Hill equation. For graphical presentation, data points from individual oocytes were normalized to the maximum current response in the same recording and averaged. The averaged data points (i.e., composite data) were then fit to the Hill equation and plotted together with the resulting curve.
TCN-201 inhibition was evaluated using Schild plots (Arunlakshana and Schild, 1959). The agonist EC50 was determined in the absence of TCN-201 and EC50′ determined in the presence of increasing concentrations of TCN-201. The dose ratio (DR = EC50′/EC50) for each concentration of TCN-201 was then calculated and log (DR − 1) was plotted versus log (TCN-201 concentration). This plot was fit with a straight line with variable slope. The slope of the Schild plot (i.e., Schild slope) is predicted to be 1 for a competitive antagonist at equilibrium according to the Schild equation: log (DR − 1) = pA2 + log [B], where [B] is the TCN-201 concentration and pA2 is the negative logarithm of the TCN-201 concentration that produces a twofold shift of the agonist EC50.
The allosteric constant α and Kb for TCN-201 inhibition were determined using a global nonlinear least-squares fitting method. All the agonist concentration–response data obtained at different TCN-201 concentrations were simultaneously fit to the following equations (Christopoulos and Kenakin, 2002):
 |
where [A] is the agonist concentration, [B] is the TCN-201 concentration, EC50 is for the agonist alone in the absence of TCN-201, EC50′ values are for agonist in the presence of different concentrations of TCN-201, nH is the Hill slope, α is the allosteric constant, and Kb is the dissociation constant for TCN-201. This method will fit the data using EC50 in the absence of TCN-201, the allosteric constant α, and Kb as global parameters, whereas the Hill slopes and EC50′ values are different for each concentration–response curve.
Current responses from whole-cell voltage-clamp recordings using HEK293 cells were analyzed using ChanneLab (Synaptosoft). The deactivation time courses of the current responses were fit by two exponential components using the following equation:
where τfast and τslow are the deactivation time constants for the fast and slow components, respectively. The weighted deactivation time constant was calculated using the following equation:
Unpaired t test (two-tailed) or ANOVA (one-way ANOVA with Tukey–Kramer posttest) was used for statistical comparisons as indicated (p < 0.05 was considered significant). For Schild slopes, the 95% confidence intervals are calculated using the number of data points and the SE for the best fit value. All data are presented as mean ± SEM.
Results
Binding of TCN-201 reduces potency of glycine at the GluN1 subunit
To assess the selectivity profile of TCN-201 across the different NMDA receptor subtypes, we determined the concentration–effect relationship for TCN-201 at recombinant GluN1/GluN2A, GluN1/GluN2B, GluN1/GluN2C, or GluN1/GluN2D receptors expressed in Xenopus oocytes using two-electrode voltage-clamp recordings. TCN-201 completely inhibited responses from GluN1/GluN2A receptors activated by 100 μm glutamate plus 3 μm glycine with an IC50 value of 320 nm (Fig. 1B, Table 1). In contrast to its effects on GluN2A-containing receptors, TCN-201 did not inhibit responses from GluN2B-, GluN2C-, or GluN2D-containing NMDA receptors (Fig. 1B, Table 1). Moreover, TCN-201 inhibition was not affected by the presence of exon 5 in GluN1, which encodes 21 amino acids in the amino-terminal domain. GluN1–1a/GluN2A receptors, which lack exon 5, were inhibited to 45 ± 3% of control (N = 7), and GluN1–1b/GluN2A receptors, which contain exon 5, were inhibited to 49 ± 2% of control (N = 6) by 3 μm TCN-201 in the presence of 30 μm glycine. In addition, 10 μm TCN-201 did not affect responses activated by 100 μm glutamate from GluA1 AMPA receptors (N = 8) or GluK2 kainate receptors (N = 10) (data not shown). Thus, TCN-201 displays strong selectivity, estimated to be >1000-fold, for GluN2A-containing NMDA receptors at a glycine concentration of 3 μm.
Table 1.
TCN-201 and glycine potencies for wild-type and mutant NMDA receptor subtypes
| NMDA receptor subtype (GluN1/GluN2X) | TCN-201 activity |
Glycine activity |
|||||||
|---|---|---|---|---|---|---|---|---|---|
| [glycine] (μm) | IC50 (μm) | nH | Maximum % inhibition | N | [TCN-201] (μm) | EC50 (μm) | nH | N | |
| GluN2A | 1 | 0.10 ± 0.01 | 1.2 | 100 ± 1 | 5 | 0 | 1.1 ± 0.1 | 1.4 | 7 |
| GluN2A | 3 | 0.32 ± 0.04 | 1.5 | 81 ± 1 | 25 | 10 | 150 ± 10 | 0.9 | 6 |
| GluN2A | 30 | 1.6 ± 0.2 | 2.2 | 73 ± 2 | 12 | ||||
| GluN2A | 300 | NE | 6 | ||||||
| 2A-(2D S1) | 3 | 0.23 ± 0.02 | 1.5 | 97 ± 1 | 8 | ND | |||
| 2A-(2D S2) | 3 | NE | ND | ||||||
| GluN2B | 3 | NE | 5 | 0 | 0.3 ± 0.1 | 1.2 | 6 | ||
| GluN2B | 10 | 0.6 ± 0.2 | 1.1 | 4 | |||||
| GluN2B F784V | 3 | 6.8 ± 0.4 | 1.2 | ND | 6 | 0 | 0.8 ± 0.4 | 1.2 | 4 |
| GluN2B F784V | 10 | 5.5 ± 0.5 | 1.5 | 4 | |||||
| GluN2B L783F + F784V | 3 | 4.4 ± 0.2 | 1.3 | ND | 5 | 0 | 0.6 ± 0.1 | 1.2 | 5 |
| GluN2B L783F + F784V | 10 | 9.5 ± 0.5 | 1.5 | 6 | |||||
| GluN2C | 3 | NE | 4 | ND | |||||
| GluN2D | 3 | NE | 4 | ND | |||||
| GluN2D L808V | 3 | 72% of control at 10 μm TCN-201 | 5 | ND | |||||
| 2D-(2A S1) | 3 | NE | ND | ||||||
| 2D-(2A S2) | 3 | 1.6 ± 0.1 | 2.1 | 91 ± 4 | 6 | ND | |||
| GluN2A V783L | 3 | 70% of control at 10 μm TCN-201 | 5 | 0 | 0.6 ± 0.1 | 1.4 | 3 | ||
| GluN2A V783L | 10 | 3.7 ± 0.3 | 1.3 | 4 | |||||
| GluN2A G786D | 3 | 1.4 ± 0.1 | 1.7 | 82 ± 3 | 5 | 0 | 0.4 ± 0.01 | 1.5 | 3 |
| GluN2A G786D | 10 | 22 ± 2 | 1.1 | 4 | |||||
| GluN2A E790M | 3 | 0.60 ± 0.04 | 1.4 | 90 ± 3 | 6 | 0 | 1.0 ± 0.01 | 1.4 | 6 |
| GluN2A M788I | 3 | 1.0 ± 0.1 | 1.3 | 79 ± 3 | 5 | 0 | 0.8 ± 0.1 | 1.5 | 4 |
| GluN2A T793R | 3 | 0.32 ± 0.03 | 2.2 | 94 ± 2 | 6 | 0 | 2.4 ± 0.4 | 1.5 | 6 |
| GluN2A V783A | 3 | 0.23 ± 0.02 | 1.1 | 91 ± 2 | 5 | 0 | 2.4 ± 0.1 | 1.0 | 4 |
| GluN2A V783F | 3 | 1.9 ± 0.1 | 1.8 | 80 ± 2 | 4 | 0 | 0.5 ± 0.1 | 1.3 | 5 |
| GluN2A V783W | 3 | 0.036 ± 0.003 | 1.0 | 95 ± 2 | 4 | 0 | 4.6 ± 0.2 | 1.4 | 4 |
| GluN2A V783S | 3 | 0.66 ± 0.06 | 1.4 | 89 ± 3 | 4 | 0 | 1.4 ± 0.1 | 1.3 | 4 |
| GluN2A V783T | 3 | 0.81 ± 0.06 | 1.5 | 91 ± 1 | 4 | 0 | 1.5 ± 0.1 | 1.2 | 4 |
| GluN2A V783H | 3 | 0.060 ± 0.010 | 0.9 | 93 ± 4 | 4 | 0 | 3.8 ± 0.2 | 1.4 | 4 |
| GluN2A V783D | 3 | 0.27 ± 0.01 | 1.2 | 92 ± 2 | 4 | 0 | 6.3 ± 0.7 | 1.3 | 4 |
| GluN2A P527A | 3 | 0.48 ± 0.06 | 1.4 | 91 ± 3 | 4 | 0 | 1.5 ± 0.1 | 1.2 | 6 |
| GluN2A L777A | 3 | 0.072 ± 0.017 | 1.2 | 98 ± 1 | 4 | 0 | 2.0 ± 0.1 | 1.3 | 6 |
| GluN2A L779A | 3 | 0.52 ± 0.07 | 1.3 | 88 ± 5 | 4 | 0 | 1.1 ± 0.1 | 1.3 | 6 |
| GluN2A L780A | 3 | 67% of control at 10 μm TCN-201 | 6 | 0 | 1.3 ± 0.1 | 1.1 | 6 | ||
| GluN2A Q781A | 3 | 0.78 ± 0.03 | 1.9 | 94 ± 2 | 4 | 0 | 0.6 ± 0.07 | 1.1 | 6 |
| GluN2A G786A | 3 | 1.1 ± 0.1 | 1.8 | 87 ± 3 | 5 | 0 | 0.4 ± 0.03 | 1.0 | 6 |
| GluN2A M788A | 3 | 0.62 ± 0.02 | 1.4 | 90 ± 3 | 4 | 0 | 1.1 ± 0.1 | 1.3 | 6 |
| GluN2A E789A | 3 | 0.15 ± 0.01 | 1.4 | 96 ± 1 | 4 | 0 | 4.6 ± 0.4 | 1.3 | 6 |
| GluN1 I519A | 3 | 1.1 ± 0.1 | 1.9 | 80 ± 2 | 8 | 0 | 1.5 ± 0.1 | 1.3 | 4 |
| GluN1 F754A | 3 | 0.048 ± 0.002 | 1.4 | 98 ± 1 | 4 | 0 | 2.3 ± 0.1 | 1.6 | 4 |
| GluN1 R755A | 3 | 79% of control at 10 μm TCN-201 | 4 | 0 | 4.4 ± 0.2 | 1.1 | 4 | ||
TCN-201 IC50 (±SEM) and glycine EC50 (±SEM) were determined using two-electrode voltage-clamp recordings at wild-type and mutant GluN2 subunits coexpressed with GluN1 in Xenopus oocytes (GluN1/GluN2X). The receptors were activated by 100 μm glutamate plus the indicated concentration of glycine in the presence of the indicated concentration of TCN-201. Maximal inhibition (±SEM) was calculated as control response in the absence of TCN-201 minus residual current at saturating concentrations of TCN-201 relative to control response. GluN1 mutants were coexpressed with GluN2A. NE indicates no effect at 10 μm TCN-201. ND indicates not determined. N is the number of oocytes used to generate the data, and nH is the Hill slope.
Because TCN-201 inhibition was surmounted by high glycine concentrations (Bettini et al., 2010), we evaluated the extent to which glycine shifts TCN-201 potency at GluN1/GluN2A by generating TCN-201 concentration–inhibition data at different concentrations of glycine (Fig. 1C, Table 1). In agreement with previously published observations (Bettini et al., 2010), TCN-201 potency was reduced by increasing concentrations of glycine. For example, the IC50 of TCN-201 was increased 16-fold from 100 nm in the presence of 1 μm glycine to 1.6 μm in the presence of 30 μm glycine. There was no detectable inhibition of GluN1/GluN2A by 10 μm TCN-201 in the presence of 300 μm glycine. In a reciprocal manner, the potency of glycine at GluN1/GluN2A was reduced in the presence of increasing TCN-201 concentrations with no effects on the maximal response (Fig. 1E, Table 1). The EC50 of glycine increased 100-fold from 1.5 μm in the absence of TCN-201 to 150 μm in the presence of 10 μm TCN-201 (Table 1). By contrast, the EC50 of glutamate at GluN1/GluN2A was only slightly reduced from 3.6 ± 0.2 μm (N = 8) in the absence of TCN-201 to 2.5 ± 0.1 μm (N = 7) in the presence of 3 μm TCN-201 (Fig. 1D). One potential interpretation of these results could be that TCN-201 is a competitive antagonist at the glycine binding site of the GluN1 subunit. However, a competitive mechanism at the GluN1 subunit would be unexpected, since TCN-201 displays a remarkable selectivity for GluN1/GluN2A over other NMDA receptor subtypes that contain different GluN2 subunits.
TCN-201 is not a competitive antagonist at the GluN1 subunit
Schild analysis is a valuable approach to determine pA2, an empirical measure of potency defined as the negative logarithm of the antagonist concentration that produces a twofold shift of the agonist concentration–response curves (i.e., agonist EC50) (Arunlakshana and Schild, 1959; Wyllie and Chen, 2007). For competitive antagonists, pA2 can be considered a measure of the equilibrium constant for binding (i.e., pA2 = −logKb), and a linear fit of the Schild plot should have unitary slope (see Materials and Methods) (Arunlakshana and Schild, 1959). However, a slope that is significantly different from 1 suggests a noncompetitive mechanism of action, such as negative allosteric modulation of agonist binding.
We generated a Schild plot to evaluate the actions of TCN-201. Using the glycine EC50 at increasing concentrations of TCN-201, we calculated a dose ratio (DR) for each antagonist concentration (see Materials and Methods). The linear fit to the data in the resulting Schild plot produced a pA2 value of 7.53 corresponding to 30 nm and a Schild slope of 0.87, which is significantly different from 1 (95% confidence interval, 0.83–0.92) (Fig. 1F). Since the Schild slope is less than unity, the pA2 value is only an estimate of −logKb for TCN-201. We also evaluated the effects of TCN-201 on the potency of two other GluN1 agonists, d-serine and d-cycloserine (Fig. 1G–J). For both d-serine and d-cycloserine, Schild plots of the TCN-201 antagonism gave pA2 values of 7.39 corresponding to 41 nm, similar to the pA2 value for TCN-201 shift of glycine potency. For d-serine, the Schild slope was 0.79 (95% confidence interval, 0.69–0.89), and for d-cycloserine, the slope was 0.90 (95% confidence interval, 0.82–0.98); in both cases, the slope was significantly different from 1. Thus, Schild plots produced slopes significantly lower than 1 for all three GluN1 agonists, suggesting that the mechanism of TCN-201 inhibition is not direct competitive antagonism between TCN-201 and GluN1 agonist at the orthosteric agonist binding site. One possible mechanism of action that can explain the observed results could be that TCN-201 is a negative allosteric modulator of agonist binding to the GluN1 subunit.
Inhibition by TCN-201 is controlled by the agonist binding domain interface
To evaluate the structural determinants of TCN-201 inhibition, we used a chimeric strategy exploiting the selectivity between GluN2A and GluN2D subunits. We first replaced the GluN2A amino-terminal domain, agonist binding domain, and transmembrane domain with homologous regions of the GluN2D subunit and evaluated inhibition by 3 μm TCN-201 of the chimeric receptors activated by 100 μm glutamate plus 30 μm glycine (Fig. 2A,B). Replacing the GluN2A amino-terminal domain or transmembrane region with those of GluN2D did not reduce inhibition by TCN-201. Similarly, deleting the entire amino-terminal domain of GluN2A also did not reduce inhibition by TCN-201. By contrast, TCN-201 inhibition was abolished when the entire agonist binding domain of GluN2A was replaced with that of GluN2D. We further divided the agonist binding domain into segments S1 and S2 (Hansen and Traynelis, 2011). Replacing S1 of GluN2A with that of GluN2D did not affect TCN-201 sensitivity, whereas no inhibition was observed upon replacement of S2 (Fig. 2C, Table 1). Consistent with this result, replacing S2 in GluN2D with that of GluN2A resulted in TCN-201 inhibition with an IC50 of 1.6 ± 0.1 μm (N = 6), whereas replacing S1 of GluN2D with that of GluN2A did not introduce TCN-201 sensitivity (Fig. 2D, Table 1).
Figure 2.
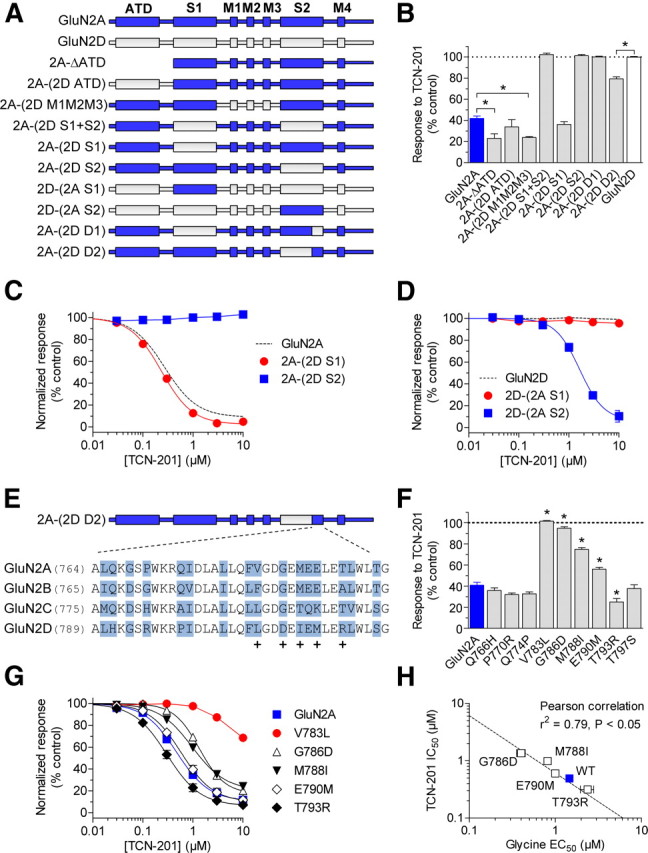
Structural determinants for TCN-201 activity are located in the S2 segment of the agonist binding domain. A, Linear representations of the polypeptide chains of GluN2A (blue) and GluN2D (gray), as well as chimeric GluN2A-GluN2D subunits (see Materials and Methods for chimeric junctions) show the amino-terminal domain (ATD), S1 and S2 segments of the agonist binding domain, transmembrane helices (M1, M3, and M4), and the reentrant pore loop (M2). B, Bar graph summarizing inhibition by 3 μm TCN-201 of responses to 100 μm glutamate plus 30 μm glycine for wild-type and chimeric GluN2 subunits coexpressed with GluN1. Data are from four to nine oocytes. The asterisk (*) indicates significantly different from GluN1/GluN2A (blue bar) or GluN1/GluN2D (white bar) (p < 0.05; one-way ANOVA with Tukey–Kramer posttest). TCN-201 concentration–response data for inhibition of responses to 100 μm glutamate plus 3 μm glycine were generated for 2A-(2D S1) and 2A-(2D S2) chimeras (C), as well as for 2D-(2A S1) and 2D-(2A S2) chimeras (D) coexpressed with GluN1 in Xenopus oocytes. The dashed lines are data for wild-type NMDA receptors as shown in Figure 1B. Data are from 4–25 oocytes. E, Amino acid sequence alignment of the last residues of the S2 segment from GluN2A-D, which contains the structural determinants for TCN-201 inhibition. The plus sign (+) below the sequences indicates that TCN-201 sensitivity was significantly changed when the residue in GluN2A was mutated. F, Inhibition by 3 μm TCN-201 of responses to 100 μm glutamate plus 30 μm glycine from wild-type and mutant GluN2A subunits coexpressed with GluN1. Data are from four to seven oocytes. The asterisk (*) indicates significantly different from GluN1/GluN2A (blue bar) (p < 0.05; one-way ANOVA with Tukey–Kramer posttest). G, Concentration–response data for TCN-201 inhibition of NMDA receptors activated by 100 μm glutamate plus 3 μm glycine. Data are from 5–10 oocytes. H, TCN-201 IC50 values plotted versus glycine EC50 values for mutant GluN2A subunits. Data for GluN2A V783L are excluded from this analysis, since the TCN-201 IC50 could not be determined for this mutant. There is a significant correlation between glycine EC50 values and TCN-201 IC50 values for the depicted GluN2A mutants (Pearson's test for correlation, r2 = 0.79, p < 0.05). See Table 1 for IC50 values and EC50 values. Error bars indicate SEM.
We subsequently divided the agonist binding domain into the upper D1 lobe of the clamshell-like structure and the lower D2 lobe (Furukawa et al., 2005). Replacing the D1 lobe of GluN2A with that of GluN2D eliminated TCN-201 inhibition, but some TCN-201 activity was retained upon replacement of the D2 lobe (Fig. 2B). In these chimeric GluN2 subunits, replacement of the D1 lobe is equivalent to the combined replacement of the entire segment S1, which has no effect on TCN-201 inhibition, as well as a smaller portion of segment S2 (Fig. 2A). The molecular determinants of TCN-201 action could therefore be located in this smaller portion of S2, since these residues are sufficient to eliminate TCN-201 activity.
The portion of S2 that comprises the determinants of TCN-201 action differs by only 9 aa between GluN2A and GluN2D (Fig. 2E). We individually mutated these nine residues in GluN2A to the corresponding residues in GluN2D and found that five of these mutations (GluN2A V783L, G786D, M788I, E790M, and T793R) significantly affected the inhibition by 3 μm TCN-201 (Fig. 2F). TCN-201 concentration–inhibition data of responses activated by 100 μm glutamate plus 3 μm glycine confirmed effects of these five mutations on TCN-201 potency (Fig. 2G, Table 1). The most prominent reduction in TCN-201 potency was observed for GluN2A V783L, which was only inhibited to 70% of control by 10 μm TCN-201. To evaluate potential interactions between glycine binding and TCN-201 activity on NMDA receptors containing mutant GluN2A subunits, we determined glycine EC50 values in the absence of TCN-201. Interestingly, all of the GluN2A mutations identified by the chimeric approach affected glycine potency (Table 1). There was significant correlation between glycine EC50 values and TCN-201 IC50 values for four of the GluN2A mutants (Fig. 2H). Since it was not possible to reliably determine TCN-201 IC50 for GluN2A V783L given the limits of TCN-201 solubility (see Materials and Methods), data for this mutant were not included in the test for correlation. Glycine EC50 for NMDA receptors containing GluN2A V783L was 0.6 μm, which is 1.8-fold lower than the EC50 of 1.1 μm for wild-type GluN1/GluN2A (Table 1). Because inhibition of GluN2A V783L could not be accounted for by a shift in glycine potency, we speculate that GluN2A Val783 could be directly involved in TCN-201 binding. By contrast, the effects of the other GluN2A mutations on TCN-201 activity are primarily mediated through changes in glycine potency.
Residue Val783 in GluN2A influences binding of TCN-201
To evaluate the idea that the GluN2A V783L mutation directly affects binding of TCN-201, we used Schild plots to estimate a pA2 value for TCN-201 potency. According to the correlation shown in Figure 2H, only a minor change in TCN-201 binding affinity would be expected for GluN2A G786D, since the reduction of TCN-201 potency is primarily caused by an increase in glycine potency for this mutation. The Schild plot of TCN-201 antagonism on GluN2A G786D produced a pA2 value of 7.40 corresponding to 40 nm (Fig. 3A,B), which is close to the 30 nm derived from the pA2 value for wild-type GluN1/GluN2A. By contrast, the Schild plot for GluN2A V783L produced a pA2 value of 5.67 corresponding to 2.1 μm, which is 70-fold higher compared with wild-type GluN1/GluN2A (Fig. 3C,D). These results are consistent with the idea that residue Val783 of GluN2A participates in TCN-201 binding.
Figure 3.
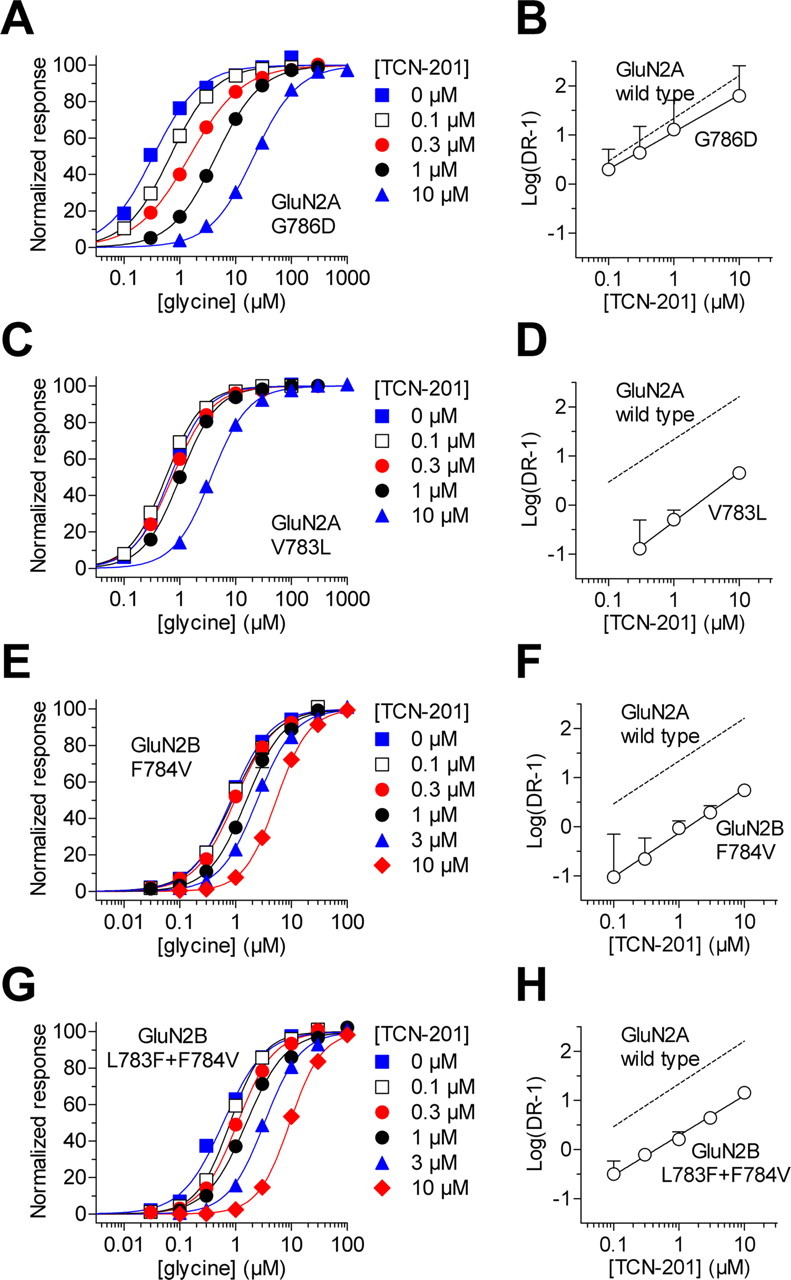
Residue Val783 of GluN2A controls TCN-201 binding. Glycine concentration–response data for GluN1/GluN2A G786D (A), GluN1/GluN2A V783L (C), GluN1/GluN2B F784V (E), and GluN1/GluN2B L783F+F784V (G) in the absence (0 μm) and presence of increasing concentrations of TCN-201. Data are from four to six oocytes. Schild plots for GluN1/GluN2A G786D (B), GluN1/GluN2A V783L (D), GluN1/GluN2B F784V (F), and GluN1/GluN2B L783F+F784V (H) yield pA2 values of 7.40, 5.67, 5.86, and 6.36 corresponding to 40 nm, 2.1 μm, 1.4 μm, and 440 nm, respectively. For all experiments, responses were activated by increasing concentrations of glycine plus 100 μm glutamate. See Table for EC50 values.
If the residue in GluN2 subunits at the same position as GluN2A Val783 is an important determinant of TCN-201 binding, we predict that TCN-201 will gain some activity on GluN2B with the mutation F784V, as Phe784 in GluN2B corresponds to GluN2A Val783 (Fig. 2E). Indeed, TCN-201 had a pronounced effect on glycine potency of mutant GluN1/GluN2B F784V receptors and the Schild plot gave a pA2 value of 5.86 corresponding to 1.4 μm (Fig. 3E,F). By contrast, glycine potency at wild-type GluN1/GluN2B was only marginally reduced in the presence of 10 μm TCN-201, preventing determination of pA2 from the Schild plot (Table 1). The residue immediately before GluN2A Val783 is also not conserved between GluN2A and GluN2B (Fig. 2E). The double mutant GluN2B L783F+F784V, in which both of these residues are converted to the corresponding residues in GluN2A, exhibited even greater antagonism by TCN-201. The Schild plot produced a pA2 value of 6.36 corresponding to 440 nm (Fig. 3G,H). Glycine EC50 values for mutant GluN1/GluN2B L783F+F784V in the absence of TCN-201 and in the presence 10 μm TCN-201 were 0.6 ± 0.1 μm (N = 5) and 9.5 ± 0.5 μm (N = 6), respectively (Table 1). TCN-201 concentration–response data for GluN1/GluN2B F784V and GluN1/GluN2B L783F+F784V in the presence of 3 μm glycine produced IC50 values of 6.8 ± 0.4 μm (N = 6) and 4.4 ± 0.2 μm (N = 5), respectively (Table 1). In addition, TCN-201 sensitivity could also be introduced to GluN2D by a single point mutation (GluN2D L808V) at the residue corresponding to Val783 in GluN2A (72% of control at 10 μm TCN-201; Table 1).
To further evaluate the role of residue Val783 in TCN-201 binding to GluN2A, we mutated this position to residues with charged, polar, and nonpolar side chains and determined TCN-201 IC50 and glycine EC50 values (Table 1). GluN2A V783A resulted in a 2.2-fold increase in glycine EC50 and a 1.4-fold reduction in TCN-201 IC50 compared with wild-type GluN2A. By contrast, GluN2A V783F resulted in a 2.2-fold reduction in glycine EC50 and a 5.9-fold increase in TCN-201 IC50. Comparison of TCN-201 activities at GluN2A V783A and GluN2A V783F with the marked decrease in TCN-201 IC50 for GluN2A V783L (Table 1) suggests that the effect of mutating residue V783 to leucine is not solely due to steric occlusion of TCN-201 binding. Additional substitutions yielded no significant correlation between glycine EC50 values and TCN-201 IC50 values for the GluN2A V783 mutants (Pearson's test for correlation, r2 = 0.40, p > 0.05; GluN2A V783L not included in the test) and did not show a clear relationship between the size or hydrophobicity of the side chain and TCN-201 potency (Table 1). This result suggests the Val783 substitutions likely have multiple effects on receptor structure in addition to potentially changing the nature of the hypothetical binding pocket. Nonetheless, Schild analysis of GluN1/GluN2A V783L inhibition by TCN-201 demonstrated that the V783L mutation directly impacts TCN-201 binding (Fig. 3).
TCN-201 inhibition is mediated by residues from both GluN1 and GluN2A
To identify additional residues that mediate TCN-201 inhibition, we mutated residues in both GluN1 and GluN2A that are located within 8 Å of residue Val783 in GluN2A and have side chains protruding into the dimer interface according to the crystal structure of the isolated agonist binding domains from GluN1/GluN2A (Furukawa et al., 2005) (Fig. 4A). In GluN1, seven residues were mutated and three of these mutations affected inhibition by 3 μm TCN-201 of responses to 100 μm glutamate plus 30 μm glycine (Fig. 4B). In GluN2A, 15 residues were mutated to alanine and 8 of these mutations affected TCN-201 inhibition (Fig. 4C). To assess whether changes in TCN-201 sensitivity could be influenced by changes in glycine potency, we also determined TCN-201 IC50 and glycine EC50 values for the mutants (Table 1). There was no significant correlation between glycine EC50 values and TCN-201 IC50 values for the GluN2A or the GluN1 mutants (Pearson's test for correlation, p > 0.05; GluN2A L780A and GluN1 R755A not included in the test). Interestingly, the GluN2A L777A and GluN2A L780A mutations markedly affected TCN-201 potency without any noticeable change in glycine potency (Fig. 4D, Table 1), suggesting that these residues are involved in TCN-201 binding. Residues Leu777 and Leu780 in GluN2A are located two and one helical turns away from residue Val783 (Fig. 5), and a previous study has implicated Leu780 in the arrangement of the agonist binding domain dimer interface, as well as in inhibition by proton and zinc (Gielen et al., 2008). In GluN1, the F754A mutation resulted in a 6.7-fold reduction in TCN-201 IC50 and a 2.1-fold increase in glycine EC50 compared with wild-type GluN1/GluN2A, whereas the R755A mutation almost completely abolished TCN-201 inhibition (79% of control at 10 μm TCN-201; Fig. 4D, Table 1). The GluN1 R755A mutation increased both glycine EC50 (4.0-fold) and TCN-201 IC50 (>30-fold), suggesting a role for this residue in TCN-201 binding. Residues Phe754 and Arg755 in GluN1 are located directly opposite from Val783 in GluN2A in the dimer interface (Fig. 5). In summary, the expanded mutagenesis identified several residues in both GluN1 and GluN2A that affect inhibition by TCN-201.
Figure 4.

TCN-201 inhibition is mediated by residues from both GluN1 and GluN2A. A, Residues that are located within 8 Å of residue V783 in GluN2A and have side chains protruding into the dimer interface are highlighted as blue spheres in the structure of the isolated agonist binding domains from GluN1/GluN2A with bound glutamate and glycine (PDB ID 2A5T) (Furukawa et al., 2005). GluN2A is shown in yellow, and GluN1 is shown in orange. The highlighted residues were mutated to alanine to identify additional residues implicated in TCN-201 inhibition. Inhibition by 3 μm TCN-201 of responses to 100 μm glutamate plus 30 μm glycine from mutant GluN1 subunits coexpressed with GluN2A (B) or mutant GluN2A subunits coexpressed with GluN1 (C). Data are from 4–12 oocytes. The asterisk (*) indicates significantly different from wild-type GluN1/GluN2A (blue bar) (p < 0.05; one-way ANOVA with Tukey–Kramer posttest). nr indicates that responses to 100 μm glutamate plus 30 μm glycine were not detected (N = 10–12), suggesting that these mutations have pronounced effects on subunit biosynthesis or receptor function. D, TCN-201 concentration–response data are shown for GluN1 and GluN2A mutants with marked changes in TCN-201 inhibition. Responses to 100 μm glutamate plus 3 μm glycine were measured from receptors expressed in Xenopus oocytes using two-electrode voltage-clamp recordings. The dashed line is data for wild-type GluN1/GluN2A as shown in Figure 1B. Data are from 4–25 oocytes. See Table 1 for IC50 values. Error bars indicate SEM.
Figure 5.
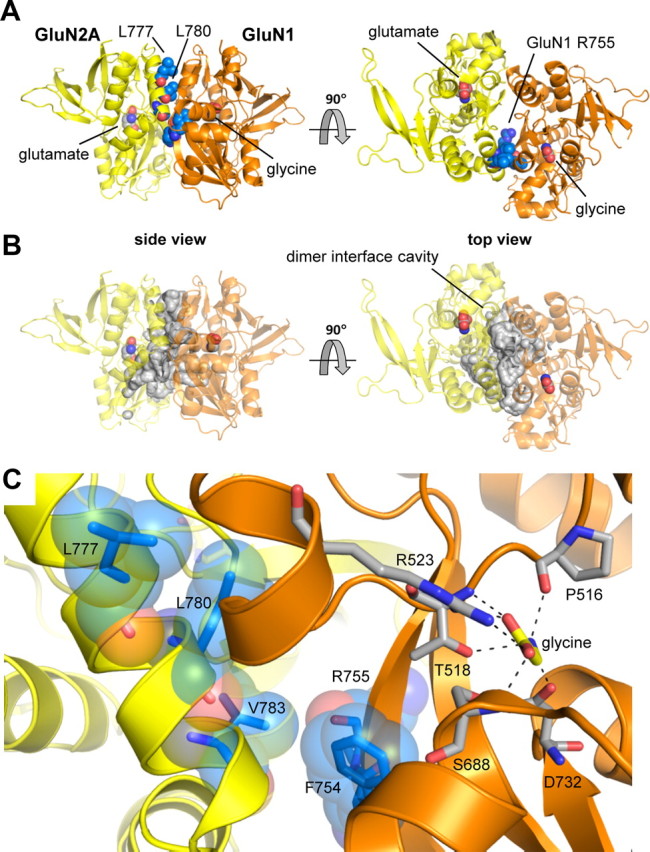
TCN-201 sensitivity is controlled by the agonist binding domain dimer interface between GluN1 and GluN2. A, Residues Leu777, Leu780, and Val783 of GluN2A, as well as F754 and R755 of GluN1, which substantially influence TCN-201 sensitivity, are located at the dimer interface in the crystal structure of the isolated agonist binding domains from GluN1/GluN2A with bound glutamate and glycine (PDB ID 2A5T) (Furukawa et al., 2005). These residues are highlighted as blue spheres. GluN2A is shown in yellow, and GluN1 is shown in orange. B, The residues that influence TCN-201 sensitivity are lining part of a large water-filled cavity (∼5200 Å3) in the dimer interface that can accommodate a modulatory binding site. The cavity was identified using the CASTp server (Dundas et al., 2006), and the surface of the cavity is highlighted in gray. C, The side chain of GluN2A Val783 (shown as blue sticks with transparent blue spheres) is directly facing the hinge region of the bilobed GluN1 agonist binding domain. The path between GluN2A Val783 and the glycine agonist is blocked by Phe754 and Arg755 in the GluN1 hinge region. GluN2A Leu777 and Leu780 are located two and one helical turns away from Val783 in the dimer interface. The distance (Cα–Cα) between GluN2A Val783 and the glycine agonist in GluN1 is 16 Å. Selected residues important for glycine binding are shown as gray sticks, and interactions with glycine are indicated by black dashed lines.
Based on evaluation of changes in TCN-201 and glycine potencies caused by the mutations, we suggest that residues Phe754 and Arg755 in GluN1, as well as Leu777, Leu780, and Val783 in GluN2A are important structural determinants of inhibition by TCN-201. These residues are located at the subunit dimer interface in the structure of the isolated agonist binding domains of heteromeric agonist-bound GluN1/GluN2A (Furukawa et al., 2005) (Fig. 5). The side chain of GluN2A Val783 is directly facing the hinge region of the bilobed GluN1 agonist binding domain. Upon agonist binding, the hinge region of the agonist binding domain undergoes a conformational change that allows closure of the clamshell-like agonist binding domain around the agonist. In the GluN1/GluN2A agonist binding domain structure, GluN2A Val783 and the glycine agonist in GluN1 are separated by 16 Å (Cα–Cα distance). However, three residues in the GluN1 hinge region (GluN1 Phe754 and Arg755, and Ser756; Fig. 5) lie directly between GluN2A Val783 and the agonist glycine. Interestingly, residues Phe754 and Arg755 in GluN1, as well as Leu777, Leu780, and Val783, are lining part of a large water-filled cavity (∼5200 Å3) in the dimer interface that can accommodate a modulatory binding site (Fig. 5B). A binding site for TCN-201 at the subunit dimer interface would be ideally positioned to allosterically couple to binding of GluN1 agonists by influencing the conformation of the agonist binding pocket and, at the same time, discriminate between GluN2 subunits by contacting GluN2 residues.
TCN-201 inhibition is mediated by a multistep mechanism
To further investigate the mechanism of action for TCN-201, we recorded whole-cell current responses under voltage clamp from recombinant GluN1/GluN2A receptors expressed in HEK293 cells. We evaluated the time course and concentration dependence of TCN-201 inhibition of steady-state responses to saturating concentrations of glutamate (50 μm) and glycine (10 μm) (Fig. 6). The onset and offset of TCN-201 inhibition were adequately described by single exponential functions. Interestingly, both the time constants for inhibition (τinhibition) and recovery from inhibition (τrecovery) were dependent on the TCN-201 concentration (Fig. 6B,C). Furthermore, τinhibition and τrecovery were inversely correlated in that higher concentrations of TCN-201 that produced faster onset of inhibition also yielded a slower recovery from inhibition. The dependence of τrecovery on the TCN-201 concentration used to inhibit the receptor as well as the inverse correlation between τinhibition and τrecovery are distinct from previously described properties of competitive NMDA receptor antagonists (Benveniste et al., 1990), as well as other subunit-selective noncompetitive antagonists (e.g., Ro 8-4304, QNZ46, and DQP-1105) (Kew et al., 1998; Acker et al., 2011; Hansen and Traynelis, 2011). Moreover, the changes in τinhibition and τrecovery with TCN-201 concentration differ from those predicted by a bimolecular interaction for which 1/τinhibition is linearly related to the concentration of antagonist, whereas 1/τrecovery is independent of antagonist concentration. Thus, the time course of action for TCN-201 modulation is incompatible with competitive inhibition and suggests a more complex mechanism of action.
Figure 6.

Time course of the onset and recovery of TCN-201 inhibition. A, Representative whole-cell current responses recorded under voltage-clamp from recombinant GluN1/GluN2A receptors expressed in an HEK293 cell using rapid solution exchange. Fitted single-exponential functions are superimposed as white lines. Calibration: Vertical, 100 pA; horizontal, 5 s. B, The rates for the onset of inhibition (1/τinhibition) and recovery from inhibition (1/τrecovery) are plotted versus TCN-201 concentration. Both the time constants for inhibition (τinhibition) and recovery from inhibition (τrecovery) are dependent on the TCN-201 concentration. Data are averaged from three to seven cells for each condition. C, τrecovery is plotted versus τinhibition for the indicated concentrations of TCN-201.
TCN-201 binding is differentially modulated by glutamate and glycine binding
To determine whether binding of TCN-201 is influenced by glutamate binding or receptor activation, we performed experiments in which the receptors were preincubated with 3 μm TCN-201 in the presence of either no agonist, glutamate alone (50 μm), or glycine alone (10 μm) immediately before activation by 50 μm glutamate plus 10 μm glycine. We compared responses following increasing periods of TCN-201 preincubation to control responses in the same recording before TCN-201 preincubation (Fig. 7A). This protocol allowed us to monitor the time course of TCN-201 binding in the presence or absence of agonist. Minimal binding of TCN-201 was observed in the presence of glycine alone and τinhibition could not be reliably determined (Fig. 7B). In the absence of any agonists, the time constant for TCN-201 binding (τinhibition) was 3.5 ± 0.3 s (N = 4) (Fig. 7B,C) and was not significantly different from the τinhibition value of 3.4 ± 0.2 s (N = 7) observed in the presence of both glutamate and glycine (p > 0.05; one-way ANOVA with Tukey–Kramer posttest; Fig. 6). Interestingly, binding of TCN-201 was markedly accelerated (τinhibition = 1.1 ± 0.1 s; N = 4) when TCN-201 was preincubated in the presence of glutamate alone (Fig. 7B,C). These results show that TCN-201 binding is differentially modulated by glutamate and glycine binding. Glutamate binding alone appears to shift the receptor into a conformation with increased rate of TCN-201 binding, whereas binding of glycine alone promotes a conformation with low rate of TCN-201 binding (Fig. 7D). Receptors in the apo-state (i.e., absence of agonist binding) and activated receptors (i.e., with both glutamate and glycine bound) have similar time courses of TCN-201 inhibition with τinhibition values intermediate of those in the presence of either glutamate or glycine alone. The similarity of binding rates in these two conditions suggests that TCN-201 binding does not require receptor activation per se. Furthermore, the indistinguishable τinhibition values obtained for activated receptors and receptors in the apo-state indicate that the TCN-201 binding site or the accessibility of this site is similar for these two receptor conformations (Fig. 7D).
Figure 7.

TCN-201 binding is differentially modulated by glutamate and glycine binding. A, Representative overlay of 10 paired-pulse whole-cell current recordings from one HEK293 cell expressing recombinant GluN1/GluN2A receptors. The cell was initially stepped into glutamate (50 μm) plus glycine (10 μm) to obtain the control response amplitude before preincubation with TCN-201. Subsequent to this control response, the cell was stepped into TCN-201 without agonists (indicated as time 0, t = 0). The cell was then stepped back into glutamate plus glycine at different time intervals (Δt) on subsequent sweeps. TCN-201 was preincubated either with no agonist, with glutamate alone (50 μm), or with glycine alone (10 μm). TCN-201 binding occurred from t = 0 to Δt, and the time constant for TCN-201 inhibition (τinhibition) was obtained by a monoexponential fit to the response amplitudes at Δt as percentage of control amplitude. The recording shown here is with TCN-201 plus glutamate in the preincubation, and the monoexponential fit is shown as a green line. Calibration, 1 s. B, Time course of TCN-201 inhibition in the presence of either no agonist (white), with glutamate alone (50 μm; green), or with glycine alone (10 μm; red). The dashed line is the time course of TCN-201 inhibition observed in the continuous presence of both glutamate (50 μm) plus glycine (10 μm) as depicted in Figure 6. In the presence of glycine alone, the time course of inhibition could not be reliably determined. Data are averaged from three to seven cells for each condition. C, Mean τinhibition values obtained from individual cells for different conditions. The asterisk (*) indicates significantly different (p < 0.05), and ns indicates not significantly different (p > 0.05) (one-way ANOVA with Tukey–Kramer posttest). D, Diagram scheme depicting differences in TCN-201 binding to the different conformations of the NMDA receptor. Error bars indicate SEM.
TCN-201 binding accelerates glycine deactivation
These results suggest a working hypothesis in which a negative allosteric interaction exists between TCN-201 and glycine binding. To test this hypothesis, we evaluated the effects of TCN-201 on the time course of deactivation following rapid removal of glycine for recombinant GluN1/GluN2A receptors expressed in HEK293 cells. We compared deactivation with or without TCN-201 for responses to brief (10 ms) and long (5 s) applications of a high concentration of glycine (1 mm) in the continuous presence of glutamate (50 μm) (Fig. 8). In the case of negative allosteric interaction, a brief glycine application in the presence of TCN-201 could show accelerated glycine deactivation time course compared with control, since bound TCN-201 reduces glycine potency presumably in part by increasing the microscopic dissociation rate constant. Furthermore, prolonged glycine application should result in dissociation of bound TCN-201 as glycine binding reduces TCN-201 affinity. In this scenario, the deactivation time course following prolonged agonist application will become indistinguishable from control as TCN-201 unbinds from the receptor. As predicted from this hypothesis, the weighted time constant for glycine deactivation (τweighted) of responses to a brief glycine application was significantly reduced (i.e., glycine deactivation is accelerated by TCN-201) from 123 ± 11 ms (N = 6) in the absence of TCN-201 to 27 ± 2 ms (N = 6) in the presence of 1 μm TCN-201 (p < 0.05; one-way ANOVA with Tukey–Kramer posttest) (Fig. 8B,F; see Table 2 for τfast and τslow values). Acceleration of glycine deactivation by TCN-201 demonstrates that activated NMDA receptors can simultaneously bind glycine and TCN-201, and again is incompatible with a competitive mechanism of action for TCN-201. For prolonged application of glycine in the presence of TCN-201, we observed a rapidly rising current response followed by a slower increase to steady state that reflects additional glycine binding and resulting TCN-201 dissociation subsequent to a reduction of TCN-201 affinity (Fig. 8C). Since prolonged application of glycine results in complete unbinding of TCN-201 under these experimental conditions, there was no significant difference between τweighted for glycine deactivation of responses to a long glycine application in the presence or absence of TCN-201 (Fig. 8D,F).
Figure 8.
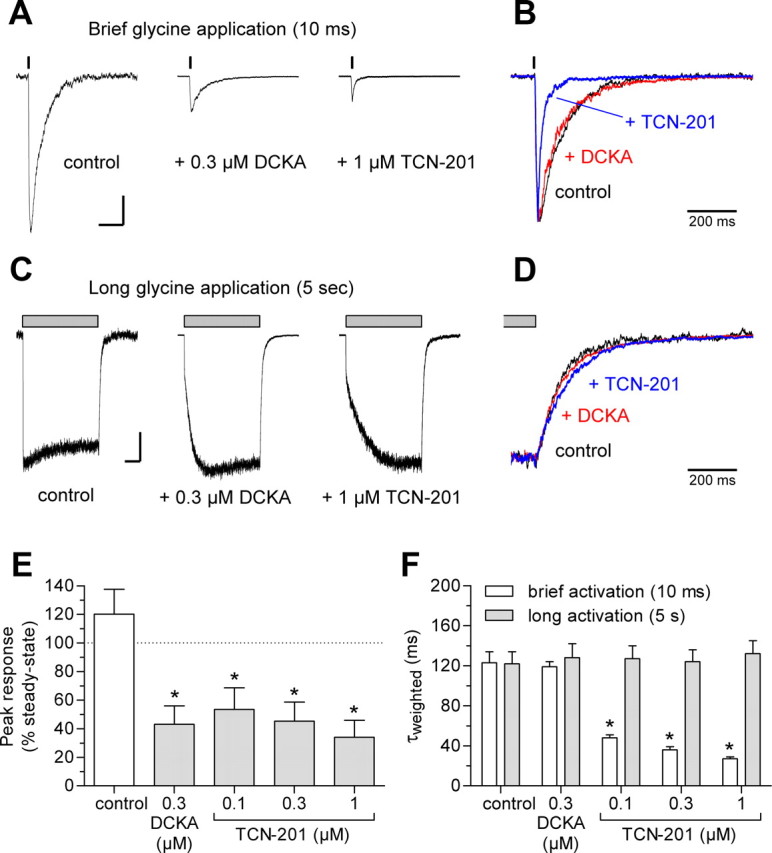
TCN-201 binding accelerates glycine deactivation. A, Representative whole-cell current responses recorded under voltage clamp from recombinant GluN1/GluN2A receptors expressed in HEK293 cells using rapid solution exchange. The receptors were activated by brief application of 1 mm glycine in the continuous presence of 50 μm glutamate and either no antagonist, 0.3 μm DCKA, or 1 μm TCN-201. Calibration: Vertical, 200 pA; horizontal, 200 ms. B, Overlay of normalized responses from A. C, Representative whole-cell current responses from recombinant GluN1/GluN2A receptors activated by long application of 1 mm glycine in the continuous presence of 50 μm glutamate and either no antagonist, 0.3 μm DCKA, or 1 μm TCN-201. Calibration: Vertical, 200 pA; horizontal, 1 s. D, Overlay of normalized responses from C. E, Mean peak responses from brief applications of glycine as percentage of steady-state responses from long applications of glycine. Data are from six cells. The asterisk (*) indicates significantly different from control (white bar; p < 0.05; one-way ANOVA with Tukey–Kramer posttest). F, Summary of τweighted for glycine deactivation of responses to brief and long glycine applications. Data are from six cells. See Table 2 for τfast and τslow values. The asterisk (*) indicates significantly different from control (p < 0.05; one-way ANOVA with Tukey–Kramer posttest). Error bars indicate SEM.
Table 2.
Time constants for deactivation of GluN1/GluN2A NMDA receptors
| Antagonist | Concentration (μm) | N | τfast (ms) | τslow (ms) | % fast |
|---|---|---|---|---|---|
| Brief application (10 ms) | |||||
| Control | — | 6 | 74 ± 20 | 171 ± 18 | 41 ± 17 |
| 7CKA | 0.3 | 6 | 46 ± 7 | 158 ± 10 | 34 ± 6 |
| TCN-201 | 0.1 | 6 | 20 ± 1 | 131 ± 7 | 74 ± 2 |
| TCN-201 | 0.3 | 6 | 18 ± 1 | 123 ± 11 | 82 ± 1 |
| TCN-201 | 1 | 6 | 16 ± 2 | 116 ± 19 | 89 ± 2 |
| Long application (5 s) | |||||
| Control | — | 6 | 122 ± 12 | ||
| 7CKA | 0.3 | 6 | 128 ± 14 | ||
| TCN-201 | 0.1 | 6 | 127 ± 13 | ||
| TCN-201 | 0.3 | 6 | 124 ± 12 | ||
| TCN-201 | 1 | 6 | 132 ± 13 |
The deactivation time courses of current responses following removal of 1000 μm glycine in the continuous presence of 50 μm glutamate plus either TCN-201 or 7-chlorokynurenic acid (7CKA) (as shown in Fig. 8). The deactivation time courses for brief (10 ms) glycine applications were best described using dual-exponential fits and two time constants are listed (τfast and τslow), whereas the deactivation time courses for long (5 s) glycine applications were best described using monoexponential fits and only one time constant is listed (τslow). All values are mean ± SEM.
In contrast to negative allosteric modulation of glycine binding, the time course of glycine deactivation should be unaffected by a glycine site competitive antagonists, since it is not possible for glycine and the competitive antagonist to simultaneously bind to activated NMDA receptors. As expected, the competitive glycine site antagonist 7,5-dichlorokynurenic acid (DCKA) (0.3 μm) did not alter the deactivation time course for either brief (10 ms) or long (5 s) applications of 1 mm glycine in the continuous presence of 50 μm glutamate compared to control in the absence of DCKA (Fig. 8B,D,F). DCKA inhibited the peak response to a brief glycine application to 43 ± 13% of control (N = 6) (Fig. 8A,E).
TCN-201 is a negative allosteric modulator of glycine binding
A straightforward model for allosteric modulation of agonist binding without any change in agonist efficacy is shown in Figure 9A. In this model, the dissociation constant for agonist binding (Ka) is changed by a factor of 1/α upon binding of the allosteric modulator, where α is the allosteric constant (Ehlert, 1988; Christopoulos and Kenakin, 2002). Similarly, the dissociation constant for modulator binding (Kb) is changed by a factor 1/α upon agonist binding. We assume that agonist efficacy E is not changed by modulator binding, which renders the inhibition fully surmountable by increased concentrations of agonist. Positive allosteric modulation is achieved if α > 1 and negative modulation is achieved if α < 1. Figure 9A also shows the relationship describing the dose ratio DR (i.e., the ratio of agonist EC50 values in presence and absence of modulator EC50′/EC50) as a function of the modulator concentration [B], modulator binding affinity Kb, and the allosteric constant α (Ehlert, 1988; Christopoulos and Kenakin, 2002). From this, it can be seen that this type of allosteric modulation is saturable, meaning that an infinite concentration of modulator B will maximally shift the agonist EC50′ value to EC50/α. In addition, it can be seen that, if α = 0, the model in Figure 9A reduces to a competitive mechanism and the relationship becomes the Schild equation. In the case of negative allosteric modulation by TCN-201, we predict that the allosteric constant α will be close to 0 and that binding affinity will be close to the pA2 value obtained in the Schild plot shown in Figure 1F.
Figure 9.

TCN-201 is a negative allosteric modulator of glycine binding. A, Proposed model for TCN-201 inhibition, in which TCN-201 allosterically modulates agonist binding without changing agonist efficacy. A is the agonist glycine, B is the inhibitor TCN-201, and R is the receptor. The dissociation constant for agonist binding (Ka) is changed by an allosteric constant α upon binding of the allosteric modulator. Similarly, the dissociation constant for modulator binding (Kb) is changed by α upon agonist binding. In this model, the agonist efficacy E is not changed upon modulator binding. Positive allosteric modulation is achieved if α > 1 and negative modulation is achieved if α < 1. The relationship describing the dose ratio DR (EC50′/EC50, the ratio of agonist EC50 values in presence and absence of modulator) is shown below. DR is a function of the modulator concentration [B], modulator binding affinity Kb, and the allosteric constant α. B, Analysis of the glycine concentration–response data shown in Figure 1E by directly fitting to the relationship for the dose ratio DR shown in Figure 9A using a global nonlinear regression method (see Materials and Methods). The regression gave a Kb value of 45 nm and an allosteric constant α of 0.0025 for TCN-201 inhibition of GluN1/GluN2A activated by glutamate and glycine. C, Schild plots illustrating the effects of changing the allosteric constant α with constant Kb (45 nm). Low allosteric constants produce Schild plots with only small deviations from the line dictated by the Schild equation (α = 0).
To determine α and Kb for TCN-201 inhibition of GluN1/GluN2A, we reanalyzed the glycine concentration–response data shown in Figure 1E by simultaneously fitting the relationship shown in Figure 9A to all of the data using a global nonlinear regression method (Christopoulos and Kenakin, 2002) (see Materials and Methods). This analysis gave a Kb value of 45 nm and an allosteric constant α of 0.0025 (Fig. 9B). The allosteric constant α = 0.0025 implies that TCN-201 can maximally cause a 400-fold (i.e., 1/α) increase in glycine EC50. Since glycine EC50 is 1.1 μm in the absence of TCN-201, an infinite concentration of TCN-201 will increase glycine EC50 to 440 μm. However, TCN-201 concentrations well above the limit of solubility, estimated to be 18 μm, would be required to maximally shift the glycine EC50. In fact, the Kb of 45 nm for TCN-201 in the absence of glycine is predicted to increase 400-fold to 18 μm in the presence of an infinite concentration of glycine. Figure 9C illustrates the effect of different values for the allosteric constant α on the Schild plot for negative allosteric modulators with Kb = 45 nm.
Discussion
The results from this study suggest that a binding site for allosteric modulators of NMDA receptor exists at the dimer interface between the GluN1 and GluN2 agonist binding domains. The dimer interface between agonist binding domains of AMPA receptor subunits is a well described binding site for allosteric modulation (Sun et al., 2002; Jin et al., 2005; Hald et al., 2009; Ptak et al., 2009; Ahmed et al., 2010), and positive allosteric modulators of AMPA receptor function are currently being evaluated for the treatment of depression and attention deficit/hyperactivity disorder (ADHD), as well as for the improvement of cognitive deficits in Alzheimer's disease (Ward et al., 2010). Allosteric AMPA receptor modulators enhance receptor function by reducing desensitization and/or by slowing deactivation of the receptor response. Similarly, it has been shown that Na+ and Cl− ions bind and stabilize the dimer interface in kainate receptors to attenuate desensitization (Wong et al., 2006, 2007; Plested and Mayer, 2007; Plested et al., 2008) and that Ca2+ ions stabilize the dimer interface of the structurally related glutamate-like receptor GluD2 (Naur et al., 2007; Hansen et al., 2009). By contrast, modulators that bind the dimer interface between the agonist binding domains of GluN1 and GluN2 in NMDA receptors have not been described before this study. This GluN1-GluN2 dimer interface buries ∼2600 Å of solvent-accessible surface area and harbors a large water-filled pocket that can accommodate a modulatory binding site (Furukawa et al., 2005) (Fig. 5).
The data presented here provide multiple lines of evidence to suggest that TCN-201 is a negative allosteric modulator of glycine binding to the GluN1 subunit of NMDA receptors. First, TCN-201 binding reduces glycine potency and vice versa (Fig. 1C,E). Second, the Schild slope was significantly lower than unity, indicating TCN-201 is not a competitive antagonist (Fig. 1F). Third, the rates of inhibition and recovery depended on the TCN-201 concentration in a manner that is incompatible with a competitive mechanism of action (Fig. 6). Finally, TCN-201 and glycine can simultaneously bind activated NMDA receptors, resulting in acceleration of glycine deactivation (Fig. 8). This mechanism of TCN-201 action is strikingly different from those of compounds or ions that bind to and stabilize the agonist binding domain interface of AMPA and kainate receptors.
The allosteric constant α has been used to describe the effectiveness of allosteric modulators of G-protein-coupled receptors (Lazareno and Birdsall, 1995; Schetz and Sibley, 1997; Hedlund et al., 1999). We estimated the allosteric constant α for TCN-201 to be 0.0025, which results in inhibition that is difficult to distinguish from a competitive mechanism of action. The small allosteric constant α prevented us from observing saturation of the increase in glycine EC50 at the TCN-201 concentrations evaluated here. It was therefore not possible to determine whether TCN-201 modulates agonist efficacy (i.e., NMDA receptor gating) in addition to its effects on glycine binding. This distinction would require functional data at saturating concentrations of both glycine and TCN-201 to eliminate allosteric effects on binding; however, the solubility of TCN-201 precludes this determination. For comparison, the allosteric GluN2B subunit-selective modulator ifenprodil increases potency of GluN2 agonists, such as NMDA and glutamate, but at the same time reduces agonist efficacy (Kew et al., 1996; Zhang et al., 2000). Since allosteric interactions are reciprocal, the GluN2 agonists also increase potency of ifenprodil.
Studies that seek to understand the structure–activity relationship of allosteric modulators at the TCN-201 binding site could potentially identify ligands with different subunit selectivity and mechanism of action (e.g., allosteric modulation of glutamate binding). Moreover, compounds acting at the TCN-201 binding site seem capable of achieving considerable subunit selectivity, as demonstrated by the >1000-fold selectivity of TCN-201 for GluN1/GluN2A over other NMDA receptor subtypes. The characterization of TCN-201 inhibition described here reveals previously unrecognized features of NMDA receptor structure and function, and provides compelling data suggesting that novel allosteric regulators of NMDA receptor function exist with high subunit selectivity. Such compounds could provide an opportunity for the development of new pharmacological tools and therapeutic agents with novel mechanisms underlying their subunit selectivity.
Footnotes
This work was supported by National Institutes of Health–National Institute of Neurological Disorders and Stroke Grants NS036654 and NS065371 (S.F.T.), National Institute on Drug Abuse Grant DA015040 (K.K.O.), and National Institute of General Medical Sciences Grant GM008602 (K.K.O.). We thank David J. A. Wyllie for comments on this manuscript. We also thank Tim M. Acker for assistance in the determination of compound solubility.
The authors declare no competing financial interests.
References
- Acker TM, Yuan H, Hansen KB, Vance KM, Ogden KK, Jensen HS, Burger PB, Mullasseril P, Snyder JP, Liotta DC, Traynelis SF. Mechanism for noncompetitive inhibition by novel GluN2C/D N-methyl-d-aspartate receptor subunit-selective modulators. Mol Pharmacol. 2011;80:782–795. doi: 10.1124/mol.111.073239. [DOI] [PMC free article] [PubMed] [Google Scholar]
- Ahmed AH, Ptak CP, Oswald RE. Molecular mechanism of flop selectivity and subsite recognition for an AMPA receptor allosteric modulator: structures of GluA2 and GluA3 in complexes with PEPA. Biochemistry. 2010;49:2843–2850. doi: 10.1021/bi1000678. [DOI] [PMC free article] [PubMed] [Google Scholar]
- Arunlakshana O, Schild HO. Some quantitative uses of drug antagonists. Br J Pharmacol Chemother. 1959;14:48–58. doi: 10.1111/j.1476-5381.1959.tb00928.x. [DOI] [PMC free article] [PubMed] [Google Scholar]
- Benveniste M, Mienville JM, Sernagor E, Mayer ML. Concentration-jump experiments with NMDA antagonists in mouse cultured hippocampal neurons. J Neurophysiol. 1990;63:1373–1384. doi: 10.1152/jn.1990.63.6.1373. [DOI] [PubMed] [Google Scholar]
- Bettini E, Sava A, Griffante C, Carignani C, Buson A, Capelli AM, Negri M, Andreetta F, Senar-Sancho SA, Guiral L, Cardullo F. Identification and characterization of novel NMDA receptor antagonists selective for NR2A- over NR2B-containing receptors. J Pharmacol Exp Ther. 2010;335:636–644. doi: 10.1124/jpet.110.172544. [DOI] [PubMed] [Google Scholar]
- Christopoulos A, Kenakin T. G protein-coupled receptor allosterism and complexing. Pharmacol Rev. 2002;54:323–374. doi: 10.1124/pr.54.2.323. [DOI] [PubMed] [Google Scholar]
- Costa BM, Irvine MW, Fang G, Eaves RJ, Mayo-Martin MB, Skifter DA, Jane DE, Monaghan DT. A novel family of negative and positive allosteric modulators of NMDA receptors. J Pharmacol Exp Ther. 2010;335:614–621. doi: 10.1124/jpet.110.174144. [DOI] [PMC free article] [PubMed] [Google Scholar]
- Dundas J, Ouyang Z, Tseng J, Binkowski A, Turpaz Y, Liang J. CASTp: computed atlas of surface topography of proteins with structural and topographical mapping of functionally annotated residues. Nucleic Acids Res. 2006;34:W116–W118. doi: 10.1093/nar/gkl282. [DOI] [PMC free article] [PubMed] [Google Scholar]
- Ehlert FJ. Estimation of the affinities of allosteric ligands using radioligand binding and pharmacological null methods. Mol Pharmacol. 1988;33:187–194. [PubMed] [Google Scholar]
- Furukawa H, Singh SK, Mancusso R, Gouaux E. Subunit arrangement and function in NMDA receptors. Nature. 2005;438:185–192. doi: 10.1038/nature04089. [DOI] [PubMed] [Google Scholar]
- Gielen M, Le Goff A, Stroebel D, Johnson JW, Neyton J, Paoletti P. Structural rearrangements of NR1/NR2A NMDA receptors during allosteric inhibition. Neuron. 2008;57:80–93. doi: 10.1016/j.neuron.2007.11.021. [DOI] [PMC free article] [PubMed] [Google Scholar]
- Gielen M, Siegler Retchless B, Mony L, Johnson JW, Paoletti P. Mechanism of differential control of NMDA receptor activity by NR2 subunits. Nature. 2009;459:703–707. doi: 10.1038/nature07993. [DOI] [PMC free article] [PubMed] [Google Scholar]
- Hald H, Ahring PK, Timmermann DB, Liljefors T, Gajhede M, Kastrup JS. Distinct structural features of cyclothiazide are responsible for effects on peak current amplitude and desensitization kinetics at iGluR2. J Mol Biol. 2009;391:906–917. doi: 10.1016/j.jmb.2009.07.002. [DOI] [PubMed] [Google Scholar]
- Hansen KB, Traynelis SF. Structural and mechanistic determinants of a novel site for noncompetitive inhibition of GluN2D-containing NMDA receptors. J Neurosci. 2011;31:3650–3661. doi: 10.1523/JNEUROSCI.5565-10.2011. [DOI] [PMC free article] [PubMed] [Google Scholar]
- Hansen KB, Naur P, Kurtkaya NL, Kristensen AS, Gajhede M, Kastrup JS, Traynelis SF. Modulation of the dimer interface at ionotropic glutamate-like receptor δ2 by d-serine and extracellular calcium. J Neurosci. 2009;29:907–917. doi: 10.1523/JNEUROSCI.4081-08.2009. [DOI] [PMC free article] [PubMed] [Google Scholar]
- Hansen KB, Furukawa H, Traynelis SF. Control of assembly and function of glutamate receptors by the amino-terminal domain. Mol Pharmacol. 2010;78:535–549. doi: 10.1124/mol.110.067157. [DOI] [PMC free article] [PubMed] [Google Scholar]
- Hedlund PB, Carson MJ, Sutcliffe JG, Thomas EA. Allosteric regulation by oleamide of the binding properties of 5-hydroxytryptamine7 receptors. Biochem Pharmacol. 1999;58:1807–1813. doi: 10.1016/s0006-2952(99)00274-9. [DOI] [PubMed] [Google Scholar]
- Ishii T, Moriyoshi K, Sugihara H, Sakurada K, Kadotani H, Yokoi M, Akazawa C, Shigemoto R, Mizuno N, Masu M. Molecular characterization of the family of the N-methyl-d-aspartate receptor subunits. J Biol Chem. 1993;268:2836–2843. [PubMed] [Google Scholar]
- Jin R, Clark S, Weeks AM, Dudman JT, Gouaux E, Partin KM. Mechanism of positive allosteric modulators acting on AMPA receptors. J Neurosci. 2005;25:9027–9036. doi: 10.1523/JNEUROSCI.2567-05.2005. [DOI] [PMC free article] [PubMed] [Google Scholar]
- Kalia LV, Kalia SK, Salter MW. NMDA receptors in clinical neurology: excitatory times ahead. Lancet Neurol. 2008;7:742–755. doi: 10.1016/S1474-4422(08)70165-0. [DOI] [PMC free article] [PubMed] [Google Scholar]
- Kew JN, Trube G, Kemp JA. A novel mechanism of activity-dependent NMDA receptor antagonism describes the effect of ifenprodil in rat cultured cortical neurones. J Physiol. 1996;497:761–772. doi: 10.1113/jphysiol.1996.sp021807. [DOI] [PMC free article] [PubMed] [Google Scholar]
- Kew JN, Trube G, Kemp JA. State-dependent NMDA receptor antagonism by Ro 8-4304, a novel NR2B selective, non-competitive, voltage-independent antagonist. Br J Pharmacol. 1998;123:463–472. doi: 10.1038/sj.bjp.0701634. [DOI] [PMC free article] [PubMed] [Google Scholar]
- Lazareno S, Birdsall NJ. Detection, quantitation, and verification of allosteric interactions of agents with labeled and unlabeled ligands at G protein-coupled receptors: interactions of strychnine and acetylcholine at muscarinic receptors. Mol Pharmacol. 1995;48:362–378. [PubMed] [Google Scholar]
- McKay S, Griffiths NH, Butters PA, Thubron EB, Hardingham GE, Wyllie DJ. Direct pharmacological monitoring of the developmental switch in NMDAR subunit composition using TCN 213, a GluN2A-selective, glycine-dependent antagonist. Br J Pharmacol. 2011 doi: 10.1111/j.1476-5381.2011.01748.x. [DOI] [PMC free article] [PubMed] [Google Scholar]
- Mony L, Kew JN, Gunthorpe MJ, Paoletti P. Allosteric modulators of NR2B-containing NMDA receptors: molecular mechanisms and therapeutic potential. Br J Pharmacol. 2009;157:1301–1317. doi: 10.1111/j.1476-5381.2009.00304.x. [DOI] [PMC free article] [PubMed] [Google Scholar]
- Monyer H, Sprengel R, Schoepfer R, Herb A, Higuchi M, Lomeli H, Burnashev N, Sakmann B, Seeburg PH. Heteromeric NMDA receptors: molecular and functional distinction of subtypes. Science. 1992;256:1217–1221. doi: 10.1126/science.256.5060.1217. [DOI] [PubMed] [Google Scholar]
- Monyer H, Burnashev N, Laurie DJ, Sakmann B, Seeburg PH. Developmental and regional expression in the rat brain and functional properties of four NMDA receptors. Neuron. 1994;12:529–540. doi: 10.1016/0896-6273(94)90210-0. [DOI] [PubMed] [Google Scholar]
- Mosley CA, Acker TM, Hansen KB, Mullasseril P, Andersen KT, Le P, Vellano KM, Bräuner-Osborne H, Liotta DC, Traynelis SF. Quinazolin-4-one derivatives: a novel class of noncompetitive NR2C/D subunit-selective N-methyl-d-aspartate receptor antagonists. J Med Chem. 2010;53:5476–5490. doi: 10.1021/jm100027p. [DOI] [PMC free article] [PubMed] [Google Scholar]
- Mullasseril P, Hansen KB, Vance KM, Ogden KK, Yuan H, Kurtkaya NL, Santangelo R, Orr AG, Le P, Vellano KM, Liotta DC, Traynelis SF. A subunit-selective potentiator of NR2C- and NR2D-containing NMDA receptors. Nat Commun. 2010;1:90. doi: 10.1038/ncomms1085. [DOI] [PMC free article] [PubMed] [Google Scholar]
- Naur P, Hansen KB, Kristensen AS, Dravid SM, Pickering DS, Olsen L, Vestergaard B, Egebjerg J, Gajhede M, Traynelis SF, Kastrup JS. Ionotropic glutamate-like receptor delta2 binds d-serine and glycine. Proc Natl Acad Sci U S A. 2007;104:14116–14121. doi: 10.1073/pnas.0703718104. [DOI] [PMC free article] [PubMed] [Google Scholar]
- Ogden KK, Traynelis SF. New advances in NMDA receptor pharmacology. Trends Pharmacol Sci. 2011;32:726–733. doi: 10.1016/j.tips.2011.08.003. [DOI] [PMC free article] [PubMed] [Google Scholar]
- Plested AJ, Mayer ML. Structure and mechanism of kainate receptor modulation by anions. Neuron. 2007;53:829–841. doi: 10.1016/j.neuron.2007.02.025. [DOI] [PubMed] [Google Scholar]
- Plested AJ, Vijayan R, Biggin PC, Mayer ML. Molecular basis of kainate receptor modulation by sodium. Neuron. 2008;58:720–735. doi: 10.1016/j.neuron.2008.04.001. [DOI] [PMC free article] [PubMed] [Google Scholar]
- Ptak CP, Ahmed AH, Oswald RE. Probing the allosteric modulator binding site of GluR2 with thiazide derivatives. Biochemistry. 2009;48:8594–8602. doi: 10.1021/bi901127s. [DOI] [PMC free article] [PubMed] [Google Scholar]
- Schetz JA, Sibley DR. Zinc allosterically modulates antagonist binding to cloned D1 and D2 dopamine receptors. J Neurochem. 1997;68:1990–1997. doi: 10.1046/j.1471-4159.1997.68051990.x. [DOI] [PubMed] [Google Scholar]
- Sun Y, Olson R, Horning M, Armstrong N, Mayer M, Gouaux E. Mechanism of glutamate receptor desensitization. Nature. 2002;417:245–253. doi: 10.1038/417245a. [DOI] [PubMed] [Google Scholar]
- Traynelis SF, Burgess MF, Zheng F, Lyuboslavsky P, Powers JL. Control of voltage-independent zinc inhibition of NMDA receptors by the NR1 subunit. J Neurosci. 1998;18:6163–6175. doi: 10.1523/JNEUROSCI.18-16-06163.1998. [DOI] [PMC free article] [PubMed] [Google Scholar]
- Traynelis SF, Wollmuth LP, McBain CJ, Menniti FS, Vance KM, Ogden KK, Hansen KB, Yuan H, Myers SJ, Dingledine R. Glutamate receptor ion channels: structure, regulation, and function. Pharmacol Rev. 2010;62:405–496. doi: 10.1124/pr.109.002451. [DOI] [PMC free article] [PubMed] [Google Scholar]
- Ulbrich MH, Isacoff EY. Subunit counting in membrane-bound proteins. Nat Methods. 2007;4:319–321. doi: 10.1038/NMETH1024. [DOI] [PMC free article] [PubMed] [Google Scholar]
- Vance KM, Simorowski N, Traynelis SF, Furukawa H. Ligand-specific deactivation time course of GluN1/GluN2D NMDA receptors. Nat Commun. 2011;2:294. doi: 10.1038/ncomms1295. [DOI] [PMC free article] [PubMed] [Google Scholar]
- Vicini S, Wang JF, Li JH, Zhu WJ, Wang YH, Luo JH, Wolfe BB, Grayson DR. Functional and pharmacological differences between recombinant N-methyl-d-aspartate receptors. J Neurophysiol. 1998;79:555–566. doi: 10.1152/jn.1998.79.2.555. [DOI] [PubMed] [Google Scholar]
- Ward SE, Bax BD, Harries M. Challenges for and current status of research into positive modulators of AMPA receptors. Br J Pharmacol. 2010;160:181–190. doi: 10.1111/j.1476-5381.2010.00726.x. [DOI] [PMC free article] [PubMed] [Google Scholar]
- Watanabe M, Inoue Y, Sakimura K, Mishina M. Developmental changes in distribution of NMDA receptor channel subunit mRNAs. Neuroreport. 1992;3:1138–1140. doi: 10.1097/00001756-199212000-00027. [DOI] [PubMed] [Google Scholar]
- Williams K. Ifenprodil discriminates subtypes of the N-methyl-d-aspartate receptor: selectivity and mechanisms at recombinant heteromeric receptors. Mol Pharmacol. 1993;44:851–859. [PubMed] [Google Scholar]
- Wong AY, Fay AM, Bowie D. External ions are coactivators of kainate receptors. J Neurosci. 2006;26:5750–5755. doi: 10.1523/JNEUROSCI.0301-06.2006. [DOI] [PMC free article] [PubMed] [Google Scholar]
- Wong AY, MacLean DM, Bowie D. Na+/Cl− dipole couples agonist binding to kainate receptor activation. J Neurosci. 2007;27:6800–6809. doi: 10.1523/JNEUROSCI.0284-07.2007. [DOI] [PMC free article] [PubMed] [Google Scholar]
- Wyllie DJ, Chen PE. Taking the time to study competitive antagonism. Br J Pharmacol. 2007;150:541–551. doi: 10.1038/sj.bjp.0706997. [DOI] [PMC free article] [PubMed] [Google Scholar]
- Yuan H, Hansen KB, Vance KM, Ogden KK, Traynelis SF. Control of NMDA receptor function by the NR2 subunit amino-terminal domain. J Neurosci. 2009;29:12045–12058. doi: 10.1523/JNEUROSCI.1365-09.2009. [DOI] [PMC free article] [PubMed] [Google Scholar]
- Zhang XX, Bunney BS, Shi WX. Enhancement of NMDA-induced current by the putative NR2B selective antagonist ifenprodil. Synapse. 2000;37:56–63. doi: 10.1002/(SICI)1098-2396(200007)37:1<56::AID-SYN6>3.0.CO;2-D. [DOI] [PubMed] [Google Scholar]