Abstract
To evaluate the development of diabetic neuropathy, the current study examined changes in peripheral axonal function. Nerve excitability techniques were undertaken in 108 type 2 diabetic patients with nerve conduction studies (NCS), HbA1c levels, and total neuropathy score (TNS). Patients were categorized into two cohorts: patients with diabetes without neuropathy (DWN group [n = 56]) and patients with diabetes with neuropathy (DN group [n = 52]) and further into severity grade 0 (TNS 0–1 [n = 35]), grade 1 (TNS 2–8 [n = 42]), and grade 2/3 (TNS 9–24 [n = 31]). Results revealed that the DWN group had a significantly increased threshold, prolonged latency, and changes in excitability parameters compared with age-matched control subjects. Patients with neuropathy demonstrated significant alteration in recovery cycle parameters and depolarizing threshold electrotonus. Within the DWN cohort, there were significant correlations between HbA1c level and latency and subexcitability, whereas the estimated glomerular filtration rate correlated with superexcitability in patients with neuropathy. Furthermore, excitability parameters became progressively more abnormal with increasing clinical severity. These results suggest a spectrum of excitability abnormalities in patients with diabetes and that early axonal dysfunction may be detected prior to the development of neuropathy. As progressive changes in excitability parameters correlated to neuropathy severity, excitability testing may provide a biomarker of the early development and severity of diabetic neuropathy, providing insights into the pathophysiological mechanisms producing axonal dysfunction.
The prevalence of diabetes has increased dramatically in the last three decades (1) and currently affects an estimated 285–347 million people worldwide (1,2). Neuropathy remains one of the most common and troubling complications of diabetes, affecting up to 50% of all patients (3,4). The development of neuropathy greatly increases the morbidity of diabetes and significantly affects quality of life (5,6). Typically presenting as a distal sensorimotor polyneuropathy, diabetic neuropathy produces prominent symptoms, including neuropathic pain, numbness, tingling, weakness, and balance problems. Furthermore, in addition to neuropathic symptoms, the secondary complications may lead to serious further morbidity including ulceration, fractures, amputations, and even death (7,8).
The pathophysiology underlying the development of diabetic neuropathy remains unclear but has been linked to multiple metabolic and neurovascular factors (9–12). Glycemic control and glycated hemoglobin levels correlate with the incidence of neuropathy, and tight glycemic control may slow progression of diabetic neuropathy (13–15). However, glycemic control alone is not sufficient to account for the development of neuropathy, and a range of other factors may contribute, including accumulation of advanced glycation end products, reductions in blood flow, and oxidative stress (12,14). Given the high risk of morbidity arising from diabetic neuropathy, early detection and intervention is crucial prior to the onset of neuropathic symptoms. However, neuropathy in diabetic patients remains underdiagnosed, and early identification is problematic (16). Conventional nerve conduction studies (NCS) have been demonstrated to lack sensitivity to change, particularly in early neuropathy (17–19).
Nerve excitability techniques have been established as a tool to assess axonal ion channel function and membrane potential (20). Recent studies have established an abnormal nerve excitability profile in patients with established diabetic neuropathy (21–23). However the utility of nerve excitability techniques in detecting early pathophysiological changes in diabetic nerves and assisting in early intervention for diabetic patients at risk for neuropathy has not yet been determined. The aim of the current study was to identify if early changes in nerve excitability profiles occurred prior to the development of clinical neuropathic symptoms in patients with diabetes, to explore the potential of such techniques as a biomarker of early axonal dysfunction in diabetes.
RESEARCH DESIGN AND METHODS
Clinical assessment and neurophysiological investigations were undertaken in 108 type 2 diabetic patients. We excluded patients with evidence of carpal tunnel syndrome or cervical radiculopathy determined by NCS or cervical spine imaging. Patients undergoing hemodialysis also were excluded. Patients were recruited from the Prince of Wales Hospital, Sydney, Australia, and the Wan Fang Hospital, Taipei, Taiwan. In addition, nerve excitability properties were recorded from a cohort of 30 age- and sex-matched healthy control subjects (HC group), who had no clinical or neurophysiological evidence of a peripheral nerve disorder, to compare with diabetic patients. Informed consent to the procedures was obtained from all subjects. This was approved by the Joint Institutional Review Board Committee of Wan Fang Hospital and the Human Research Ethics Committees of the University of New South Wales and the South Eastern Sydney Area Health Service Human Research Ethics Committee. The studies were performed in accordance with the Declaration of Helsinki.
Clinical assessment and neuropathy grading.
Patients were classified into two groups based on their neuropathy status: diabetic patients without neuropathy (DWN group) and diabetic patients with neuropathy (DN group). This classification was based on neurophysiological and clinical features. For neurophysiological analysis, criterion 3 of the nerve conduction criteria for the diagnosis of diabetic neuropathy derived from the American Academy of Neurology diagnostic criteria was used (24). According to criterion 3, nerve conduction studies were considered abnormal if there were two abnormal nerve conduction results in two separate nerves, one of which was the sural nerve. Abnormal studies were defined as outside the normative range for amplitude, latency, or conduction velocity, as defined by normative values per center. NCS were undertaken as per routine clinical practice, assessing the median, ulnar, peroneal, tibial, and sural nerves using standard clinical neurophysiology equipment.
To assess clinical symptoms, a standard neurologic examination was undertaken, comprising assessment of sensory and motor symptoms, evaluation of deep tendon reflexes, muscle strength, and sensory function, including pinprick and vibration sensibility. If patients demonstrated clinical symptoms of neuropathy as determined by clinical assessment or if NCS results were abnormal according to criterion 3, patients were classified into the DN cohort.
Patients also were classified into neuropathy grades using the composite total neuropathy score (TNS) (25). A reduced version of the TNS was used (26), comprising eight categories, each graded from 0 to 4, for a total score range of 0–32 points. Categories included the extent and severity of sensory and motor symptom reports, assessment of deep tendon reflexes, muscle strength testing, vibration sensibility (128-Hz tuning fork), pinprick sensibility, and tibial and sural nerve amplitudes, with 0 corresponding to no dysfunction and 4 to severe dysfunction. Patients were grouped into three groups based on TNS scores, corresponding to neuropathy severity: grade 0 with no neuropathy (TNS score 0–1), grade 1 with mild neuropathy (TNS score 2–8), and grade 2/3 with moderate/severe neuropathy (TNS score 9–24). Routine blood tests were undertaken to obtain values of glycosylated hemoglobin (HbA1c) and estimated glomerular filtration rate (eGFR), within 3 months of the date of nerve assessment.
Nerve excitability measurement and parameters.
Nerve excitability studies were undertaken on the median nerve, stimulating over the median nerve at the wrist and recording compound muscle action potentials (CMAPs) from the abductor pollicis brevis, as per previously detailed protocols (20). A stimulus current was applied using an isolated linear bipolar constant-current stimulator (DS5; Digitimer, Welwyn Garden City, U.K.). Stimulation and recording were controlled by software (QTRAC version 9; Institute of Neurology, London, U.K.) using the multiple excitability protocol, TRONDNF. The changes in current required to produce a target potential corresponding to 40% of the maximal CMAP were tracked (20). Latency was defined as the time delay (ms) between stimulus onset and peak CMAP response. Skin temperature was monitored at the site of stimulation and was maintained at >32°C.
The TRONDNF protocol incorporated the following measures: 1) a stimulus-response curve; 2) threshold electrotonus (TE) utilizing subthreshold 100-ms polarizing currents in both depolarizing (TEd; +40%) and hyperpolarizing (TEh; −40%) directions to alter the potential difference across the internodal membrane; and 3) recovery cycle using a paired pulse paradigm with a supramaximal conditioning stimulus followed by a test stimulus at interstimulus intervals from 2 to 200 ms to assess the characteristic excitability changes following an impulse (20). The relative refractory period (RRP) was measured as the duration at which threshold change recovered to its control value, superexcitability as the maximal threshold reduction, and subexcitability as the maximal threshold increase after an interstimulus interval of 10 ms.
Data and statistical analysis.
Data are presented as means ± SEM. P values ≤0.05 were considered significant. Independent t tests (two tailed) or one-way ANOVA with Dunnett t post hoc tests were used to compare groups as appropriate. Pearson R or Spearman ρ, depending on the normality (Lilliefors) correlation coefficients, were used to assess the relationship of excitability parameters and clinical markers. QTrac P (Institute of Neurology) and SPSS (version 19; IBM, New York, NY) software packages were used for data analysis.
RESULTS
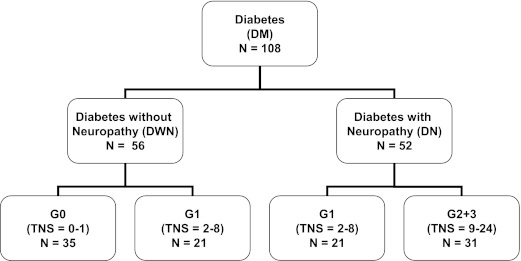
The demographic and clinical profiles of 108 diabetic patients are summarized in Table 1 and Fig. 1. In total, 52 patients were classified with neuropathy (DN group) and 56 were classified without neuropathy (DWN group). DWN patients were all graded with either none or mild clinical signs of neuropathy (35 patients were classified as grade 0; 21 were classified as grade 1), whereas DN patients were all clinically classified as having mild or moderate/severe neuropathy (21 patients were classified as grade 1; 31 were classified as grade 2 or 3).
TABLE 1.
Demographic and clinical profile of diabetic patients, divided into neuropathy severity grades according to TNS and compared with healthy control subjects
FIG. 1.
Flowchart categorizing 108 diabetic patients into patients with (DN group) and without (DWN group) neuropathy and subsequently into neuropathy severity grades 0, 1, and 2/3, according to TNS.
Early changes in axonal excitability in diabetes.
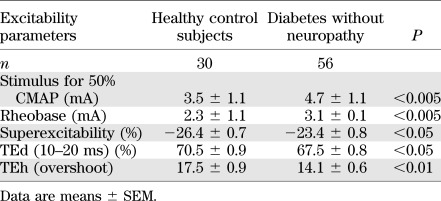
In comparison with healthy control subjects, there were alterations in several nerve excitability parameters in diabetic patients without neuropathy (Table 2). The stimulus required to produce a response of 50% maximal CMAP (P < 0.005) and the rheobase (P < 0.005) were significantly increased, indicating that the threshold of the nerve had increased. Differences also were noted in TE (Table 2), with reductions in a number of parameters consistent with decreased accommodation to polarization (27) (TEh [overshoot] P < 0.005; TEd [10–20 ms] P < 0.05). In the recovery cycle, superexcitability was significantly decreased (P < 0.05). Likewise, nerve excitability studies identified the same pattern of early abnormalities in patients classified with no clinical symptoms (grade 0), with significantly increased threshold (4.7 ± 1.1 mA; P < 0.01) and rheobase (3.1 ± 1.1 mA; P < 0.01) and reductions in depolarizing TE (TEd 10–20 ms, 67.6 ± 1.1%; P < 0.05) and superexcitability (−23.0 ± 1.0%; P < 0.01). These findings suggest that nerve excitability parameters may be more sensitive to preclinical changes in diabetic nerves than traditional NCS or clinical scales.
TABLE 2.
Comparison of excitability parameters of healthy control subjects compared with diabetic patients without neuropathy
Progressive excitability changes in diabetes.
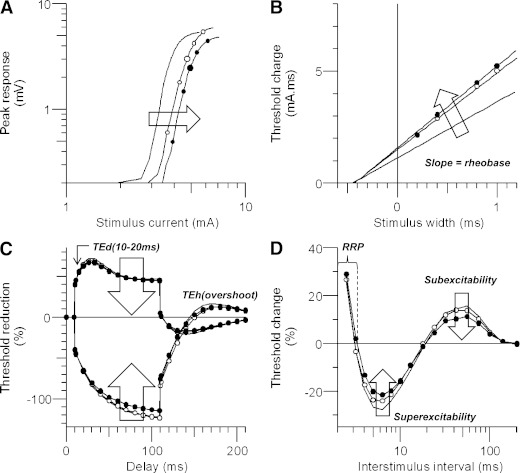
There was a progressive trend of changes between the excitability profiles of healthy control subjects and DWN and DN patients (Fig. 2). The stimulus-response curve was significantly shifted to the right (P < 0.05) (Fig. 2A and Table 2), indicating that nerves were progressively more difficult to activate. The rheobasic current increased, demonstrated by the steeper slope of the strength-duration relationship, also indicating that a greater current was required to elicit the target potential as neuropathy progressed (P < 0.05) (Fig. 2B). There also was less change in the profile of TE waveforms (Fig. 2C), demonstrating less accommodation to polarization as the severity of neuropathy increased and “flattening” of the recovery cycle curves (superexcitability; P < 0.0001) (Fig. 2D).
FIG. 2.
Nerve excitability changes in patients with diabetes. Healthy control subjects are depicted by solid lines, DWN patients as open circles, and DN patients as filled circles. A: Progressive changes in stimulus-response curves, demonstrating increasing stimulus threshold. B: Strength-duration relationship, with increased rheobase in patients with diabetes. C: TE curves demonstrating reduced threshold change in patients with diabetic neuropathy. D: Recovery cycles illustrating reduced progressive reductions in superexcitability and subexcitability.
Clinical severity scores and axonal excitability parameters.
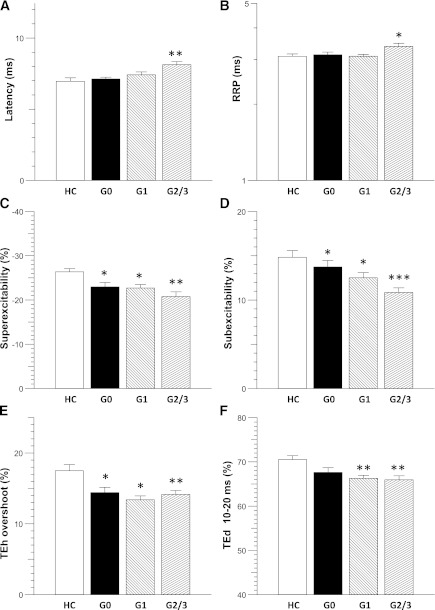
To determine the changes in excitability parameters with increasing clinical severity of neuropathy, diabetic patients were compared on the basis of TNS scores. Some parameters only were significantly altered in patients with moderate/severe neuropathy, as compared with healthy control subjects, including increased latency (P < 0.005; HC group: 7.0 ± 0.3 ms; grade 2/3: 8.1 ± 0.2 ms; Dunnett t P < 0.005) (Fig. 3A) and prolonged RRP (P < 0.005; HC group: 3.1 ± 1.0 ms; grade 2/3: 3.4 ± 1.0 ms; Dunnett t P < 0.05) (Fig. 2B).
FIG. 3.
Comparison of excitability findings between healthy control subjects and patients with diabetes (TNS grades 0, 1, and 2/3). A: Latency (ms) was significantly increased in grade 2/3 patients. B: RRP (ms) was prolonged in grade 2/3 patients. Recovery cycle parameters (C) superexcitability (%) and (D) subexcitability (%) demonstrated significant changes in all TNS grades. E: TEh (overshoot) was reduced in all TNS grades. F: TEd (10–20 ms) was reduced in patients with TNS grades 1 and 2/3. *P < 0.05; **P < 0.005; ***P < 0.0005.
However, there were some excitability parameters that changed in a gradual, stepwise fashion with increasing severity of neuropathy. First, in the recovery cycle, changes in superexcitability seemed the most sensitive (P < 0.005) (Fig. 3C), demonstrating a significant difference between healthy control subjects and diabetic patients with no clinical neuropathy (HC group: −26.4 ± 0.7%; grade 0: −23.0 ± 1.0%; Dunnett t P < 0.05). Superexcitability demonstrated additional sequential abnormalities in patients with mild (grade 1: −22.7 ± 0.8%; Dunnett t P < 0.05) and moderate/severe neuropathy (grade 2/3: −20.8 ± 1.1%; Dunnett t P < 0.0005). Subexcitability also demonstrated stepwise changes between healthy control subjects and grade 1 and grade 2/3 patients (P < 0.05; HC group: 14.8 ± 0.8%; grade 1: 12.5 ± 0.6%; Dunnett t P < 0.05; grade 2/3: 10.9 ± 0.5%; Dunnett t P < 0.0005) (Fig. 2D).
There also were sequential changes in the TE profile, for example early significant changes in TEh (overshoot) (P < 0.0005) (Fig. 2E), suggesting that diabetic nerves illustrated abnormal accommodation to polarization. TEh (overshoot) also was significantly different in the grade 0 group compared with healthy control subjects (HC group: 17.5 ± 0.9%; grade 0: 14.4 ± 0.8%; Dunnett t P < 0.01) and progressively changed between grade 1 and grade 2/3 groups (grade 1: 13.4 ± 0.6%, Dunnett t P < 0.01; grade 2/3: 14.2 ± 0.6%, Dunnett t P > 0.005). Other TE parameters were decreased as the severity of neuropathy increased (TEd (10–20 ms; F[3,134] = 5.119, P < 0.005) (Fig. 2F). Taken together, these results demonstrated that significant early changes were present in both nodal (recovery cycle) and internodal (TE) properties of the diabetic axons.
Clinical correlations with axonal excitability parameters.
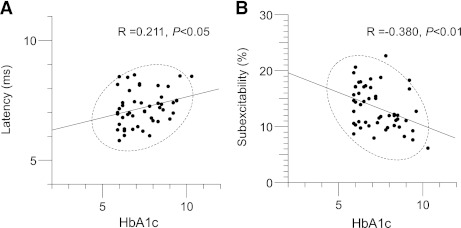
In patients without neuropathy, there were significant correlations between HbA1c level and latency (correlation coefficient = 0.274; P < 0.05) (Fig. 4A) and subexcitability (correlation coefficient = −0.328; P < 0.05) (Fig. 4B). These results suggest that early-stage neurophysiological changes in DWN patients may be functional rather than structural. As such, it is possible that strict glycemic control in diabetic patients without neuropathy may enable these excitability changes to be reversed. However, patients with neuropathy demonstrated different correlations, where eGFR correlated with superexcitability (correlation coefficient = −0.447; P < 0.01).
FIG. 4.
Correlations in diabetic patients without neuropathy (DWN group) between (A) HbA1c level and latency and (B) HbA1c level and subexcitability, demonstrating correlations between high HbA1c levels, increased latency, and reduced subexcitability.
DISCUSSION
The current study has established that nerve excitability techniques can detect early axonal dysfunction in diabetic patients with no clinical symptoms of neuropathy. These nerve excitability changes predate nerve conduction abnormalities in the early identification of neuropathy. A spectrum of nerve excitability changes were identified in patients with diabetes, with a consistent pattern of changes associated with the development of neuropathy, involving changes in threshold, rheobase, superexcitability, and TE. These results have revealed a progressive change in excitability parameters that correlated to neuropathy severity, suggesting that excitability testing may provide a biomarker in the early development and progression of diabetic neuropathy.
Nerve excitability changes in preclinical and established diabetic neuropathy.
Previous studies of nerve excitability in diabetes have focused on patients with severe neuropathy, a condition where there is neurophysiologically documented axonal loss with sustained functional disability (21,22,28). As such, therapeutic interventions directed at this stage are unlikely to have significant benefits because of the development of axonal loss. It is noteworthy that the current study indicates that nerve excitability studies are able to identify markers of axonal dysfunction in diabetic patients without neuropathy. These abnormalities progressively worsened as the neuropathy developed and became more severe, suggesting a continuous spectrum of nerve dysfunction, from early preclinical abnormalities to severe and established clinical neuropathy.
The prominent nerve excitability abnormalities identified in the current study, reduced accommodation reflected in the TE waveform and reductions in superexcitability and subexcitability, are largely consistent with the nerve excitability profile of diabetic neuropathy in previous studies (21–23,28). These markers are largely indicative of change in membrane potential (27) and have been suggested to be related to sodium/potassium ATPase (Na+/K+ pump) dysfunction (22,28–30). Reduction in Na+/K+ pump activity has been identified in a number of experimental models of diabetic neuropathy, as a result of hyperglycemia and other metabolic factors (9,31–33) and related to increased levels of sorbitol with consequent myo-inositol depletion (9,31) and reduction in protein kinase C activation (34). It is noteworthy that such Na+/K+ pump abnormalities may be correctable with C-peptide replacement, suggesting potential therapeutic avenues (35).
Early detection of axonal dysfunction in patients with diabetes is of extreme importance both in clinical practice and to assist in further defining the pathophysiological mechanisms underlying diabetic nerve degeneration. Two previous studies have identified excitability changes in patients with early diabetic neuropathy as compared with healthy control subjects but have failed to find significant abnormalities in asymptomatic patients (23,36). However, significant reduction in the single parameter of subexcitability was identified in patients without clinical neuropathy, and it is possible that the smaller patient numbers and differences in the classification of neuropathy may explain the lack of other significant findings (23).
The results from the current study suggest that early neurophysiological changes precede the development of clinical dysfunction and structural changes in peripheral axons. The long-term consequences of persistent Na+/ K+ pump dysfunction may lead to structural abnormalities and also may make the axon vulnerable to neurovascular and ischemic changes (37). Persistent changes in electrolyte concentration and membrane potential may precipitate a cascade of events resulting in axonal death as a result of reverse activation of Ca2+/Na+ exchanger (38,39). It is noteworthy that improved glycemic control has been previously demonstrated to produce significant improvements in excitability markers of Na+/K+ function in patients with diabetic neuropathy (21,28,29), suggesting that it may be possible to intervene earlier in the process of axonal degeneration to prevent neuropathy.
From functional to structural damage in diabetic axons.
Optimal control of blood glucose is known to be an important factor in preventing and reducing diabetic neuropathy and other complications (13–15,40). However, increasingly the role of neurovascular insufficiency and ischemic changes in the development of diabetic neuropathy have been indicated, and clearly, diabetic neuropathy is a multifactorial process (12). The current study identified correlations between HbA1c and excitability parameters in the DWN cohort, suggesting that early excitability changes in nerve function may be reversible with glycemic control. In contrast, correlations were demonstrated between eGFR and nerve excitability abnormalities in the DN cohort, suggesting that the causes of axonal dysfunction also may be related to microvascular changes. These findings have demonstrated different association between hyperglycemic and microvascular variables may exist before and after the onset of diabetic neuropathy. Therefore, different treatment strategies may be required at different stages to prevent progression of neuropathy.
Relevance to clinical implications.
Diabetic neuropathy is extremely complex and debilitating, and currently there is no effective treatment. Early detection of diabetic neuropathy and disease progression has been limited by a lack of sensitive assessment tools. However, nerve excitability techniques may show greater sensitivity to early axonal dysfunction than the traditional methods. Of importance, this present study has provided evidence of the significant correlation between HbA1c and nerve excitability parameters in a preneuropathic diabetic cohort, demonstrating the importance of glycemic control in reflecting changes in axonal function. This further emphasizes the necessity for clinicians to recognize diabetic patients at risk of neuropathy prior to the development of clinical symptoms. In addition, once patients have developed diabetic neuropathy, excitability parameters significantly correlated with eGFR, which may assist in explaining the close relationships of neuropathy and nephropathy in diabetic patients. Taken together, identification of early axonal changes will assist in the clinical trial setting to categorize diabetic patients who may benefit from treatment trials prior to the development of clinical symptoms and to monitor improvements in nerve function.
ACKNOWLEDGMENTS
J.-Y.S. and C.S.-Y.L. were supported by Wan Fang Hospital, Taipei Medical University, Taipei, Taiwan (grant no. 100swf13). A.V.K. was supported by a National Health and Medical Research Council of Australia Career Development Award (grant no. 568680). The Australian Brain Foundation and Royal Australasian College of Physicians GlaxoSmithKline Fellowship is gratefully acknowledged. S.B.P., N.K., and R.A. were supported by Australian Postgraduate Awards. No other potential conflicts of interest relevant to this article were reported.
J.-Y.S. and C.S.-Y.L. contributed to the study conception and design; data acquisition, analysis, and interpretation; and drafting, editing, and final approval of the manuscript. S.B.P. contributed to data acquisition, analysis, and interpretation and editing and final approval of the manuscript. Y.-T.L., N.K., and R.A. contributed to data acquisition and editing and final approval of the manuscript. A.V.K. contributed to the study conception and design and editing and final approval of the manuscript. J.-Y.S. and C.S.-Y.L. are the guarantors of this work and, as such, had full access to all the data in the study and take responsibility for the integrity of the data and the accuracy of the data analysis.
The authors thank Hannah Pickering (School of Medical Sciences, University of New South Wales) for her assistance during the study. The authors also thank Chen Yu Pan (supported by grants from the Center of Excellence for Clinical Trial and Research in Neuroscience, DOH101-TD-B-111-003, from the Department of Health, Taiwan) for her assistance.
Footnotes
See accompanying commentary, p. 1346.
REFERENCES
- 1.Danaei G, Finucane MM, Lu Y, et al. Global Burden of Metabolic Risk Factors of Chronic Diseases Collaborating Group (Blood Glucose) National, regional, and global trends in fasting plasma glucose and diabetes prevalence since 1980: systematic analysis of health examination surveys and epidemiological studies with 370 country-years and 2.7 million participants. Lancet 2011;378:31–40 [DOI] [PubMed] [Google Scholar]
- 2.Shaw JE, Sicree RA, Zimmet PZ. Global estimates of the prevalence of diabetes for 2010 and 2030. Diabetes Res Clin Pract 2010;87:4–14 [DOI] [PubMed] [Google Scholar]
- 3.Dyck PJ, Kratz KM, Karnes JL, et al. The prevalence by staged severity of various types of diabetic neuropathy, retinopathy, and nephropathy in a population-based cohort: the Rochester Diabetic Neuropathy Study. Neurology 1993;43:817–824 [DOI] [PubMed] [Google Scholar]
- 4.Pop-Busui R, Lu J, Lopes N, Jones TL, BARI 2D Investigators Prevalence of diabetic peripheral neuropathy and relation to glycemic control therapies at baseline in the BARI 2D cohort. J Peripher Nerv Syst 2009;14:1–13 [DOI] [PMC free article] [PubMed] [Google Scholar]
- 5.Shearer A, Scuffham P, Gordois A, Oglesby A. Predicted costs and outcomes from reduced vibration detection in people with diabetes in the U.S. Diabetes Care 2003;26:2305–2310 [DOI] [PubMed] [Google Scholar]
- 6.van Schie CH. Neuropathy: mobility and quality of life. Diabetes Metab Res Rev 2008;24(Suppl 1):S45–S51 [DOI] [PubMed] [Google Scholar]
- 7.Turns M. The diabetic foot: an overview of assessment and complications. Br J Nurs 2011;20:S19–S25 [DOI] [PubMed] [Google Scholar]
- 8.Khazai NB, Beck GR, Jr, Umpierrez GE. Diabetes and fractures: an overshadowed association. Curr Opin Endocrinol Diabetes Obes 2009;16:435–445 [DOI] [PMC free article] [PubMed] [Google Scholar]
- 9.Greene D. The pathogenesis and prevention of diabetic neuropathy and nephropathy. Metabolism 1988;37(Suppl. 1):25–29 [DOI] [PubMed] [Google Scholar]
- 10.Sundkvist G, Dahlin LB, Nilsson H, et al. Sorbitol and myo-inositol levels and morphology of sural nerve in relation to peripheral nerve function and clinical neuropathy in men with diabetic, impaired, and normal glucose tolerance. Diabet Med 2000;17:259–268 [DOI] [PubMed] [Google Scholar]
- 11.Pop-Busui R, Marinescu V, Van Huysen C, et al. Dissection of metabolic, vascular, and nerve conduction interrelationships in experimental diabetic neuropathy by cyclooxygenase inhibition and acetyl-L-carnitine administration. Diabetes 2002;51:2619–2628 [DOI] [PubMed] [Google Scholar]
- 12.Vincent AM, Callaghan BC, Smith AL, Feldman EL. Diabetic neuropathy: cellular mechanisms as therapeutic targets. Nat Rev Neurol 2011;7:573–583 [DOI] [PubMed] [Google Scholar]
- 13.Dyck PJ, Davies JL, Wilson DM, Service FJ, Melton LJ, 3rd, O’Brien PC. Risk factors for severity of diabetic polyneuropathy: intensive longitudinal assessment of the Rochester Diabetic Neuropathy Study cohort. Diabetes Care 1999;22:1479–1486 [DOI] [PubMed] [Google Scholar]
- 14.Monnier VM, Bautista O, Kenny D, et al. Skin collagen glycation, glycoxidation, and crosslinking are lower in subjects with long-term intensive versus conventional therapy of type 1 diabetes: relevance of glycated collagen products versus HbA1c as markers of diabetic complications. DCCT Skin Collagen Ancillary Study Group. Diabetes Control and Complications Trial. Diabetes 1999;48:870–880 [DOI] [PMC free article] [PubMed] [Google Scholar]
- 15.Genuth S. Insights from the diabetes control and complications trial/epidemiology of diabetes interventions and complications study on the use of intensive glycemic treatment to reduce the risk of complications of type 1 diabetes. Endocr Pract 2006;12(Suppl. 1):34–41 [DOI] [PubMed] [Google Scholar]
- 16.Dyck PJ, Overland CJ, Low PA, et al. Cl vs. NPhys Trial Investigators Signs and symptoms versus nerve conduction studies to diagnose diabetic sensorimotor polyneuropathy: Cl vs. NPhys trial. Muscle Nerve 2010;42:157–164 [DOI] [PMC free article] [PubMed] [Google Scholar]
- 17.Dyck PJ. Detection, characterization, and staging of polyneuropathy: assessed in diabetics. Muscle Nerve 1988;11:21–32 [DOI] [PubMed] [Google Scholar]
- 18.Sumner CJ, Sheth S, Griffin JW, Cornblath DR, Polydefkis M. The spectrum of neuropathy in diabetes and impaired glucose tolerance. Neurology 2003;60:108–111 [DOI] [PubMed] [Google Scholar]
- 19.Ziegler D, Low PA, Litchy WJ, et al. Efficacy and safety of antioxidant treatment with α-lipoic acid over 4 years in diabetic polyneuropathy: the NATHAN 1 trial. Diabetes Care 2011;34:2054–2060 [DOI] [PMC free article] [PubMed] [Google Scholar]
- 20.Kiernan MC, Burke D, Andersen KV, Bostock H. Multiple measures of axonal excitability: a new approach in clinical testing. Muscle Nerve 2000;23:399–409 [DOI] [PubMed] [Google Scholar]
- 21.Misawa S, Kuwabara S, Ogawara K, Kitano Y, Hattori T. Strength-duration properties and glycemic control in human diabetic motor nerves. Clin Neurophysiol 2005;116:254–258 [DOI] [PubMed] [Google Scholar]
- 22.Krishnan AV, Kiernan MC. Altered nerve excitability properties in established diabetic neuropathy. Brain 2005;128:1178–1187 [DOI] [PubMed] [Google Scholar]
- 23.Bae JS, Kim OK, Kim JM. Altered nerve excitability in subclinical/early diabetic neuropathy: evidence for early neurovascular process in diabetes mellitus? Diabetes Res Clin Pract 2011;91:183–189 [DOI] [PubMed] [Google Scholar]
- 24.Dyck PJ, Carter RE, Litchy WJ. Modeling nerve conduction criteria for diagnosis of diabetic polyneuropathy. Muscle Nerve 2011;44:340–345 [DOI] [PMC free article] [PubMed] [Google Scholar]
- 25.Cornblath DR, Chaudhry V, Carter K, et al. Total neuropathy score: validation and reliability study. Neurology 1999;53:1660–1664 [DOI] [PubMed] [Google Scholar]
- 26.Cavaletti G, Bogliun G, Marzorati L, et al. Grading of chemotherapy-induced peripheral neurotoxicity using the Total Neuropathy Scale. Neurology 2003;61:1297–1300 [DOI] [PubMed] [Google Scholar]
- 27.Kiernan MC, Bostock H. Effects of membrane polarization and ischaemia on the excitability properties of human motor axons. Brain 2000;123:2542–2551 [DOI] [PubMed] [Google Scholar]
- 28.Kuwabara S, Ogawara K, Harrori T, Suzuki Y, Hashimoto N. The acute effects of glycemic control on axonal excitability in human diabetic nerves. Intern Med 2002;41:360–365 [DOI] [PubMed] [Google Scholar]
- 29.Kitano Y, Kuwabara S, Misawa S, et al. The acute effects of glycemic control on axonal excitability in human diabetics. Ann Neurol 2004;56:462–467 [DOI] [PubMed] [Google Scholar]
- 30.Krishnan AV, Lin CS, Kiernan MC. Activity-dependent excitability changes suggest Na+/K+ pump dysfunction in diabetic neuropathy. Brain 2008;131:1209–1216 [DOI] [PubMed] [Google Scholar]
- 31.Greene DA, Lattimer SA. Impaired energy utilization and Na-K-ATPase in diabetic peripheral nerve. Am J Physiol 1984;246:E311–E318 [DOI] [PubMed] [Google Scholar]
- 32.Zarros A, Liapi C, Galanopoulou P, et al. Effects of adult-onset streptozotocin-induced diabetes on the rat brain antioxidant status and the activities of acetylcholinesterase, (Na(+),K (+))- and Mg(2+)-ATPase: modulation by L-cysteine. Metab Brain Dis 2009;24:337–348 [DOI] [PubMed] [Google Scholar]
- 33.Santini SA, Cotroneo P, Marra G, et al. NA+/K+ ATPase impairment and experimental glycation: the role of glucose autoxidation. Free Radic Res 1996;24:381–389 [DOI] [PubMed] [Google Scholar]
- 34.Zhu X, Eichberg J. 1,2-diacylglycerol content and its arachidonyl-containing molecular species are reduced in sciatic nerve from streptozotocin-induced diabetic rats. J Neurochem 1990;55:1087–1090 [DOI] [PubMed] [Google Scholar]
- 35.Zhang W, Yorek M, Pierson CR, Murakawa Y, Breidenbach A, Sima AA. Human C-peptide dose dependently prevents early neuropathy in the BB/Wor-rat. Int J Exp Diabetes Res 2001;2:187–193 [DOI] [PMC free article] [PubMed] [Google Scholar]
- 36.Erdoğan C, Yücel M, Değirmenci E, Öz O, Akgün H, Odabaşı Z. Nerve excitability properties in early preclinical diabetic neuropathy. Diabetes Res Clin Pract 2011;94:100–104 [DOI] [PubMed] [Google Scholar]
- 37.Takigawa T, Yasuda H, Terada M, et al. Increases in K+ conductance and Ca2+ influx under high glucose with suppressed Na+/K+-pump activity in rat myelinated nerve fibers. Neuroreport 2000;11:2547–2551 [DOI] [PubMed] [Google Scholar]
- 38.Lehning EJ, Doshi R, Isaksson N, Stys PK, LoPachin RM., Jr Mechanisms of injury-induced calcium entry into peripheral nerve myelinated axons: role of reverse sodium-calcium exchange. J Neurochem 1996;66:493–500 [DOI] [PubMed] [Google Scholar]
- 39.Krishnan AV, Lin CS, Park SB, Kiernan MC. Axonal ion channels from bench to bedside: a translational neuroscience perspective. Prog Neurobiol 2009;89:288–313 [DOI] [PubMed] [Google Scholar]
- 40.El-Salem K, Ammari F, Khader Y, Dhaimat O. Elevated glycosylated hemoglobin is associated with subclinical neuropathy in neurologically asymptomatic diabetic patients: a prospective study. J Clin Neurophysiol 2009;26:50–53 [DOI] [PubMed] [Google Scholar]


