

Abstract
Human immunodeficiency virus (HIV-1) depends upon host-encoded proteins to facilitate its replication while at the same time inhibiting critical components of innate and/or intrinsic immune response pathways. To characterize the host cell response on protein levels in CD4+ lymphoblastoid SUP-T1 cells after infection with HIV-1 strain LAI, we used mass spectrometry (MS)-based global quantitation with iTRAQ (isobaric tag for relative and absolute quantification). We found 266, 60 and 22 proteins differentially expressed (DE) (P-value ≤ 0.05) at 4, 8, and 20 hours post-infection (hpi), respectively, compared to time-matched mock-infected samples. The majority of changes in protein abundance occurred at an early stage of infection well before the de novo production of viral proteins. Functional analyses of these DE proteins showed enrichment in several biological pathways including protein synthesis, cell proliferation, and T-cell activation. Importantly, these early changes before the time of robust viral production have not been described before.
Keywords: Protein quantification, iTRAQ, HIV-1, T-cells, LC-MS/MS, Ribosomal proteins
Introduction
During the 30-year history of Acquired Immunodeficiency Syndrome (AIDS), more than 60 million people have been infected with its causative agent, HIV-1, and more than 25 million people have died (UNAIDS, 2009). While treatment options exist for AIDS, it still remains a significant challenge worldwide with an estimated 2.6 million people newly infected every year and 1.8 million people succumbing to the disease (UNAIDS, 2009). Therefore, research in HIV biology is of critical importance for development of new antiviral treatment modalities.
Among the hallmarks of HIV-1 infection is disruption of the adaptive immune system caused by gradual depletion of CD4+ T cells (Gruters et al., 1990) leading to a slow decline in immune functions, with eventual failure to control normally tolerated pathogens. Like all viruses, HIV-1 depends upon the host cellular machinery for its survival and replication, orchestrated by complex interactions between host and viral biomolecules (Bushman et al., 2009; Jager et al., 2012; MacPherson et al., 2010; Pinney et al., 2009). These interactions modulate host cell processes to facilitate expression of viral structural proteins, assembly of progeny virions and their release. Moreover, the virus has evolved ways to inhibit the antiviral host cell response by interacting with critical components of innate and/or intrinsic immune response pathways (Malim and Emerman, 2008). While the transcriptional processes affected by viral infection have been extensively studied, the knowledge of protein level changes is relatively limited. Recent advances in more sensitive and high throughput mass spectrometry(MS)-based methods, and bioinformatics tools has allowed studying the complex and dynamic range of the cellular proteome (Aebersold and Mann, 2003; Borchers and Tomer, 1999; Han, Aslanian, and Yates, 2008; Melendez et al., 2011). Quantitative MS-based approaches have been recently implemented to study changes in host protein abundance in T-cells upon HIV-infection (Chan et al., 2007; Chan et al., 2009; Ringrose et al., 2008) or in the presence of viral protein expressed from a plasmid (Coiras et al., 2006). These previous studies showed that the majority of host protein abundance changes occurred at the time when intracellular viral production reached its maximum while the levels of only a few proteins have been shown to change early after HIV infection. It is possible that potentially important but subtle changes in protein levels as early as 4 hpi were not measurable due to lower specificity, sensitivity, and accuracy of the previously used fluorescence two-dimensional differential in-gel electrophoresis (2D-DIGE) (Ringrose et al., 2008) and proteolytic 18O labeling quantitation methods (Chan et al., 2007).
Our study is an effort to fill this gap in knowledge of very early changes in host proteins after HIV infection. We used the isobaric tag for relative and absolute quantitation (iTRAQ) method suitable for comparative analysis of complex sample mixtures with high precision (Ross et al., 2004; Wolf-Yadlin et al., 2007; Wu et al., 2006) to measure global protein abundance in the CD4+ T cell line SUP-T1, at 4, 8, and 20 hours post infection (hpi) with HIV-1 (strain LAI). Our new data revealed temporal changes in host proteome, most prominently in the ribosomal proteins and translational machinery starting as early as 4 hpi, suggesting that HIV might disrupt cellular functions of the infected T-cell even before the time of peak intracellular viral protein and virion production.
Materials and Methods
Cells, virus, and infection
All procedures involving infectious HIV-1 were carried out in biosafety level (BSL) 2 lab with BSL 3 practices in accordance with the University of Washington biological safety guidelines (The University of Washington Environment Health and Safety). The T lymphoblastic leukemia cell line SUP-T1 was obtained from American Type Cell Culture collection (Manassas, VA; CRL-1942) and cultured in RPMI 1640 supplemented with penicillin (100 U/ml), streptomycin (100 μg/ml), GlutaMAX-I (Invitrogen, Carlsbad, CA) and 10% Fetal Bovine Serum (HyClone, Logan, UT). HIV LAI strain was obtained from NIH AIDS Research & Reference Reagent Program (Germantown, MD) and propagated in SUP-T1 cells. Viral titers were measured in U373-MAGI-CXCR4CEM cells obtained through the AIDS Research and Reference Reagent Program following a protocol by M. Emerman (Vodicka et al., 1997). Synchronous infections of SUP-T1 cells were carried out by suspending cells in a concentrated inoculum with a proportion of virus corresponding to a multiplicity of infection (MOI) 2.5 for 1 hour at 37°C in an incubator with 5% CO2 atmosphere. After this 1 hour period of virus attachment and internalization, unattached virions were removed by washing the cells with an excess of fresh media and then plating the washed cells in fresh media at a density of 1×10⁶ cells/mL. Infections were performed in triplicate. The infectious dose (MOI 2.5) was optimized to reach near 100% of cell infectivity. Infected cells were visualized by immunofluorescence assay with rabbit HIV-1SF2 HIV p24 antiserum kindly provided by BioMolecular Technologies through the AIDS Research and Reference Reagent Program. HIV-1 mRNA relative abundance was measured using Taqman assay with a standard curve to ensure linearity of the assay (forward primer HXB2-Gag-F 5′-CAA GCA GCC ATG CAA ATG TT-3′, reverse primer SK431-B 5′-TGC TAT GTC ACT TCC CCT TGG TTC TCT-3′ and probe HXB2-gag 5′-FAM AAA GAG ACC ATC AAT GAG GAA GCT GCA GAA 3′-TAMRA).
Protein extraction, digestion and iTRAQ labeling
For each condition, 5 million SUP-T1 cells were collected by centrifugation at 1000 × g for 5 minutes at 4°C. Cell pellets were washed twice with cold Dulbeco’s phosphate buffered saline then snap frozen and stored at −80°C. Cell pellets were resuspended in 0.3 ml of urea buffer (8M urea in 50 mM ammonium bicarbonate, pH 7.8) and denatured at room temperature for 1 hour with agitation at 1000 rpm. The resulting suspensions were sonicated in a chilled water bath cup-horn (Qsonica, Newtown, CT) at 35% amplitude for 3 cycles (1 minute pulse followed by 2 minutes on ice). Residual cell debris was removed by centrifugation at 16,000 × g for 10 minutes at 4°C, and the supernatant was collected. Total protein concentration was determined with Bio-Rad Protein Assay Dye Reagent using manufacturer’s instructions (Bio-Rad, Hercules, CA).
All steps were performed at room temperature unless otherwise noted. Protein samples (245 μg) were reduced with 5 mM dithiothreitol for 1 hour, then alkylated with 15mM iodoacetamide for 30 min in the dark. Samples were diluted 8-fold with 50 mM ammonium bicarbonate (pH 7.8), then digested with Sequencing Grade Modified trypsin (Promega, Madison, WI) at a ratio of 1:50 (trypsin to protein) for 16 hours at 37°C. Peptides were desalted and concentrated using Discovery C18 SPE cartridges (Supelco, Bellefonte, PA) as per the manufacturer’s recommendations then dried by vacuum centrifugation and stored at −80°C.
We checked the efficiency of trypsinization of ribosomal proteins in HIV-infected and mock-infected protein extracts to rule out the possibility that the difference in the structural stability of the ribosomes in the HIV-infected cells might have affected the tryptic digestion, thus resulting in apparent differences in abundance. To investigate this possibility, we looked at the percentages of missed cleavages in ribosomal peptides. We did not find any bias toward any biological condition in our study. Therefore, we believe that difference in trypsinization as a potential source of variability did not contribute to the observed differences in abundance (see Results section).
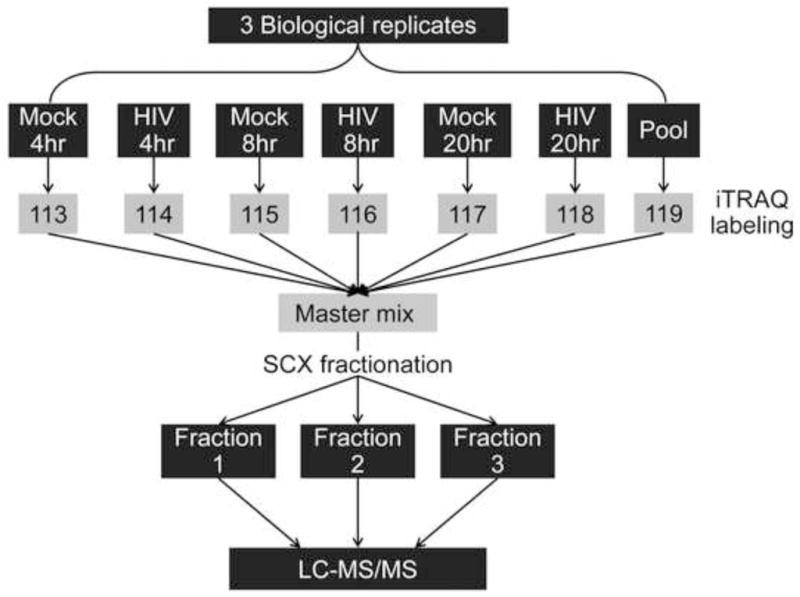
iTRAQ labeling was carried out using iTRAQ Reagents 8-plex kit (AB Sciex, Foster City, CA) as recommended in the manufacturer’s protocol. Fig. 1 shows a diagram of the peptide labeling scheme used in this study. Briefly, peptide pellets were resuspended in 3% acetonitrile and peptide concentration was determined by BCA assay (Pierce, Rockford, IL). For each sample, an equal peptide amount (43 μg) was aliquoted then dried by vacuum centrifugation. Peptide pellets were suspended in 0.5 M triethylammonium bicarbonate (pH 8.5) and labeled with 1 unit of the appropriate iTRAQ labeling reagents (113 through 119) for 2 hours (Fig. 1). Additionally, we created a ‘pool’ sample by mixing ~7 μg of peptides from the 18 samples (3 HIV-infected and 3 time-matched mock at 4, 8, and 20 hpi) and labeled it with an iTRAQ label 119 (Suppl. Table S1) for use as a common reference across individual iTRAQ multiplex experiments for subsequent normalization. Labeling reactions were then combined and the iTRAQ multiplex sample volume was reduced by vacuum centrifugation. Each iTRAQ multiplex experiment was fractionated offline using Discovery Strong Cation Exchange (SCX) SPE cartridges (Supelco) as per manufacturer’s recommendations with increasing concentrations (300, 400, 500, 600, and 1000 mM KCl, in 25% acetonitrile, 10 mM potassium phosphate monobasic, pH 3) of potassium chloride buffer. Fractions 300 mM and, 400 mM were combined into one fraction, and fractions 600 mM and 1 M were combined into a second fraction before proceeding with the desalting step. The third fraction with 500 mM KCl was not combined with the other fractions as it had the highest amount of peptide concentration, as determined by the BCA assay. Finally, the three KCl fractions were desalted using Discovery C18 SPE cartridges.
Figure 1.
LC-MS/MS data acquisition
Online peptide separation followed by mass spectrometric analysis was performed on a 1D-nanoLC system (nanoAcquity UPLC system, Waters Corp., Milford, MA, USA) coupled to a LTQ Orbitrap Velos mass spectrometer (Thermo Fisher Scientific, CA, USA), equipped with a high energy collision cell. Individual C-18 purified SCX fractions containing the iTRAQ labeled peptides were injected (4 μg/5 μL injection volume) in duplicates and captured onto a trap column packed with reverse phase beads (Symmetry®, C18, 5 μm particle size, 100 Å pore size, 5 cm packing length, 150 μm column i.d.). Peptide separation was achieved on an analytical nano-column (Symmetry®, C18, 5 μm particle size, 100 Å pore size, 15 cm packing length, 75 μm column i.d.) using a gradient from 3 to 80% of solvent B in A over 210 minutes (Solvent A: 100% water, 0.1 % Formic acid (FA); Solvent B: 97% ACN/3% Water, 0.1% FA) at a flow rate of 200 nL/min. The effluent from the HPLC column was directly electrosprayed into the mass spectrometer.
The mass spectrometer was operated in data-dependent mode to automatically switch between MS and MS/MS acquisitions. The Top 10 method was used in the data-dependent mode where each full-scan MS (from m/z 300–2000) was acquired in the Orbitrap analyzer (resolution = 60,000), followed by first high energy collision induced dissociation (HCD) MS/MS (from m/z 100–1700) and a subsequent low collision induced dissociation (CID) MS/MS scan of the top 10 most intense precursor ions with a charge states ≥ 2. The HCD MS/MS scans were acquired using the Orbitrap system (resolution = 30,000) at normalized collision energy of 75% and the low-energy CID MS/MS scans were scanned in a low-pressure ion trap with a normalized collision energy of 35%. The ion selection threshold was set to 5,000 counts for HCD, and 500 counts for CID scans. Precursor ion isolation width of 1.5 was used for the MS/MS scans and the maximum allowed ion accumulation times were set to 500 ms for full scans and 250 ms for HCD, and 25 ms for CID scans.
The standard mass spectrometer tune method settings were as follows: Spray voltage, 2.1 kV; No sheath and auxiliary gas flow; heated capillary temperature, 325 °C; Automatic Gain Control (AGC) enabled. All samples were analyzed by LC-MS/MS in duplicates, and an equimolar (500 fmol/μL) binary peptide standard mix of angiotensin I and neurotensin (Sigma-Aldrich, St. Louis, MO, USA) was used between the sample runs to check the run-to-run reproducibility of the LC-MS system.
Protein identification
Raw MS/MS data files were processed by Tagtraq (The University of Washington’s Proteomic Resource Facility(UWPR)), which merges HCD and CID MS/MS scans for each precursor ion and generates merged .mgf output files for every precursor ion detected by the mass spectrum. The merged .mgf files were imported into the ‘Trans-Proteomic Pipeline’ (TPP) (Deutsch et al., 2010) for protein identification using the X!Tandem search engine. The protein search was performed against a user defined database consisting of 35,284 human proteins (Original source: Uniprot_Human version, released on 2011-03-08), and 123 viral proteins containing protein sequences of HIV strains LAI, HXB2, BRU, and IIIB (obtained from GeneBank®, accessed in October 2010)(Benson et al., 2011). The following variable modifications were used: Oxidation of met (+ 15.994915 Da), carbamidomethylation of Cysteine (+57.021464 Da), and + 304.2 Da at K due to iTRAQ 8-plex labeling of N-termini or lysine-side chains of tryptic peptides. All identified peptides (and corresponding proteins) passing with error rates ≤ 5% and with corresponding PeptideProphet (Keller et al., 2002) probabilities ≥ 0.70 were retained. A total of 9749 unique peptides corresponding to 2847 unique proteins were identified across all the samples.
Protein quantitation by iTRAQ
Protein quantification based on the iTRAQ labels was performed with Libra software (Pedrioli et al., 2006) embedded in TPP. The intensity of label 119 from the pool sample was used to calculate the relative intensities of the other reporter ions (iTRAQ labels) in the 8-plex. We checked the between labels intensity variability by calculating correlation between two reporter ions of peptides identified in all three biological replicates. A tight overall correlation between each pair of iTRAQ ions was found (R2=0.99) (e.g., see correlation plot for 113 and 114 ions, Suppl. Fig. S1). The Libra normalized log10 intensity ratios for each sample (each label) were normalized to the median of 0 under the assumption that the majority of proteins do not change in abundance. We checked the data quality of the iTRAQ quantitation datasets for 4, 8, and 20 hpi, by plotting scatter plots of intensities of iTRAQ labels for mock-infected samples as well as HIV-infected samples at 4 hpi vs 8 hpi (113 vs 115; 114 vs 116), 4 hpi vs 20 hpi (113 vs 117; 114 vs 118) and 8 hpi vs 20 hpi (115 vs 117; 116 vs 118) (Suppl. Figure S2). A good overall correlation (R2= 0.98–0.99) between different conditions at different time points suggested that the iTRAQ data quality was comparable between the samples, and no bias was introduced by the normalization procedure. In order to maintain high quality data, all proteins with single peptide-peptide based identifications were excluded from further analysis.
Two-sample unequal variance t-test was performed to derive lists of differentially abundant proteins between infected and mock-infected samples at each time point. To correct for multiple hypothesis testing, we applied Benjamini-Hochberg (BH) P-value correction. The final list of differentially expressed (DE) proteins corresponded to the adjusted P-value ≤ 0.05. All computational data processing and statistical tests were performed using custom scripts in Perl and MATLAB, using the statistical toolbox (MathWorks, Inc., Natick, MA).
The accuracy of identification of 15 of the DE proteins that were identified by X!Tandem search engine with only 2 unique peptides were confirmed by manual inspection of the tandem mass spectra of the peptide ions assigned to these proteins. A list of all possible fragment ions (b-ions and y-ions) of each peptide was generated by performing in silico fragmentation of each peptides of interest using an online ‘peptide fragmentation generator’ tool (The University of Washington Proteomics Resource). The tandem mass spectrum of the identified peptide was then manually checked to confirm the correct assignment of the b-ions and y-ions within the mass accuracy of ± 0.5 Dalton (Da) (Suppl. Fig. S7). The MS1 mass spectra of these peptide precursor ion peaks were also inspected for background noise within an isolation window of ± 1.5 m/z around the precursor ion, as contaminant precursor ions could affect the iTRAQ quantitation.
Protein functional pathway analysis
We used DAVID (the Database for Annotation, Visualization and Integrated Discovery, v6.7, NCBI) to determine the molecular functions and subcellular localization of the identified 2847 total proteins. Functional and network analysis DE proteins was performed with Ingenuity Pathway Analysis (IPA)(Ingenuity® Systems). We used the 2847 total proteins as our reference dataset for the IPA analysis.
Results and Discussion
Here we describe changes in the global proteome of the T lymphocyte cell line CD4+ SUP-T1 during the course of HIV-1 infection. We used an MOI of 2.5, which resulted in close to 100% infection rate and collected samples in triplicate at 4, 8 and 20 hpi for both infected and time-matched mock infection. De novo viral RNA expression in this system was not detected by real-time PCR until 12 hpi, after which there was a rapid increase in expression between 12 to 24 hours hpi (Fig. 2a). This trend closely matched the detection of the HIV Gag protein (Fig. 2b). Gag was only detected at close to background levels at 4 and 8 hpi, followed by a significant increase by 20 hpi. Therefore, we established that the early 4 and 8 hpi time points are associated with minimal de novo production of viral proteins.
Figure 2.

Distribution of subcellular locations and functions of the detected T-cell proteome
We detected 2847 proteins, which are distributed among main subcellular compartments as shown in Suppl. Fig. S4. Public annotations indicate that 51% of the detected proteins are nuclear, while cytosolic proteins accounted only for 5% of the total detected proteome. The remaining 45% of proteins were the constituents of mitochondrion, cytoskeleton, and plasma membrane. Such overrepresentation of nuclear proteins is expected for lymphocytes such as SUP-T1 that have small amounts of cytosol.
Out of all detected peptides 22% corresponded to the highly abundant ribosomal and other cellular housekeeping proteins (5% and 17%, respectively), while the remaining 78% corresponded to proteins of relatively lower abundance. The ability to detect the latter proteins was due to the sample fractionation steps prior the MS analysis steps (see Methods), as well as the result of fast scan rate (~ 1 Hz) of the mass spectrometer, which increased the chance of low abundant peptide ions to get identified in the presence of the peptide ions of highly abundant proteins.
Temporal quantitative changes in host proteome after HIV infection
We have confidently quantified by MS-based iTRAQ analysis 1448 out of 2847 detected cellular proteins (with 2 or more unique peptides). A t-test on protein level (see Methods) was performed for each time point individually to derive proteins differentially expressed between HIV-infected and mock-infected SupT1 cells (results are shown in Table 1). We further filtered statistically significant proteins with the adjusted P-value < 0.05 by selecting a fold-change (FC) cutoff of ±1.4 (infected/mock). This FC cutoff was selected based on the estimation of variation in protein abundance ratios in mock-infected samples at 4 and 8 hpi based on the assumption that no biologically significant changes are expected for the mock samples within this 4 hour window (Fig. 3). As shown in the histogram in Fig. 3, 7.4% of such ratios showed FC of 1.4 or more and 2.6% of ratio showed FC of 1.4 or less. Therefore, an overall expectation of finding fold changes +/− 1.4 due to technical variation between cell culture replicates is ~ 10%. We used this FC cutoff and applied a t-test filter (P ≤ 0.05, B-H adjusted) to derive 348 statistically significant proteins, which showed differential abundance in at least one time point (Table 1). Surprisingly, most of the detected DE proteins (266/348) exhibited changes at 4 hpi as compared to the 60 DE proteins at 8 hpi, and 22 DE proteins at 20 hpi. It is unlikely that the low number of statistically significant proteins observed 20 hpi is due to higher variability between triplicates or in the ratios for that time point as the histogram of all observed protein ratios does not reflect an increase in variability (Suppl. Figure S3). The overlap of the 348 DE proteins (P ≤ 0.05, FC ≥ 1.4) at the three time points is shown in the Venn diagram in Fig. 4a. Only 25 DE proteins are shared between the early time points (4 and 8 hpi), while only one protein (UTP14A, U3 small nucleolar RNA-associated protein 14) overlapped between 8 and 20 hpi DE lists. The small overlap between the early time points vs. the late time point suggests that completely different sets of host proteins or processes were perturbed in these times.
Table 1.
Differentially expressed (DE) cellular proteins in HIV-infected CD4+ SUP-T1 cells.
| No. of DEa proteins at | |||
|---|---|---|---|
| 4 hpi | 8 hpi | 20 hpi | |
| Up-regulated proteins | |||
| FCb≥ 1.4 | 117 | 26 | 4 |
| FC ≥ 2 | 18 | 2 | 0 |
| Down-regulated proteins | |||
| FC ≥ 1.4 | 149 | 34 | 18 |
| FC ≥ 2 | 55 | 7 | 7 |
Differentially expressed (DE) proteins are the proteins that showed abundances changes in the HIV-infected cells as compared to their time-matched mocks with a nominal(P-value < 0.05)
FC, fold change.
Figure 3.

Figure 4.

A global view of the protein abundance changes of the 348 DE proteins is shown in Fig. 4b. The directionality of abundance changes for 22 of the 25 overlapping DE proteins between 4 and 8 hpi remained consistent at these time points (4b). It is noteworthy that we observed down regulation of HIV-1 dependency factor Tat specific factor 1 (HTATSF1) implicated by some investigators in regulation of Tat transactivation in viral RNA transcription (Brass et al., 2008; Zhou and Sharp, 1996) and in general regulation of cellular mRNA transcription and splicing (Miller et al., 2011). Two additional commonly changed (upregulated) proteins in both early time points, namely GPI and SLC3A2 have been shown to interact with HIV-1 proteins, suggesting that the levels of host interactors are possibly manipulated early on in the course of HIV infection.
We further investigated what key cellular functions might be associated with the protein abundance changes of 348 DE proteins. We used IPA to perform functional analysis using 2847 detected proteins as a reference list. The results are summarized in Fig. 5. Different cellular functions were enriched at three time points and the enriched functional categories at 4 hpi, namely, protein synthesis, cell proliferation, DNA recombination, repair and maintenance were associated with the most DE proteins, in contrast to the categories enriched at 8 and 20 hpi. Taken together, this suggests that the infected T cell shows sign of brief cell protein biogenesis and proliferation and maintenance which then subsides with the progression of infection.
Figure 5.

Proteins associated with protein synthesis increased in abundance at 4 hpi
Four hours after infection marks a point in HIV-1 life cycle when internalized virions have undergone uncoating, reverse transcription of genomic RNA, translocation of preintegration complexes to the nucleus and integration of viral cDNA in host cell genome. Attendant to these processes is the cellular response to binding and internalization of virus particles as well as changes triggered by interactions of the internalized virus proteins with their cellular binding partners. Consistent with this notion, we found protein synthesis as the most enriched category (P-value 1.12E-12) with 52 DE proteins at 4 hpi, while at 20 hpi 9 DE proteins were associated with this category (P-value 5.55E-5) (Fig. 5c). We found only 4 DE proteins associated with protein synthesis (ETF1, SLC7A1, RPS5, TFRC) commonly changing at 4 and 20 hpi (Suppl. Table S2). Notably, eukaryotic translation termination factor 1 (ETF1) was strongly downregulated early after infection, and remained still significantly downregulated at the 20 hpi time point, unlike most other proteins involved in protein synthesis (discussed below). These proteins are first upregulated at 4 hpi, which is followed by downregulation or no change at late time point. ETF1 participates in protein synthesis as a polypeptide chain release factor directing termination of mRNA translation from the stop codons, and also in nonsense-mediated decay of prematurely terminated mRNAs. Membrane proteins solute carrier family 7 (cationic amino acid transporter), member 1 (SLC7A1) and transferrin receptor (TFRC) were noted as significantly downregulated in both early and late time points (SLC7A1) or up- and downregulated, respectively. Decrease of TFRC (CD71) abundance during HIV-1 infection has been described previously (Madrid et al., 2005) and associated with nef-induced alteration of trafficking of surface proteins involved in adaptive immunity and HIV-1.
About 69% of the proteins (36 out of 52) involved in protein translation at 4 hpi were ribosomal, eukaryotic translation elongation, or initiation factors that showed increased abundances in the virus-infected cells at 4 hpi (Suppl. Table S2). As summarized in Fig. 6a, differential protein abundance was found for the components of both ribosomal subunits. With few exceptions, these same proteins showed a decrease or no change in abundance at 8 and 20 hpi (Figures 6b–c; for complete list of proteins, see supplemental Table S2). With the exception of 4 hpi, protein synthesis was down-regulated over the course of the infection as one might expect from previous reports (Chan et al., 2009). However, it is very surprising that protein synthesis was elevated at 4 hpi, as judged by DE proteins. Ribosomal proteins, among many other housekeeping (HK) proteins, are commonly regarded as constitutively expressed in eukaryotic cells, raising a concern that the observed effect at 4 hpi was a possible artifact introduced by normalization. To eliminate this possibility, we examined the expression levels of the other known HK proteins in our dataset. We used a list of 566 human HK genes (Eisenberg and Levanon, 2003) (http://www.compugen.co.il/supp_info/Housekeeping_genes.html)), that includes genes for 40 ribosomal proteins and 7 translation and elongation factors Excluding the ribosomal and eukaryotic translation initiation and elongation proteins, 220 HK proteins were detected in our dataset. The fold change ratios of these proteins (HIV: Mock) were calculated for 4 hpi data. We found that 97% of HK proteins (214/220) did not show significant change in abundance (FC ≥1.4) (Suppl. Figure S5). This analysis suggests that the observed increase in abundance of the ribosomal and translation related proteins is not a methodological artifact, as we would anticipate this impacting all the housekeeping proteins.
Figure 6.

Such abundance changes in the protein synthesis machinery have not been previously reported in HIV-1-infected CD+ T cells, especially at such an early time point. Infection of T cells by HIV-1 has been previously associated with reduced transcript levels for several elongation initiation factors, ribonucleoprotein complex/ribosome assembly and protein synthesis at later (24 hpi) time points (van ‘t Wout et al., 2003). Chan et. al described similar changes in the ribosomal proteins of HIV-1 infected primary T-cells at 8 hpi, albeit with far fewer identified proteins (Chan et al., 2009).
The upregulation of ribosomal proteins at 4 hpi, may indicate post-transcriptional regulation. mRNAs encoding ribosomal proteins, contain 5′UTR terminal Oligopyrimidine (TOP) tracts that regulate their translational activity (Levy et al., 1991) through interaction with a number of RNA-binding proteins, including RPS6 (Hagner et al., 2011). Up-regulation of RPS6 is associated with protein synthesis and cell proliferation, during which this ribosomal protein is activated by phosphorylation by 40S ribosomal protein S6 kinase (p70-S6K) (Meyuhas, 2008). p70-S6K is in turn activated as a consequence of a variety of signal transduction cascades such as Akt2 and mTOR but it has been also observed that Env gp41can activate the p70-S6K subunit RBS6KB1(Barcova et al., 1999), although this latter data was not explicitly derive from an actual infection model. It is therefore conceivable that HIV-1 elicits early proliferative response target cells, with many components driven by post-transcriptional regulation.
We observed enrichment of protein synthesis functional category also at 20 hpi, however it pertained to a different set of 9 DE proteins, and except for a protein product of gene RSL1D1 (ribosomal protein L1 domain), abundances of these proteins were decreased (Suppl. Figure S6). Interestingly, RSL1D1 protein didn’t change significantly at early hours (4 and 8 hpi) of infection but showed 1.6- fold increase at 20 hpi. This protein has been showed to be involved in protein localization of nucleolar proteins (Meng, Yasumoto, and Tsai, 2006) as well as it has been identified in siRNA screen as a dependency factors for HIV-1 infection (Brass et al., 2008).
Changes in Cell proliferation and DNA repair, recombination and maintenance
Increased abundance of proteins involved in ribosome biogenesis and in protein synthesis typically reflects a cellular state with higher biosynthetic demand, such as in proliferating cells (Montanaro, Trere, and Derenzini, 2008). As described above, cell proliferation is among the top functional categories (P-value 7.43E-3) at 4 hpi with 54 DE proteins (Suppl. Table S3), of which a slight majority was upregulated (35 vs. 24 downregulated; with a few exceptions, these proteins did not show significant changes at 8 and 20 hpi). While one of the hallmarks of HIV-1 infection is cell death by apoptosis, it is possible that the initial response to the virus binding to the cell surface is proliferative. The crosslinking of the HIV-1 envelope protein and CD4 and CXCR4 virus receptor and co-receptor may trigger some aspect of TCR (T cell receptor) signaling, providing a proliferative signal to the recipient T cells that are not actively proliferating under physiological conditions (Kornfeld et al., 1988; Misse et al., 1999). It is therefore conceivable that interaction of the viral envelope protein with CD4 receptor primes CD4+ SUP-T1 cells for a proliferative response that may activate biosynthesis of the translation apparatus, however, this response is brief and ultimately overshadowed by viral cytotoxicity leading to apoptosis and necrosis.
Several proteins involved in DNA repair and recombination process changed in abundance at 4 hpi (16 DE proteins, Fig. 7a) and 8 hpi (10 DE proteins, Fig. 7b), suggesting that this category was highly affected early during the infection (Suppl. Table S4). The two sets of DE proteins at 4 and 8 hpi had a single protein in common, ubiquitin thioesterase (OTUB1). This deubiquitinating enzyme suppresses RNF168-dependent ubiquitination of the DNA double-strand breaks by binding ubiquitin-conjugating enzyme E2N (UBE2N) (Nakada et al., 2010). We identified OTUB1 and UBE2N changing in opposite directions at 4 hpi, where OTUB1 was significantly downregulated and UBE2N was upregulated. Functionally, this would allow more chromatin ubiquitination at double-stranded breaks, leading to more efficient localization of the genome repair machinery, suggesting there is initial attempt of the infected cells to control the DNA damage due to infection. However at 8 hpi, the deubiquitinating enzyme OTUB1 was upregulated (1.4-fold), while the abundance level of UBE2N returned to the level observed in mock-infected cells, and by 20 hpi, both proteins were unchanged compared to their levels in the time-matched mocks. As a consequence, the initial DNA damage response has declined, as the levels of UBE2N and other proteins involved in DNA repair and mitosis checkpoint activation returned to those observed in time-matched mocks (Fig. 7).
Figure 7.

T-cell functions affected throughout the course of the infection
At the late time point (20 hpi) we found that almost 32% of the 22 DE proteins were enriched for activation-induced cell death of T lymphocytes (P-value 2.75E-5) (Fig. 5c). Proteins involved in T-cell activation and cell-mediated immune response (LCK, SPN, RAC2, PARP1, HSPD1, HMGB1) were altered at 20 hpi, and some at 4 hpi (Suppl. Table S5). T-cell activation-related proteins LCK (Lymphocyte specific protein kinase), SPN (sialophorin), and RAC2 (ras-related C3 botulinum toxin substrate 2) were down-regulated at 20 hpi. Down-regulation of LCK on protein level is consistent with the previously observed transcriptional level changes of this protein (Chang et al., 2011). SPN protein which has been reported to participate in T-cell migration (Cannon et al., 2011) remained down-regulated at early and later time points, while RAC2, which is implicated in T-cell activation (Ramaswamy et al., 2007) and proliferative response (Bustelo, 2002) was initially up-regulated but then decreased at 20 hpi. Heat shock protein 60 (HSPD1) has been shown to play a role in the chemotactic migration of T cells in blood (Zanin-Zhorov et al., 2003) as well as in binding with HIV gp41 membrane protein (Speth et al., 1999). The later interaction of HSPD1 with the HIV membrane protein is more relevant in our study, where the increased levels of this protein at 4 hpi potentially help the entry of the virus. HMGB1, a nuclear protein which is known to play a significant role in DNA architecture (Bonaldi et al., 2003) has also been implicated in cell signaling (Wang et al., 1999). Overall, the differential expression of proteins related to T-cell activation upon HIV infection indicates that HIV-1 infection elicited protein abundance changes that may lead to suppression of T-cell immune function during the entire course of infection, and not just at the later time point.
Differentially regulated host proteins with known viral-host protein interactions
We cross-examined our list of 348 DE proteins with those known to interact with HIV proteins by searching against previously published HIV-human protein-protein interactions databases, such as the recently developed ‘Human Immunodeficiency Virus Type 1 (HIV-1), Human Protein Interaction database’ (HHPID) at NCBI, (Fu et al., 2009; Pinney et al., 2009; Ptak et al., 2008) and the recently published database by Jäger et. al.(Jager et al., 2012). HHPID contained1439 unique proteins and over 2500 unique HIV-human protein-protein interactions (PPIs), while Jäger’s database comprised of 242 unique proteins with 497 interactions. We found our DE set of proteins enriched in HIV interactors with 65 (P-value ≤ 0.015) and 26 (P-value ≤ 0.083) matched with HHPID and Jäger’s databases, respectively, with 4 DE proteins, namely KARS, RANBP1, PSMB6, VPRBP, overlapping between the two sets (Table 2; marked by asterisk). Of these 4 DE proteins, levels of KARS were down regulated from 8 hpi through 20 hpi, while the remaining three proteins were only changed at 4 hpi. Notably, we found that the abundance of karyopherin alpha 3 (importin alpha 4) transiently decreased at 4 hpi. The role of this protein in the nuclear import of HIV pre-integration complex via its interaction with incoming virion matrix protein has been reported (Bukrinsky and Haffar, 1998), and the reduced abundance would be expected to mitigate the extent of incorporation of viral genome. Transferrin receptor CD71 showed a transient increase at 4 hpi, HIV Nef protein (also present in viral particles) disrupts the endosomal trafficking of CD71 to enhance Nef-mediated viral infectivity (Madrid et al., 2005), and the disruption of CD71 degradation in the endosome could result in the increased abundance we observe. It is conceivable that interactions between the viral and cellular proteins modulate the quantity of the latter and thus promote viral replication in infected SUP-T1 cells.
Table 2.
List of the T-cell DE proteins with known HIV-1 protein interactions was obtained by comparing the DE proteins from our dataset with the two published HIV-human protein-protein interaction databases (HHPID at NCBI and Jäger’s database). Four DE proteins that were found in both databases are marked with an asterisk.
| Cellular Protein | Gene Symbol | HIV protein | Log2 (FC) |
|---|---|---|---|
| 4 hpi | |||
| actin, beta | ACTB | Tat | 0.66 |
| X-ray repair complementing defective repair in Chinese hamster cells 6 | XRCC6 | Tat, Vif | 0.63 |
| X-ray repair complementing defective repair in Chinese hamster cells 5 | XRCC5 | Tat | 0.50 |
| RAN binding protein 1* | RANBP1 | Vpu, Rev | 0.73 |
| lactate dehydrogenase A | LDHA | Tat, Envelope gp 41 | 0.53 |
| transferrin receptor (p90, CD71) | TFRC | Nef | 0.53 |
| moesin | MSN | Gag | 0.50 |
| adaptor-related protein complex 2, beta 1 subunit | AP2B1 | Nef | −0.56 |
| proteasome subunit, beta type, 6* | PSMB6 | GP140, GP120, Tat | −0.76 |
| karyopherin alpha 3 (importin alpha 4) | KPNA3 | Matrix | −0.80 |
| Vpr (HIV-1) binding protein* | VPRBP | Vpr | −1.10 |
| protein phosphatase 2, regulatory subunit B | PPP2R2A | Vpr | −1.23 |
| 8 hpi | |||
| Importin 5 | IPO5 | Vpr | 0.50 |
| glucose-6-phosphate isomerase | GPI | gp 120 | 0.66 |
| solute carrier family 3 | SLC3A2 | gp160 | 0.76 |
| small nuclear ribonucleoprotein polypeptides B and B1 | SNRPB | Tat | 0.90 |
| lysyl-tRNA synthetase* | KARS | Matrix, Gag, Capsid | −0.47 |
| HIV-1 Tat specific factor 1 | HTATSF1 | Tat | −0.47 |
| 20 hpi | |||
| vinculin | VCL | Nef | 0.50 |
| caspase 3, apoptosis-related cysteine peptidase | CASP3 | Vpr | −0.47 |
| lymphocyte-specific protein tyrosine kinase | LCK | Nef | −0.47 |
| transferrin receptor (p90, CD71) | TFRC | Nef | −1.06 |
| sialophorin | SPN | gp 120 | −1.73 |
| eukaryotic translation initiation factor 4 gamma | EIF4G1 | Retropepsin | −0.56 |
Conclusions
In our study, we utilized a high-throughput quantitative proteomic analysis to identify changes in host cell protein abundance upon infection of CD4+ T cell line with HIV-1. We show here that virus infection triggers perturbations in host proteome at a very early stage of infection before de novo production of viral proteins. Among the most significantly affected cellular functions were protein synthesis (early upregulation), followed by downregulation of proteins involved in cell proliferation, DNA repair and recombination, and maintenance of T cell immune function. These changes, some of which occur very early after infection, may suggest novel strategies by which the HIV-1 virus manipulates host cell machinery to its own advantage.
Supplementary Material
Research Highlights.
We measured proteome changes in HIV-infected T-cells in a synchronized infection.
Mass spectrometry-based global iTRAQ quantitation was used to quantify these changes.
348 proteins involved in various key cellular functions changed at early hours.
Importantly, these protein level changes occur before the onset of robust viral production.
Such early changes have not been described before.
Acknowledgments
We are grateful to Lynn Law (University of Washington) and, Sarah Belisle (University of Washington) for their helpful comments.
“We thank AIDS Research and Reference Reagent Program, Division of AIDS, NIAID, NIH: HIV-1SF2 p24 Antiserum.” This work is supported by Public Health Service grants P30DA015625, P51RR000166, and R24 RR016354 from the National Institutes of Health and in part by the University of Washington’s Proteomics Resource (UWPR95794).
Footnotes
Publisher's Disclaimer: This is a PDF file of an unedited manuscript that has been accepted for publication. As a service to our customers we are providing this early version of the manuscript. The manuscript will undergo copyediting, typesetting, and review of the resulting proof before it is published in its final citable form. Please note that during the production process errors may be discovered which could affect the content, and all legal disclaimers that apply to the journal pertain.
References
- Aebersold R, Mann M. Mass spectrometry-based proteomics. Nature. 2003;422(6928):198–207. doi: 10.1038/nature01511. [DOI] [PubMed] [Google Scholar]
- Barcova M, Speth C, Kacani L, Uberall F, Stoiber H, Dierich MP. Involvement of adenylate cyclase and p70(S6)-kinase activation in IL-10 up-regulation in human monocytes by gp41 envelope protein of human immunodeficiency virus type 1. Pflugers Arch. 1999;437(4):538–46. doi: 10.1007/s004240050815. [DOI] [PubMed] [Google Scholar]
- Benson DA, Karsch-Mizrachi I, Lipman DJ, Ostell J, Sayers EW. GenBank. Nucleic Acids Res. 2011;39(Database issue):D32–7. doi: 10.1093/nar/gkq1079. [DOI] [PMC free article] [PubMed] [Google Scholar]
- Bonaldi T, Talamo F, Scaffidi P, Ferrera D, Porto A, Bachi A, Rubartelli A, Agresti A, Bianchi ME. Monocytic cells hyperacetylate chromatin protein HMGB1 to redirect it towards secretion. EMBO J. 2003;22(20):5551–60. doi: 10.1093/emboj/cdg516. [DOI] [PMC free article] [PubMed] [Google Scholar]
- Borchers C, Tomer KB. Characterization of the noncovalent complex of human immunodeficiency virus glycoprotein 120 with its cellular receptor CD4 by matrix-assisted laser desorption/ionization mass spectrometry. Biochemistry. 1999;38(36):11734–40. doi: 10.1021/bi990935w. [DOI] [PubMed] [Google Scholar]
- Brass AL, Dykxhoorn DM, Benita Y, Yan N, Engelman A, Xavier RJ, Lieberman J, Elledge SJ. Identification of host proteins required for HIV infection through a functional genomic screen. Science. 2008;319(5865):921–6. doi: 10.1126/science.1152725. [DOI] [PubMed] [Google Scholar]
- Bukrinsky MI, Haffar OK. HIV-1 nuclear import: matrix protein is back on center stage, this time together with Vpr. Mol Med. 1998;4(3):138–43. [PMC free article] [PubMed] [Google Scholar]
- Bushman FD, Malani N, Fernandes J, D’Orso I, Cagney G, Diamond TL, Zhou H, Hazuda DJ, Espeseth AS, Konig R, Bandyopadhyay S, Ideker T, Goff SP, Krogan NJ, Frankel AD, Young JA, Chanda SK. Host cell factors in HIV replication: meta-analysis of genome-wide studies. PLoS Pathog. 2009;5(5):e1000437. doi: 10.1371/journal.ppat.1000437. [DOI] [PMC free article] [PubMed] [Google Scholar]
- Bustelo XR. Knocked out by Rho/Rac T-cell biology. Histol Histopathol. 2002;17(3):871–5. doi: 10.14670/HH-17.871. [DOI] [PubMed] [Google Scholar]
- Cannon JL, Mody PD, Blaine KM, Chen EJ, Nelson AD, Sayles LJ, Moore TV, Clay BS, Dulin NO, Shilling RA, Burkhardt JK, Sperling AI. CD43 interaction with ezrin-radixin-moesin (ERM) proteins regulates T-cell trafficking and CD43 phosphorylation. Mol Biol Cell. 2011;22(7):954–63. doi: 10.1091/mbc.E10-07-0586. [DOI] [PMC free article] [PubMed] [Google Scholar]
- Chan EY, Qian WJ, Diamond DL, Liu T, Gritsenko MA, Monroe ME, Camp DG, 2nd, Smith RD, Katze MG. Quantitative analysis of human immunodeficiency virus type 1-infected CD4+ cell proteome: dysregulated cell cycle progression and nuclear transport coincide with robust virus production. J Virol. 2007;81(14):7571–83. doi: 10.1128/JVI.00288-07. [DOI] [PMC free article] [PubMed] [Google Scholar]
- Chan EY, Sutton JN, Jacobs JM, Bondarenko A, Smith RD, Katze MG. Dynamic host energetics and cytoskeletal proteomes in human immunodeficiency virus type 1-infected human primary CD4 cells: analysis by multiplexed label-free mass spectrometry. J Virol. 2009;83(18):9283–95. doi: 10.1128/JVI.00814-09. [DOI] [PMC free article] [PubMed] [Google Scholar]
- Chang ST, Sova P, Peng X, Weiss J, Law GL, Palermo RE, Katze MG. Next-Generation Sequencing Reveals HIV-1-Mediated Suppression of T Cell Activation and RNA Processing and Regulation of Noncoding RNA Expression in a CD4+ T Cell Line. MBio. 2011;2(5) doi: 10.1128/mBio.00134-11. [DOI] [PMC free article] [PubMed] [Google Scholar]
- Coiras M, Camafeita E, Urena T, Lopez JA, Caballero F, Fernandez B, Lopez-Huertas MR, Perez-Olmeda M, Alcami J. Modifications in the human T cell proteome induced by intracellular HIV-1 Tat protein expression. Proteomics. 2006;6(Suppl 1):S63–73. doi: 10.1002/pmic.200500437. [DOI] [PubMed] [Google Scholar]
- Deutsch EW, Mendoza L, Shteynberg D, Farrah T, Lam H, Tasman N, Sun Z, Nilsson E, Pratt B, Prazen B, Eng JK, Martin DB, Nesvizhskii AI, Aebersold R. A guided tour of the Trans-Proteomic Pipeline. Proteomics. 2010;10(6):1150–9. doi: 10.1002/pmic.200900375. [DOI] [PMC free article] [PubMed] [Google Scholar]
- Eisenberg E, Levanon EY. Human housekeeping genes are compact. Trends Genet. 2003;19(7):362–5. doi: 10.1016/S0168-9525(03)00140-9. [DOI] [PubMed] [Google Scholar]
- Fu W, Sanders-Beer BE, Katz KS, Maglott DR, Pruitt KD, Ptak RG. Human immunodeficiency virus type 1, human protein interaction database at NCBI. Nucleic Acids Res. 2009;37(Database issue):D417–22. doi: 10.1093/nar/gkn708. [DOI] [PMC free article] [PubMed] [Google Scholar]
- Gruters RA, Terpstra FG, De Jong R, Van Noesel CJ, Van Lier RA, Miedema F. Selective loss of T cell functions in different stages of HIV infection. Early loss of anti-CD3-induced T cell proliferation followed by decreased anti-CD3-induced cytotoxic T lymphocyte generation in AIDS-related complex and AIDS. Eur J Immunol. 1990;20(5):1039–44. doi: 10.1002/eji.1830200514. [DOI] [PubMed] [Google Scholar]
- Hagner PR, Mazan-Mamczarz K, Dai B, Balzer EM, Corl S, Martin SS, Zhao XF, Gartenhaus RB. Ribosomal protein S6 is highly expressed in non-Hodgkin lymphoma and associates with mRNA containing a 5′ terminal oligopyrimidine tract. Oncogene. 2011;30(13):1531–41. doi: 10.1038/onc.2010.533. [DOI] [PMC free article] [PubMed] [Google Scholar]
- Han X, Aslanian A, Yates JR., 3rd Mass spectrometry for proteomics. Curr Opin Chem Biol. 2008;12(5):483–90. doi: 10.1016/j.cbpa.2008.07.024. [DOI] [PMC free article] [PubMed] [Google Scholar]
- Ingenuity® Systems. www.ingenuity.com.
- Jager S, Cimermancic P, Gulbahce N, Johnson JR, McGovern KE, Clarke SC, Shales M, Mercenne G, Pache L, Li K, Hernandez H, Jang GM, Roth SL, Akiva E, Marlett J, Stephens M, D’Orso I, Fernandes J, Fahey M, Mahon C, O’Donoghue AJ, Todorovic A, Morris JH, Maltby DA, Alber T, Cagney G, Bushman FD, Young JA, Chanda SK, Sundquist WI, Kortemme T, Hernandez RD, Craik CS, Burlingame A, Sali A, Frankel AD, Krogan NJ. Global landscape of HIV-human protein complexes. Nature. 2012;481(7381):365–70. doi: 10.1038/nature10719. [DOI] [PMC free article] [PubMed] [Google Scholar]
- Keller A, Nesvizhskii AI, Kolker E, Aebersold R. Empirical statistical model to estimate the accuracy of peptide identifications made by MS/MS and database search. Anal Chem. 2002;74(20):5383–92. doi: 10.1021/ac025747h. [DOI] [PubMed] [Google Scholar]
- Kornfeld H, Cruikshank WW, Pyle SW, Berman JS, Center DM. Lymphocyte activation by HIV-1 envelope glycoprotein. Nature. 1988;335(6189):445–8. doi: 10.1038/335445a0. [DOI] [PubMed] [Google Scholar]
- Levy S, Avni D, Hariharan N, Perry RP, Meyuhas O. Oligopyrimidine tract at the 5′ end of mammalian ribosomal protein mRNAs is required for their translational control. Proc Natl Acad Sci U S A. 1991;88(8):3319–23. doi: 10.1073/pnas.88.8.3319. [DOI] [PMC free article] [PubMed] [Google Scholar]
- MacPherson JI, Dickerson JE, Pinney JW, Robertson DL. Patterns of HIV-1 protein interaction identify perturbed host-cellular subsystems. PLoS Comput Biol. 2010;6(7):e1000863. doi: 10.1371/journal.pcbi.1000863. [DOI] [PMC free article] [PubMed] [Google Scholar]
- Madrid R, Janvier K, Hitchin D, Day J, Coleman S, Noviello C, Bouchet J, Benmerah A, Guatelli J, Benichou S. Nef-induced alteration of the early/recycling endosomal compartment correlates with enhancement of HIV-1 infectivity. J Biol Chem. 2005;280(6):5032–44. doi: 10.1074/jbc.M401202200. [DOI] [PubMed] [Google Scholar]
- Malim MH, Emerman M. HIV-1 accessory proteins--ensuring viral survival in a hostile environment. Cell Host Microbe. 2008;3(6):388–98. doi: 10.1016/j.chom.2008.04.008. [DOI] [PubMed] [Google Scholar]
- Melendez LM, Colon K, Rivera L, Rodriguez-Franco E, Toro-Nieves D. Proteomic analysis of HIV-infected macrophages. J Neuroimmune Pharmacol. 2011;6(1):89–106. doi: 10.1007/s11481-010-9253-4. [DOI] [PMC free article] [PubMed] [Google Scholar]
- Meng L, Yasumoto H, Tsai RY. Multiple controls regulate nucleostemin partitioning between nucleolus and nucleoplasm. J Cell Sci. 2006;119(Pt 24):5124–36. doi: 10.1242/jcs.03292. [DOI] [PMC free article] [PubMed] [Google Scholar]
- Meyuhas O. Physiological roles of ribosomal protein S6: one of its kind. Int Rev Cell Mol Biol. 2008;268:1–37. doi: 10.1016/S1937-6448(08)00801-0. [DOI] [PubMed] [Google Scholar]
- Miller HB, Robinson TJ, Gordan R, Hartemink AJ, Garcia-Blanco MA. Identification of Tat-SF1 cellular targets by exon array analysis reveals dual roles in transcription and splicing. RNA. 2011;17(4):665–74. doi: 10.1261/rna.2462011. [DOI] [PMC free article] [PubMed] [Google Scholar]
- Misse D, Cerutti M, Noraz N, Jourdan P, Favero J, Devauchelle G, Yssel H, Taylor N, Veas F. A CD4-independent interaction of human immunodeficiency virus-1 gp120 with CXCR4 induces their cointernalization, cell signaling, and T-cell chemotaxis. Blood. 1999;93(8):2454–62. [PubMed] [Google Scholar]
- Montanaro L, Trere D, Derenzini M. Nucleolus, ribosomes, and cancer. Am J Pathol. 2008;173(2):301–10. doi: 10.2353/ajpath.2008.070752. [DOI] [PMC free article] [PubMed] [Google Scholar]
- Nakada S, Tai I, Panier S, Al-Hakim A, Iemura S, Juang YC, O’Donnell L, Kumakubo A, Munro M, Sicheri F, Gingras AC, Natsume T, Suda T, Durocher D. Non-canonical inhibition of DNA damage-dependent ubiquitination by OTUB1. Nature. 2010;466(7309):941–6. doi: 10.1038/nature09297. [DOI] [PubMed] [Google Scholar]
- Pedrioli PG, Raught B, Zhang XD, Rogers R, Aitchison J, Matunis M, Aebersold R. Automated identification of SUMOylation sites using mass spectrometry and SUMmOn pattern recognition software. Nat Methods. 2006;3(7):533–9. doi: 10.1038/nmeth891. [DOI] [PubMed] [Google Scholar]
- Pinney JW, Dickerson JE, Fu W, Sanders-Beer BE, Ptak RG, Robertson DL. HIV-host interactions: a map of viral perturbation of the host system. AIDS. 2009;23(5):549–54. doi: 10.1097/QAD.0b013e328325a495. [DOI] [PubMed] [Google Scholar]
- Ptak RG, Fu W, Sanders-Beer BE, Dickerson JE, Pinney JW, Robertson DL, Rozanov MN, Katz KS, Maglott DR, Pruitt KD, Dieffenbach CW. Cataloguing the HIV type 1 human protein interaction network. AIDS Res Hum Retroviruses. 2008;24(12):1497–502. doi: 10.1089/aid.2008.0113. [DOI] [PMC free article] [PubMed] [Google Scholar]
- Ramaswamy M, Dumont C, Cruz AC, Muppidi JR, Gomez TS, Billadeau DD, Tybulewicz VL, Siegel RM. Cutting edge: Rac GTPases sensitize activated T cells to die via Fas. J Immunol. 2007;179(10):6384–8. doi: 10.4049/jimmunol.179.10.6384. [DOI] [PubMed] [Google Scholar]
- Ringrose JH, Jeeninga RE, Berkhout B, Speijer D. Proteomic studies reveal coordinated changes in T-cell expression patterns upon infection with human immunodeficiency virus type 1. J Virol. 2008;82(9):4320–30. doi: 10.1128/JVI.01819-07. [DOI] [PMC free article] [PubMed] [Google Scholar]
- Ross PL, Huang YN, Marchese JN, Williamson B, Parker K, Hattan S, Khainovski N, Pillai S, Dey S, Daniels S, Purkayastha S, Juhasz P, Martin S, Bartlet-Jones M, He F, Jacobson A, Pappin DJ. Multiplexed protein quantitation in Saccharomyces cerevisiae using amine-reactive isobaric tagging reagents. Mol Cell Proteomics. 2004;3(12):1154–69. doi: 10.1074/mcp.M400129-MCP200. [DOI] [PubMed] [Google Scholar]
- Speth C, Prohaszka Z, Mair M, Stockl G, Zhu X, Jobstl B, Fust G, Dierich MP. A 60 kD heat-shock protein-like molecule interacts with the HIV transmembrane glycoprotein gp41. Mol Immunol. 1999;36(9):619–28. doi: 10.1016/s0161-5890(99)00082-6. [DOI] [PubMed] [Google Scholar]
- The University of Washington’s Proteomic Resource Facility(UWPR) 2011 Jul 1; http://proteomicsresource.washington.edu/MassSpecUtils.php.
- The University of Washington Environment Health and Safety. 2011 http://www.ehs.washington.edu/rbsbiosafe/index.shtm.
- The University of Washington Proteomics Resource. 2011 Sep 2; http://proteomicsresource.washington.edu/cgi-bin/fragment.cgi.
- UNAIDS. http://www.unaids.org/en/media/unaids/contentassets/dataimport/pub/report/2009/jc1700_epi_update_2009_en.pdf.
- van ‘t Wout AB, Lehrman GK, Mikheeva SA, O’Keeffe GC, Katze MG, Bumgarner RE, Geiss GK, Mullins JI. Cellular gene expression upon human immunodeficiency virus type 1 infection of CD4(+)-T-cell lines. J Virol. 2003;77(2):1392–402. doi: 10.1128/JVI.77.2.1392-1402.2003. [DOI] [PMC free article] [PubMed] [Google Scholar]
- Vodicka MA, Goh WC, Wu LI, Rogel ME, Bartz SR, Schweickart VL, Raport CJ, Emerman M. Indicator cell lines for detection of primary strains of human and simian immunodeficiency viruses. Virology. 1997;233(1):193–8. doi: 10.1006/viro.1997.8606. [DOI] [PubMed] [Google Scholar]
- Wang H, Bloom O, Zhang M, Vishnubhakat JM, Ombrellino M, Che J, Frazier A, Yang H, Ivanova S, Borovikova L, Manogue KR, Faist E, Abraham E, Andersson J, Andersson U, Molina PE, Abumrad NN, Sama A, Tracey KJ. HMG-1 as a late mediator of endotoxin lethality in mice. Science. 1999;285(5425):248–51. doi: 10.1126/science.285.5425.248. [DOI] [PubMed] [Google Scholar]
- Wolf-Yadlin A, Hautaniemi S, Lauffenburger DA, White FM. Multiple reaction monitoring for robust quantitative proteomic analysis of cellular signaling networks. Proc Natl Acad Sci U S A. 2007;104(14):5860–5. doi: 10.1073/pnas.0608638104. [DOI] [PMC free article] [PubMed] [Google Scholar]
- Wu WW, Wang G, Baek SJ, Shen RF. Comparative study of three proteomic quantitative methods, DIGE, cICAT, and iTRAQ, using 2D gel- or LC-MALDI TOF/TOF. J Proteome Res. 2006;5(3):651–8. doi: 10.1021/pr050405o. [DOI] [PubMed] [Google Scholar]
- Zanin-Zhorov A, Nussbaum G, Franitza S, Cohen IR, Lider O. T cells respond to heat shock protein 60 via TLR2: activation of adhesion and inhibition of chemokine receptors. FASEB J. 2003;17(11):1567–9. doi: 10.1096/fj.02-1139fje. [DOI] [PubMed] [Google Scholar]
- Zhou Q, Sharp PA. Tat-SF1: cofactor for stimulation of transcriptional elongation by HIV-1 Tat. Science. 1996;274(5287):605–10. doi: 10.1126/science.274.5287.605. [DOI] [PubMed] [Google Scholar]
Associated Data
This section collects any data citations, data availability statements, or supplementary materials included in this article.