Abstract
Methionine sulfoxide reductases are present in all aerobic organisms. They contribute to antioxidant defenses by reducing methionine sulfoxide in proteins back to methionine. However, the actual in vivo roles of these reductases are not well defined. Since methionine is an essential amino acid in mammals, we hypothesized that methionine sulfoxide reductases may provide a portion of the dietary methionine requirement by recycling methionine sulfoxide. We used a classical bioassay, the growth of weanling mice fed diets varying in methionine, and applied it to mice genetically engineered to alter the levels of methionine sulfoxide reductase A or B1. Mice of all genotypes were growth retarded when raised on chow containing 0.10% methionine instead of the standard 0.45% methionine. Retardation was significantly greater in knockout mice lacking both reductases. We conclude that the methionine sulfoxide reductases can provide methionine for growth in mice with limited intake of methionine, such as may occur in the wild.
Keywords: Methionine, Methionine sulfoxide, Methionine sulfoxide Reductase, One carbon metabolism
Introduction
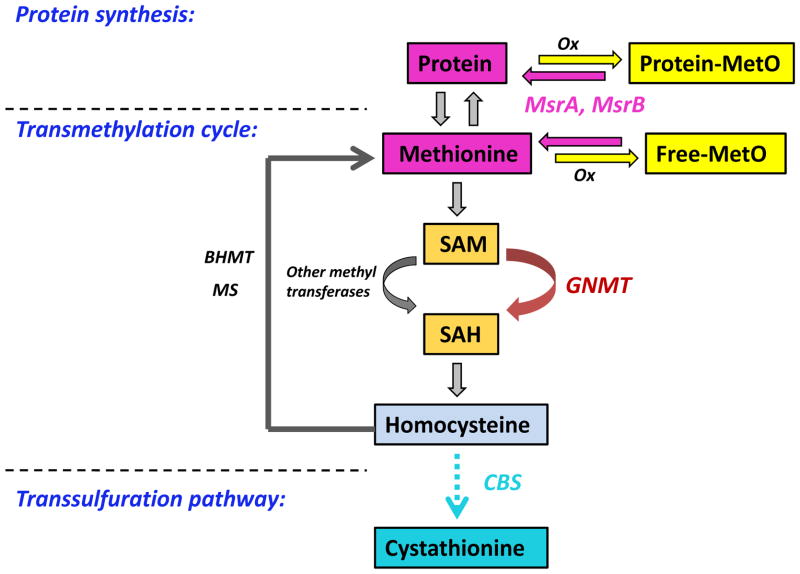
Virtually all organisms from bacteria to mammals have several methionine sulfoxide reductases (Msr) that catalyze the reduction of methionine sulfoxide back to methionine. The oxidation of methionine to its sulfoxide can be effected by reactive oxygen and nitrogen species. Approximately 98% of methionine in organisms is in proteins, and the steady state content of methionine sulfoxide in mouse tissues is 4–10% of the total methionine [1, 2]. Recovery of this oxidized methionine could therefore contribute to meeting the nutritional requirement for methionine (Fig. 1).
Figure 1.
Key components in the regulation of methionine metabolism. In vivo, both free and protein bound methionine can be oxidized by reactive oxygen and nitrogen species. msrA and msrB can reverse the methionine oxidation to replenish the methionine pool. The vast majority of methionine is found in proteins. The most important role of methionine in intermediary metabolism is in one carbon transfer. Methionine is required for generation of SAM, the major biological methyl donor in vivo. In the transmethylation cycle, SAM is converted to SAH, primarily by GNMT in the liver. SAH is further hydrolyzed to form homocysteine, which can be remethylated to regenerate methionine by MS or BHMT. Homocysteine can also undergo an irreversible transsulfuration pathway to form cystathionine. This also occurs mainly in the liver and is catalyzed by the enzyme CBS. The abbreviations are: MS, methionine synthase; BHMT, betaine-homocysteine methyltransferase; GNMT, glycine N-methyltransferase; CBS, cystathionine –synthase; Ox, oxidizing species; SAM, S-adenosylmethionine; SAH, S-adenosylhomocysteine
The oxidation of methionine produces two stereospecific forms of methionine sulfoxide. The R-form is reduced specifically by MsrB and the S-form by MsrA. In mammals, there is only one form of MsrA while there are three isoforms of MsrB, MsrB1, MsrB2 and MsrB3, each encoded by a different gene. MsrB1 is the most abundant of the B isozymes and is found in the cytosol and the nucleus. There is considerable evidence that MsrA and MsrB provide an antioxidant defense by scavenging reactive oxygen species through cyclic oxidation and reduction of methionine and methionine sulfoxide [3–12]. The reductase reaction also conserves methionine for metabolic processes by preventing its loss as methionine sulfoxide. Methionine is an essential amino acid in mammals [13], required for protein initiation, incorporation into proteins, and one carbon metabolism. We hypothesized that the Msr contribute to normal nutrition, especially in animals living in the wild with limited food sources. We tested this hypothesis with a classical biochemical nutrition experiment, namely following the growth of weanling mice on diets with decreasing methionine content. We studied the growth of wild-type mice and of mice genetically modified to lack MsrA, MsrB1, or both and also of mice overexpressing MsrA. On a low methionine diet, we expected mice lacking the reductase to exhibit blunted growth and that this growth retardation might be prevented by overexpression of the reductase.
Materials and Methods
Generation of Msr overexpressing and knockout mice
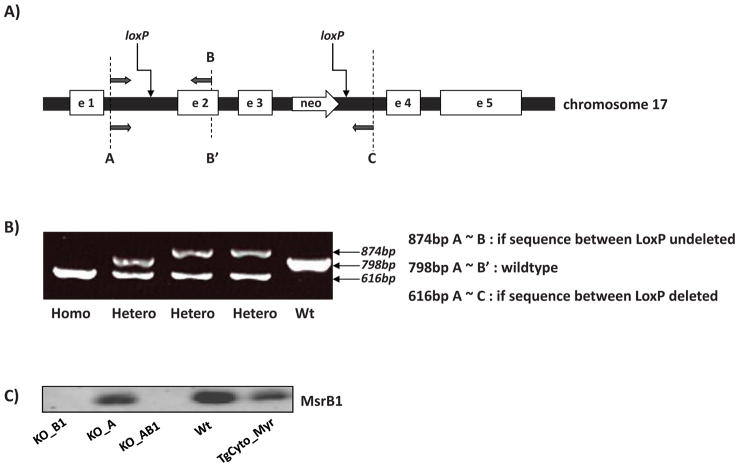
All mice described in this work were generated on C57BL/6 background. Mice were treated in accordance with the Guide for the Care and Use of Laboratory Animals (NIH publication 85–23, 1996), and the study was approved by the Animal Care and Use Committee of the National Heart, Lung, and Blood Institute. MsrA transgenic mice were generated as described [14]. MsrA residues 21–233 were included in the construct TgCyto_Myr for the cytosolic targeted transgenic mice, and the overexpressed MsrA was myristoylated in vivo as in the Wt [15]. Possible transgenic mice were screened for the presence of the transgene by PCR as described [14], and the founders were crossed with wild type C57BL/6 mice to generate transgenic lines. The KO_A mice used in this study were originally generated from a 129/SvJ background and later backcrossed for 10 generations into the C57BL/6 background [16]. Female mice heterozygous for the floxed exons 2 and 3 of the mice MsrB1 gene were generated by Ozgene (Bentley DC, WA, Australia) on a C57BL/6 background. Exon 2 and 3 of the MsrB1 gene were flanked by LoxP sites on chromosome 17 (Fig. 2A). Genomic excision of exon 2 and 3 of MsrB1 gene was accomplished by crossing with male B6.C-Tg (CMV-cre)1Cgn/J Cre recombinase expressing mice (006054, The Jackson laboratory, Bar Harbor, ME, USA). Offspring were genotyped by PCR using 3 primers (Forward 5′ CAGGTTGATCTAGGCAAATCCTCAGC 3′, Reverse 5′ GTCTCTCCCTCCACTAGCAGACACAG 3′, Reverse 5′ ATGAGTGTGCGTACTTCGAGTGACTG 3′) to confirm genomic deletion of exon 2 and 3 of MsrB1 gene (Fig. 2B). After that, KO_B1 mice were further bred with KO_A mice for generation of MsrA/MsrB1 double knockout mice. The levels of transgenic MsrA in the overexpression mice, and the absence of MsrA and/or MsrB1 in the knockout mice, were confirmed by Western blotting using brain, liver and kidney tissues.
Figure 2.
Generation of MsrB1 and double knockout mice. A) Scheme of the mouse MsrB1 gene and its flanking regions on chromosome 17. A segment with two LoxP sites flanking exon 2 and 3 replaced the endogenous sequence through homologous recombination (arrows). A, B, B′ and C mark the PCR primer annealing sites. B) Tail PCR genotyping shows that both MsrB1 gene alleles were knocked out in the homozygous mouse (Homo) and one in the heterozygous (Hetero). C) Immunoblot analysis of MsrB1 in liver tissues.
Weanling mice growth and diets
The growth study on male C5BL/6 mice was performed in the NIH Building 50 shared mice facility. Mice were housed at 3–4 animals per cage, with room temperature maintained at 20–23°, 30–70% humidity, and a 14/10 h light/dark cycle. Mice were weaned at 24 days of age and were immediately placed on a custom-manufactured diet containing 0.1%, 0.15%, 0.20%, and 0.45% methionine respectively in otherwise unmodified TestDiet 578C (TestDiet, Richmond, IN, USA). Growth rate was monitored by measuring body weight 3 times a week for one month. At the end the one month on the defined diets, the mice were about 10 weeks of age. After an overnight fast they were anesthetized with 0.01ml/g body weight ketamine/xylazine cocktail (ketamine 80mg/ml, xylazine 6mg/ml, K4138, Sigma, MO, USA). Blood and tissue samples were quickly taken, snap-frozen in liquid nitrogen, and stored at −80° for further analyses. The first study employed only the Wt genotype, with 5 animals per diet. The methionine content of the diet was 0.10%, 0.15%, 0.20%, or 0.45%. The second study included all genotypes and the diets containing 0.10%, 0.15%, and 0.45% methionine. The number of animals on the 3 diets by genotype were: Wt - 12,19,13; KO_A - 8,7,3; KO_B1 - 4,3,4; KO_AB1 - 8,4,8; TgCyto_Myr - 6,5,2. Growth curves were empirically fit to second order polynomials and compared with correction for multiple comparisons using Prism software, version 5.03 (GraphPad Software, La Jolla, CA).
Immunoblots
Liver, kidney and brain samples were weighed and homogenized with a hand-held micro grinder (Kontes Pellet Pestle) in ten volumes of RIPA lysis buffer (R0278, Sigma, MO, USA) supplemented with a 1:1,000 dilution of protease inhibitor cocktail (P8340, Sigma, MO, USA). Protein concentration was determined by the BCA method (Pierce-Thermo Scientific, USA). SDS-PAGE was performed on 10–20% gradient gels (EC61385, Invitrogen, CA, USA). Proteins were transferred onto 0.45μm nitrocellulose membrane (LC2001, Invitrogen, CA, USA) and then incubated in Odyssey blocking buffer (927–40000, Li-Cor, NE, USA) for 30 min. Overnight incubations with the primary antibodies were performed at 4° with a 1:25,000 dilution of polyclonal rabbit anti-MsrA (this laboratory), or a 1:20,000 dilution of monoclonal mouse anti-GAPDH (G8795, Sigma, MO, USA), or a 1:200 dilution of polyclonal rabbit anti-MsrB1 (LF-PA 0088, Abfrontier, Seoul, Korea), or a 1:1000 dilution of polyclonal rabbit anti-GNMT (sc-68871, Santa Cruz Biotechnology, Santa Cruz, CA, USA), or a 1:500 dilution of goat polyclonal anti-CBS (sc-46830 (K14), Santa Cruz Biotechnology, Santa Cruz, CA, USA). Incubations with the secondary antibodies were done at room temperature for 1 h with a 1:10,000 dilution of Dylight™ 680 goat anti-rabbit IgG (072-06-15-06, KPL, Gaithersburg, MD, USA) or IRDye 800CW goat anti-mouse IgG (926–32210, Li-Cor, Lincoln, NE, USA), or a1:20,000 dilution of IRDye 800CW donkey anti-goat IgG (926–32214, Li-Cor, Lincoln, NE, USA). For quantitation purpose, membranes were scanned with Li-Cor Odyssey Infrared Imager (Li-Cor, Lincoln, NE, USA) in the 700 nm and 800 nm channels.
Measurement of plasma methionine and tissue S-adenosylmethionine (SAM) and S-adenosylhomocysteine (SAH)
Blood was collected from the orbital sinus into a Vacutainer heparinized tube (BD, Franklin Lakes, NJ, USA) after removal of the eyeball. Plasma was immediately separated by centrifugation at 960 g for 5 min at 4°. Ten μl plasma was mixed with 10 μl 20% trichloroacetic acid, and centrifuged at 20,800 g for 3 min at 4°. Ten μl supernatant was mixed with 40 μl 0.05% trifluoroacetic acid and the pH was adjusted to 7.5 with 6 M NaOH. Amino acid analysis was performed as described [2]. Brain, liver and kidney SAM and SAH levels were also measured as previously described [17]. Briefly, 80–100 mg of tissue was homogenized in 4 volumes of 0.4M HClO4 and centrifuged at 20,800 g for 15 min at 4°. The supernatant was filtered through 0.45μm syringe filter (SVJH004NS, Millipore, Billerica, MA, USA ) and 25 μl was injected onto an Eclipse 3 μm, 4.6 × 75mm C18 column (Agilent, Santa Clara, CA, USA) in an Agilent 1200 HPLC system. The initial mobile phase was 8mM 1-octanesulfonic acid sodium salt (O0133, Sigma, MO, USA) in 50mM NaH2PO4, pH3.0. Analytes were separated by developing a gradient of 20 to 45% methanol over 7.5 min. SAM and SAH were quantitated from the area of their peaks compared to that of SAM and SAH standards (A9384 and A4377, Sigma, St. Louis, MO, USA).
Determination of glycine N-methyltransferase (GNMT)
Liver tissue GNMT activity was determined with 3H labeled SAM as described by Cook and Wagner with minor modifications [18]. Lysate containing 200 μg protein was mixed with 20μl 0.5 M Tris HCl pH7.4, 20μl 10 mM glycine, and 20μl 1 mM adenosyl-L-methionine S-[methyl-3H] (1 μCi/μmol) (NET155050UC, PerkinElmer, Waltham, MA, USA ) and brought to a final volume of 100μl. It was incubated at 25° for 15min, and the reaction stopped by addition of 50 μl ice-cold 10% trichloroacetic acid followed by 250μl 80 mg/ml acid washed charcoal. The tube was held on ice for 15min and then centrifuged at 20,800 g for 2min. Radioactivity in the supernatant was measured in a liquid scintillation analyzer (TRI-CARB 2900TR, PerkinElmer, Waltham, MA, USA ). Blank values were obtained by omission of glycine in the reaction mixture. The GNMT specific activity was expressed as nmol sarcosine formed per min per milligram protein.
Results
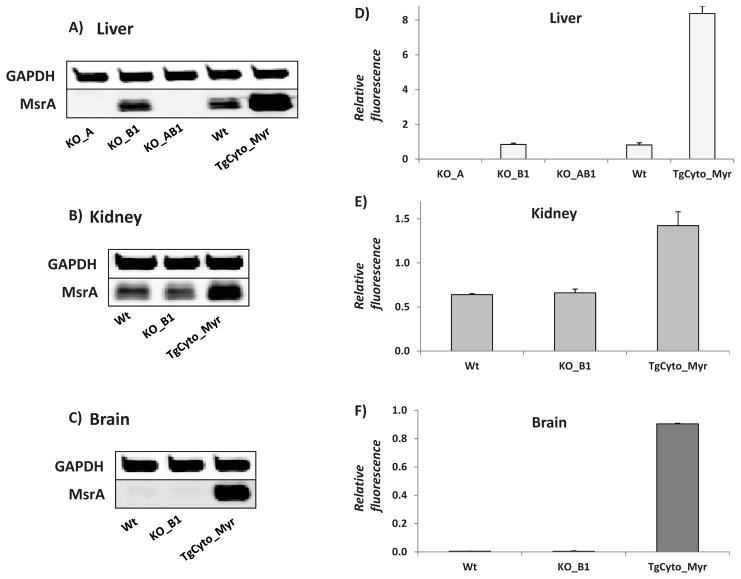
We recently characterized the MsrA transgenic mice used in this study [19], and for this study also generated a KO_B1 ( Fig. 2C). Crossing the two knockouts generated the double knockout, KO_AB1 ( Fig. 2C and Fig 3). The protein levels of MsrA in liver, kidney, and brain were determined by quantitative immunoblotting (Fig. 3). In the single knockout animals, there was no compensatory change in level of the remaining Msr. As found previously for the MsrA_KO, the MsrB1_KO and the MsrAB1_KO mice were viable and as shown below, had normal growth curves. Thus far, no abnormalities have been noted in these newly constructed knockout animals, with the oldest animals being 20 mo of age.
Figure 3.
Immunoblot and quantitation of of MsrA in mouse lines (mean ± SE, n=3). A&D) Liver. B&E) Kidney. C&F) Brain. GAPDH served as a loading control and MsrA levels were normalized to GAPDH.
In 1937 Rose and colleagues demonstrated that methionine was an essential amino acid in growing rats [20] and tentatively estimated that the requirement was met by food containing 0.60% (w/w) methionine [13]. In 1950 he refined the estimate and reduced it to 0.20% [21]. Studies by other investigators repeated Rose’s investigations with mice and found the methionine requirement to be similar to that for the rat [22, 23]. Given that animal husbandry has evolved since these pioneering studies and that we wished to moderately restrict dietary methionine, we first estimated the dietary methionine requirements of our wild-type mice. The commercial mouse feed utilized in our animal facility contains 0.45% methionine. We also studied 0.20%, 0.15%, and 0.10% methionine because Rose’s careful studies indicated that 0.20% would be borderline sufficient while 0.10% should be insufficient to support normal growth. We did not use diets with less than 0.10% methionine since Rose reported a substantial death rate on such diets. The experimental chows contained all other key nutrients, including minerals, vitamins, and fatty acids (Table 1) and the same content of carbohydrate, fat, and protein (Table 2). Compared to the 0.45% methionine standard diet, growth was distinctly retarded at all ages on the 0.10% methionine diet (Fig. 4). On 0.20% and 0.15% methionine, an initial retardation was evident during the early, rapid growth stage followed by substantial catchup growth during the last 2 weeks of the study. Food intake was recorded for 3 of the groups during two weeks of the study (Fig. 5). Intake was the same for the 0.20% and 0.45% diets but increased by 33% in the 0.10% group, indicating a compensatory increase in food in that group (p=0.04).
TABLE 1.
Nutritional profiles of normal and methionine-restricted diets
| Amino Acids | Fats & Carbohydrates | Mineral & Vitamins | |||
|---|---|---|---|---|---|
| Ingredients, Concentration % | Ingredients, Concentration % | Ingredients, Concentration % | |||
| Arginine | 0.83 | Linoleic | 2.86 | Total mineral mix | 10.0 |
| Histidine | 0.49 | Linolenic Acid | 0.05 | Total vitamin mix | 0.2 |
| Isoleucine | 0.80 | Choline chloride | 0.1 | ||
| Leucine | 1.20 | Other Fatty Acid: | Sodium Bicarbonate | 1.0 | |
| Lysine | 1.12 | Omega-3 | 0.05 | Vitamin B-12, mcg/kg | 40.0 |
| Methionine | 0.45,0.20,0.15,0.10 | Total saturated | 0.64 | ||
| Cystine | 0.40 | Total monounsaturated | 1.21 | ||
| Phenylalanine | 0.80 | Polyunsaturated | 2.90 | ||
| Tyrosine | 0.40 | ||||
| Threonine | 0.78 | Carbohydrate: | |||
| Tryptophan | 0.20 | Corn starch | 41.9–42.2 | ||
| Valine | 0.80 | Sucrose | 25.9 | ||
| Alanine | 1.00 | Corn oil | 5.0 | ||
| Aspartic acid | 1.00 | ||||
| Glutamic acid | 1.00 | ||||
| Glycine | 0.99 | ||||
| Proline | 1.00 | ||||
| Serine | 1.00 | ||||
TABLE 2.
Energy profiles of normal and methionine-restricted diets
| 0.1% Met diet kcal/gm(%) | 0.15% Met diet kcal/gm(%) | 0.45% Met diet kcal/gm(%) | |
|---|---|---|---|
| Amino acids | 0.546(13.8) | 0.547(13.9) | 0.554(14.1) |
| Fat | 0.459(11.7) | 0.458(11.7) | 0.458(11.7) |
| Carbohydrate | 2.931(74.5) | 2.929(74.4) | 2.917(74.2) |
Figure 4.
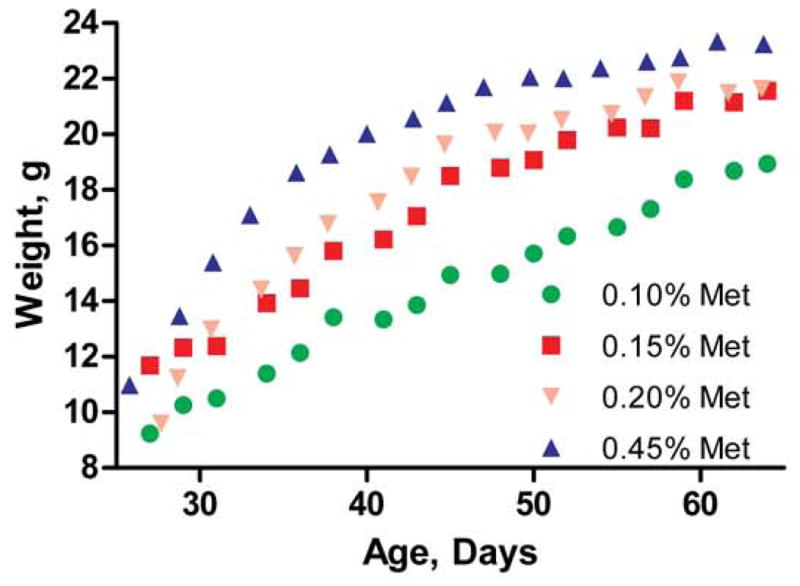
Growth curves of wild-type male mice fed diets of varying methionine content.
Figure 5.
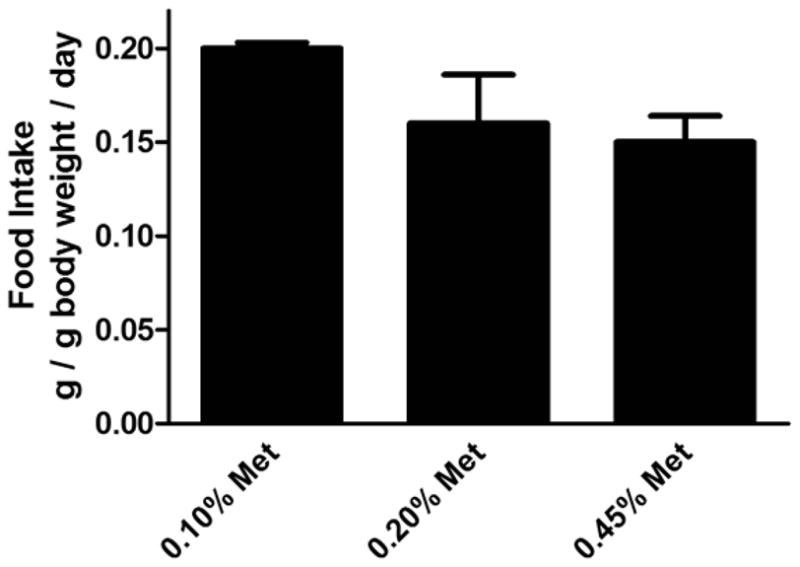
Food intake of wild-type male mice fed diets of varying methionine content.
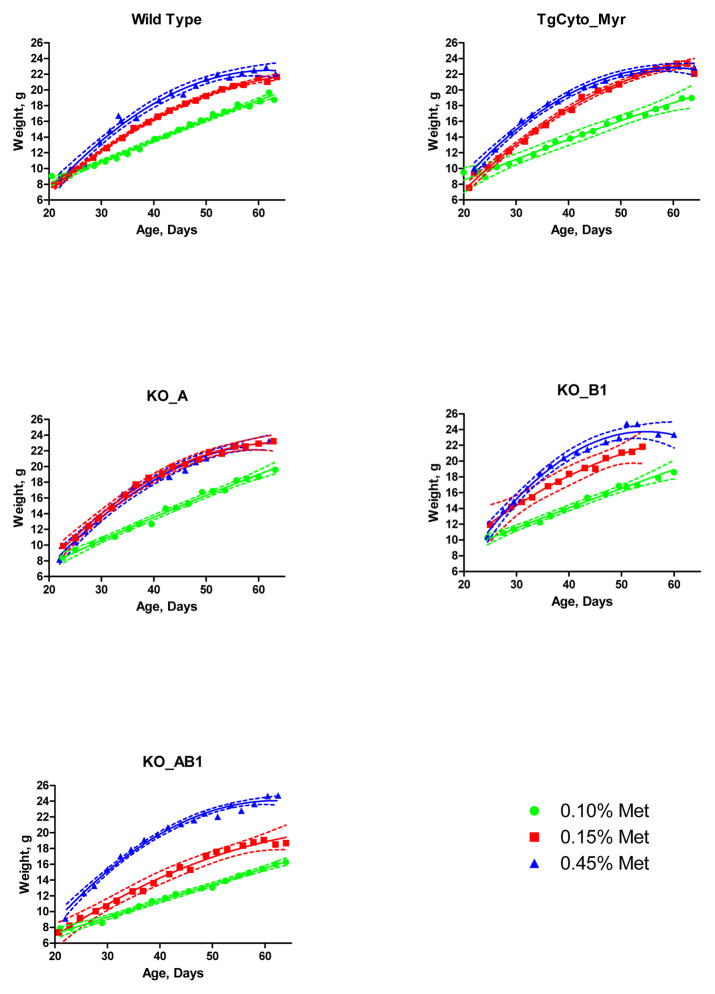
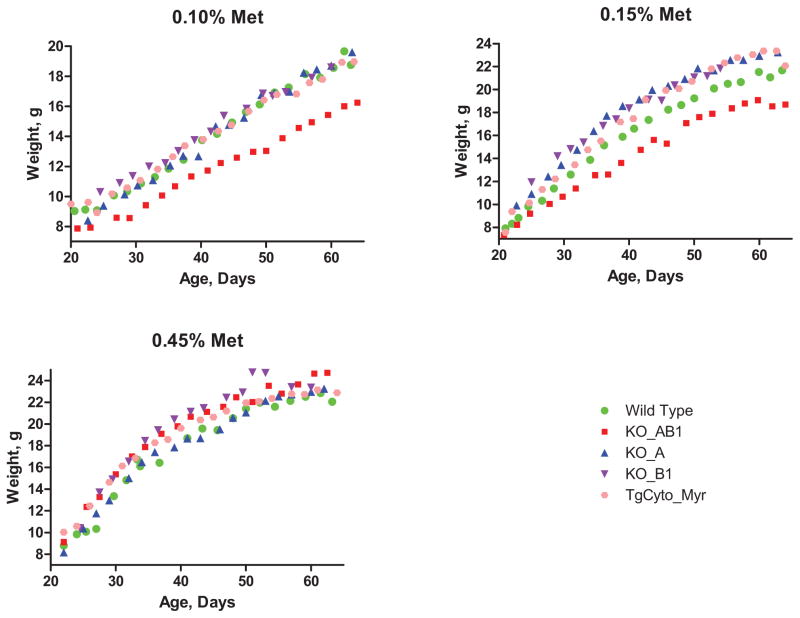
For subsequent studies with the genetically modified mice, we used 0.45%, 0.15%, and 0.10% methionine diets. If MsrA overexpression were able to provide additional methionine, the growth retardation of the animals on the 0.10% diet should be ameliorated. Conversely, if MsrA or MsrB contributes methionine for metabolic needs, then the knockout animals on the 0.10% diet should show even greater retardation and those on the 0.15% diet might also be growth retarded. Fig. 6 shows that the 0.10% methionine diet caused growth retardation in the wild-type mice and all 4 genetically manipulated mice. A small difference between the 0.45% and 0.15% groups is present and statistically significant in the wild-type and transgenic overexpressor, TgCyto_Myr (p<0.001 after correction for multiple comparisons). Differences were not appreciable in the single knockouts, KO_A and KO_B1, perhaps because the number of mice in these groups was too small. Both the 0.10% and 0.15% groups show a large difference from the 0.45% group in the double knockout, KO_AB1. Fig. 7 shows the growth curves grouped by the methionine content of the chow. No substantive differences are seen among the different genotypes in the 0.45% group, but retardation of the double knockout is clear on both the 0.15% and 0.10% diets. No consistent difference was seen among the other genotypes. In particular, we did not observe retardation of the single Msr knockouts on the 0.10% methionine diet; retardation was seen only in the double knockout.
Figure 6.
Growth curves of male mice fed diets of varying methionine content, grouped by their genotype. Dashed lines give the 95% confidence limits for the regression fit lines.
Figure 7.
Growth curves of male mice with different genotypes, grouped by the methionine content of their diet.
Biochemical measurements
Alteration of Msr activity may cause changes in other enzymes affecting methionine metabolism, including those important in one carbon metabolism (Fig. 1). For this reason and because the values obtained may be useful in and of themselves to other investigators, we carried out biochemical studies on mice fed the different diets. Plasma methionine levels have previously been measured in rodents on methionine restricted diets, and the levels were reported to be unchanged with restriction [25]. We also found no significant changes in plasma methionine concentration as a function of dietary methionine content nor genotype (Fig. S1).
Met is required to synthesize S-adenosylmethionine (SAM), a key metabolite which donates methyl groups in numerous reactions. After transfer of the methyl group, S-adenosylhomocysteine (SAH) is produced which can be recycled to SAM. The vast majority of one carbon metabolism occurs in the liver, so we measured liver SAM and SAH levels and also calculated the SAM:SAH ratio. No significant differences were detected (Fig. S2).
Glycine N-methyltransferase (GNMT) is an abundant liver protein which regulates the SAM:SAH ratio through its ability to convert SAM to SAH [26]. Consistent with its regulatory role, GNMT was upregulated in rats fed diets with excessive methionine content [27]. Given the constancy of serum methionine and liver SAM and SAH levels, we considered that GNMT might be down regulated in mice whose dietary methionine was restricted. Both quantitative immunblotting and activity measurements confirmed a greater than 50% decrease in GNMT in mice on the 0.10% methionine diet compared to those on the 0.45% methionine diet (Fig. S3). We did not observe a significant difference in the downregulation as a function of Msr genotype. CBS removes methionine by catalyzing an irreversible transsulfuration, and thus CBS along with GNMT is a key regulator of methionine, SAM, and SAH metabolism. As was the case for GNMT, mice on the 0.10% methionine diet had a greater than 50% decrease in CBS compared to those on the 0.45% diet, and this downregulation was also independent of Msr genotype (Fig. S4).
Discussion
A goal of our laboratory is to define the in vivo functions of the methionine sulfoxide reductases. One approach we adopted was the study of mice lacking MsrA, MsrB1, or both along with transgenic mice overexpressing MsrA in the cytosol or the mitochondria [19]. For the cytosolic MsrA overexpression, we created strains in which the enzyme was myristoylated and non-myristoylated to facilitate study of the effect of myristoylation. All of these genetically altered mice developed normally and exhibited normal post-natal growth. The knockout lacking MsrA has a normal lifespan [16]; lifespan studies on the other strains are in progress. The MsrA knockout is somewhat more susceptible to oxidative stress [16] but not to ischemia-reperfusion injury of the heart [19]. Overexpression of the mitochondrial MsrA was expected to protect against cardiac ischemia reperfusion, but it did not. Unexpectedly, overexpression of the cytosolic, myristoylated form did provide protection [19].
The aim of the current study was to determine whether the methionine sulfoxide reductases can contribute to meeting the requirement for the essential amino acid methionine. We used a classical bioassay, namely the growth of weanling mice fed diets varying in methionine content and applied it to mice genetically engineered to alter the levels of MsrA or MsrB1. Mice of all genotypes were growth retarded when their chow contained only 0.10% methionine, and the double knockout lacking both MsrA and MsrB1 was even more retarded. The single knockout mice lacking either MsrA or MsrB1 grew as well as the wild-type mice, and the transgenic mouse overexpressing MsrA was not rescued from growth retardation. The simplest explanation for the first result would be the existence of an epimerase which can interconvert the S and R forms of methionine sulfoxide. While no epimerase has yet been purified, evidence consistent with its existence has been noted by two different groups [28, 29]. If an epimerase were present, then either MsrA or MsrB1 could convert all available methionine sulfoxide back to methionine, so long as reductase activity was not limiting. Similarly, overexpression of MsrA would not rescue if the remaining activity were not limiting. The contribution of the reductases is only revealed by the double knockout.
On a standard laboratory chow, the contribution is not important, but it is likely significant for mice living in the wild.
GNMT and CBS are key regulators of cellular concentration of SAM, an essential metabolite in one-carbon metabolism. It was previously reported that GNMT levels increase in diets with excess methionine [27], and we now show that it is downregulated in mice on diets limited in methionine. Similarly, CBS levels are downregulated in mice on the methionine restricted diet. The decrease in GNMT and CBS can account for the constancy of tissue SAM and SAH content which we observed. The altered levels occurred in all genotypes, indicating that neither MsrA nor MsrB1 are required. No additional decrease in GNMT nor CBS was seen in the double knockout, despite their increased growth retardation. Although tissue levels of SAM and SAH were the same in the double knockout mice, we did not measure the flux of SAM so that we cannot rule out a limitation in one-carbon metabolism as a contributor to the additional growth retardation.
Supplementary Material
Highlights.
We demonstrate a role in mammalian nutrition for the methionine sulfoxide reductases.
Weanling mice on methionine restricted diets are growth retarded.
Knocking out methionine sulfoxide reductase A and B1 increases the growth retardation.
The reductases likely act by preventing the loss of methionine as its sulfoxide.
Acknowledgments
We thank the NIH Building 50 animal facility staff for their important support in this study. We also thank the Biochemistry Core facility of the National Heart, Lung, and Blood Institute for access to key instruments. The authors’ responsibilities were as follows: HZ, GK, and RLL designed the research; HZ conducted the research; HZ and RLL analyzed the data; HZ and RLL wrote the manuscript; GK provided essential materials; RLL had primary responsibility for the final content of the manuscript. This study was supported by the Intramural Research Program of the National Heart, Lung, and Blood Institute.
Abbreviations
- BHMT
betaine-homocysteine methyltransferase
- CBS
cystathionine β synthase
- GNMT
glycine N-methyltransferase
- Msr
methionine sulfoxide reductase
- KO_A
MsrA knockout
- KO_B1
MsrB1 knockout
- KO_AB1
MsrA and B1 double knockout
- MS
methionine synthase
- Ox
oxidizing species
- SAM
S-adenosylmethionine
- SAH
S-adenosylhomocysteine
- TgCyto_Myr
transgenic methionine sulfoxide reductase targeted to the cytosol and myristoylated
- Wt
wild type
Footnotes
Publisher's Disclaimer: This is a PDF file of an unedited manuscript that has been accepted for publication. As a service to our customers we are providing this early version of the manuscript. The manuscript will undergo copyediting, typesetting, and review of the resulting proof before it is published in its final citable form. Please note that during the production process errors may be discovered which could affect the content, and all legal disclaimers that apply to the journal pertain.
References
- 1.Stadtman ER, Van RH, Richardson A, Wehr NB, Levine RL. Biochim Biophys Acta. 2005;1703:135–140. doi: 10.1016/j.bbapap.2004.08.010. [DOI] [PubMed] [Google Scholar]
- 2.Luo S, Levine RL. FASEB J. 2009;23:464–472. doi: 10.1096/fj.08-118414. [DOI] [PMC free article] [PubMed] [Google Scholar]
- 3.St John G, Brot N, Ruan J, Erdjument-Bromage H, Tempst P, Weissbach H, Nathan C. Proc Natl Acad Sci USA. 2001;98:9901–9906. doi: 10.1073/pnas.161295398. [DOI] [PMC free article] [PubMed] [Google Scholar]
- 4.Fomenko DE, Novoselov SV, Natarajan SK, Lee BC, Koc A, Carlson BA, Lee TH, Kim HY, Hatfield DL, Gladyshev VN. J Biol Chem. 2009;284:5986–5993. doi: 10.1074/jbc.M805770200. [DOI] [PMC free article] [PubMed] [Google Scholar]
- 5.Levine RL, Moskovitz J, Stadtman ER. IUBMB Life. 2000;50:301–307. doi: 10.1080/713803735. [DOI] [PubMed] [Google Scholar]
- 6.Moskovitz J, Berlett BS, Poston JM, Stadtman ER. Proc Natl Acad Sci USA. 1997;94:9585–9589. doi: 10.1073/pnas.94.18.9585. [DOI] [PMC free article] [PubMed] [Google Scholar]
- 7.Moskovitz J, Flescher E, Berlett BS, Azare J, Poston JM, Stadtman ER. Proc Natl Acad Sci USA. 1998;95:14071–14075. doi: 10.1073/pnas.95.24.14071. [DOI] [PMC free article] [PubMed] [Google Scholar]
- 8.Moskovitz J, Bar-Noy S, Williams WM, Requena J, Berlett BS, Stadtman ER. Proc Natl Acad Sci USA. 2001;98:12920–12925. doi: 10.1073/pnas.231472998. [DOI] [PMC free article] [PubMed] [Google Scholar]
- 9.Romero HM, Berlett BS, Jensen PJ, Pell EJ, Tien M. Plant Physiol. 2004;136:3784–3794. doi: 10.1104/pp.104.046656. [DOI] [PMC free article] [PubMed] [Google Scholar]
- 10.Ruan H, Tang XD, Chen ML, Joiner ML, Sun G, Brot N, Weissbach H, Heinemann SH, Iverson L, Wu CF, Hoshi T, Chen ML, Joiner MA, Heinemann SH. Proc Natl Acad Sci USA. 2002;99:2748–2753. doi: 10.1073/pnas.032671199. [DOI] [PMC free article] [PubMed] [Google Scholar]
- 11.Douglas T, Daniel DS, Parida BK, Jagannath C, Dhandayuthapani S. J Bacteriol. 2004;186:3590–3598. doi: 10.1128/JB.186.11.3590-3598.2004. [DOI] [PMC free article] [PubMed] [Google Scholar]
- 12.Yermolaieva O, Xu R, Schinstock C, Brot N, Weissbach H, Heinemann SH, Hoshi T. Proc Natl Acad Sci USA. 2004;101:1159–1164. doi: 10.1073/pnas.0308215100. [DOI] [PMC free article] [PubMed] [Google Scholar]
- 13.Rose WC. Science. 1937;86:298–300. doi: 10.1126/science.86.2231.298. [DOI] [PubMed] [Google Scholar]
- 14.Zhao H, Kim G, Liu C, Levine RL. Free Radic Biol Med. 2010;49:641–648. doi: 10.1016/j.freeradbiomed.2010.05.017. [DOI] [PMC free article] [PubMed] [Google Scholar]
- 15.Kim G, Cole NB, Lim JC, Zhao H, Levine RL. Journal of Biological Chemistry. 2010;285:18085–18094. doi: 10.1074/jbc.M110.119701. [DOI] [PMC free article] [PubMed] [Google Scholar]
- 16.Salmon AB, Perez VI, Bokov A, Jernigan A, Kim G, Zhao H, Levine RL, Richardson A. FASEB J. 2009;23:3601–3608. doi: 10.1096/fj.08-127415. [DOI] [PMC free article] [PubMed] [Google Scholar]
- 17.Wang W, Kramer PM, Yang S, Pereira MA, Tao L. Journal of chromatography B, Biomedical sciences and applications. 2001;762:59–65. doi: 10.1016/s0378-4347(01)00341-3. [DOI] [PubMed] [Google Scholar]
- 18.Cook RJ, Wagner C. Proc Natl Acad Sci U S A. 1984;81:3631–3634. doi: 10.1073/pnas.81.12.3631. [DOI] [PMC free article] [PubMed] [Google Scholar]
- 19.Zhao H, Sun J, Deschamps AM, Kim G, Liu C, Murphy E, Levine RL. Am J Physiol Heart Circ Physiol. 2011;301:H1513–H1518. doi: 10.1152/ajpheart.00441.2011. [DOI] [PMC free article] [PubMed] [Google Scholar]
- 20.Womack M, Kemmerer KS, Rose WC. Journal of Biological Chemistry. 1937;121:403–410. [Google Scholar]
- 21.Wretlind KAJ, Rose WC. Journal of Biological Chemistry. 1950;187:697–703. [PubMed] [Google Scholar]
- 22.Leveille GA, Sauberlich HE, Shockley JW. J Nutr. 1961;75:455–458. doi: 10.1093/jn/75.4.455. [DOI] [PubMed] [Google Scholar]
- 23.John AM, Bell JM. J Nutr. 1976;106:1361–1367. doi: 10.1093/jn/106.9.1361. [DOI] [PubMed] [Google Scholar]
- 24.Mato JM, Martinez-Chantar ML, Lu SC. Annual review of nutrition. 2008;28:273–293. doi: 10.1146/annurev.nutr.28.061807.155438. [DOI] [PubMed] [Google Scholar]
- 25.Sauberlich HE. J Nutr. 1956;59:353–370. doi: 10.1093/jn/59.3.353. [DOI] [PubMed] [Google Scholar]
- 26.Stipanuk MH. Annu Rev Nutr. 2004;24:539–577. doi: 10.1146/annurev.nutr.24.012003.132418. [DOI] [PubMed] [Google Scholar]
- 27.Rowling MJ, McMullen MH, Chipman DC, Schalinske KL. The Journal of Nutrition. 2002;132:2545–2550. doi: 10.1093/jn/132.9.2545. [DOI] [PubMed] [Google Scholar]
- 28.Weissbach H, Etienne F, Hoshi T, Heinemann SH, Lowther WT, Matthews B, St John G, Nathan C, Brot N. Arch Biochem Biophys. 2002;397:172–178. doi: 10.1006/abbi.2001.2664. [DOI] [PubMed] [Google Scholar]
- 29.Kumar RA, Koc A, Cerny RL, Gladyshev VN. J Biol Chem. 2002;277:37527–37535. doi: 10.1074/jbc.M203496200. [DOI] [PubMed] [Google Scholar]
Associated Data
This section collects any data citations, data availability statements, or supplementary materials included in this article.


