

Abstract
Sox2 is expressed by neural stem and progenitor cells, and a sox2 enhancer identifies these cells in the forebrains of both fetal and adult transgenic mouse reporters. We found that an adenovirus encoding EGFP placed under the regulatory control of a 0.4 kb sox2 core enhancer selectively identified multipotential and self-renewing neural progenitor cells in dissociates of human fetal forebrain. Upon EGFP-based fluorescence-activated cell sorting (FACS), the E/sox2:EGFP+ isolates were propagable for up to 1 year in vitro, and remained multilineage competent throughout. E/sox2:EGFP+ cells expressed more telomerase enzymatic activity than matched E/sox2:EGFP-depleted populations, and maintained their telomeric lengths with successive passage. Gene expression analysis of E/sox2:EGFP-sorted neural progenitor cells, normalized to the unsorted forebrain dissociates from which they derived, revealed marked overexpression of genes within the notch and wnt pathways, and identified multiple elements of each pathway that appear selective to human neural progenitors. Sox2 enhancer-based FACS thus permits the prospective identification and direct isolation of a telomerase-active population of neural stem cells from the human fetal forebrain, and the elucidation of both the transcriptome and dominant signaling pathways of these critically important cells.
Introduction
The specific identification of live human neural stem cells has been challenging, in large part due to the lack of selective reporters for these cells. Transgenic mice with reportable neural progenitors have been established using regulatory sequences for the neuroepithelial filament nestin (Kawaguchi et al., 2001; Mignone et al., 2004) and the soxB1 transcription factor sox2 (Zappone et al., 2000; Ferri et al., 2004; Suh et al., 2007). However, transgenic reporting strategies do not lend themselves to use with human tissue-derived cells. Alternatively, virally delivered nestin and musashi regulatory sequences have been used to isolate neural progenitor cells from fetal human brain tissue (Keyoung et al., 2001), but nestin and musashi are also expressed by lineage-restricted neuronal progenitors and glial progenitors, respectively, limiting their utility to restricted developmental periods and settings. Several surface antigens, such as LeX/CD15 (Capela and Temple, 2002) and CD133 (Uchida et al., 2000), have been reported to recognize neural stem and progenitor cells, but these markers appear neither specific nor selective in human brain tissue, limiting their utility.
In this study, we asked whether an enhancer regulating forebrain neuroepithelial sox2 expression might be used to selectively identify human neural stem and progenitor cells. Sox2 is expressed early in neuroepithelial development, and its expression persists in both mitotically competent neural stem cells and their transit-amplifying daughters (Zappone et al., 2000; Graham et al., 2003; Pevny and Placzek, 2005; Pevny and Nicolis, 2010). Zappone et al. (2000) had previously defined a 5′ regulatory region within the sox2 gene, which can direct sox2 expression in both neural stem and progenitor cells in the forebrain. A small 0.4 kb core enhancer within this region includes a POU factor binding site, which appears sufficient to specify gene expression to the forebrain neuroepithelium (Catena et al., 2004; Miyagi et al., 2006). On this basis, we asked whether viruses expressing fluorescent transgenes under the control of this sox2 neuroepithelial enhancer might be used to identify and isolate neural stem and progenitor cells from the human fetal forebrain.
Using adenoviral E/sox2:EGFP to transduce dissociates of the second trimester human ventricular zone (VZ)/subventricular zone (SVZ), followed by EGFP-directed fluorescence-activated cell sorting (FACS), we found that the resultant E/sox2:EGFP+ isolates differed from the larger cell populations from which they derived, in terms of their expansion competence, expressed transcriptome, and telomerase activity. The sox2+ isolates were multipotential and capable of sustained mitotic expansion, to a substantially larger degree than were matched sox2− isolates. Accordingly, they expressed higher levels of telomerase enzymatic activity than did E/sox2:EGFP-depleted fractions, and maintained their telomeric lengths with successive passage, consistent with the E/sox2-based enrichment of bona fide neural stem cells. Expression profiling of the E/sox2:EGFP+ cells then revealed that the sox2+ cells manifested a distinct expression signature, characterized by the transcriptional overrepresentation of both notch and canonical wnt pathways. Together, these observations indicate that adenoviral E/sox2-based fluorescence-activated cell sorting permits the direct isolation of telomerase-expressing neural stem cells from the fetal human brain, and suggest a coherent set of transcriptional targets for both their dynamic modulation and phenotypic instruction.
Materials and Methods
Human fetal samples and cultures
Human fetal brain was taken from second-trimester aborted fetuses of 13–21 weeks gestational age (g.a.; n = 25 total); samples used for genomic analysis (n = 4) were limited to 16–19 weeks g.a. Tissues were obtained from aborted fetuses, with informed consent and tissue donation approval from the mothers, under protocols approved by the Research Subjects Review Board of the University of Rochester Medical Center, as well as the Institutional Review Boards of both Weill Medical College of Cornell University and the Albert Einstein College of Medicine (AECOM); the latter included the Human Fetal Tissue Resource of AECOM and Jacobi Hospital. No patient identifiers were made available to or known by any investigators besides N.S.; no known karyotypic abnormalities were included. The samples (n = 21 for culture, 4 for genomics) were collected into HBSS, and the telencephalic VZ/SVZ were collectively dissected from the remaining forebrain, along the plane of the intermediate zone (IZ) and subcortical anlagen. The VZ/SVZ was then dissociated as previously described (Keyoung et al., 2001). The cells were resuspended at 2–4 × 10⁶ cells/ml in DMEM/F12/N2 containing 20 ng/ml bFGF (Sigma), and plated in suspension culture dishes (Corning).
Construction of AdE/Sox2:EGFP
An adenovirus was constructed to express EGFP under the control of the sox2 N2 enhancer, which specifies gene expression to the embryonic VZ. The 0.4 kb sox2 N2 enhancer (Catena et al., 2004) was PCR amplified and then subcloned into pENTR5′. This plasmid was recombined with a plasmid containing a β-globin minimal promoter upstream of EGFP and a polyA tail, yielding pENTR/D E/sox2:P/β-globin:EGFP:pA. The 3′-poly A tail, an SV40 early mRNA polyadenylation signal, was adopted from Clontech's pEGFP-N1 construct. The sequence is 50 bp long, as AAATA AAGCA ATAGC ATCAC AAATT TCACA AATAA AGCAT TTTTT TCACT. The resultant pENTR/D E/sox2:P/β-globin:EGFP:pA plasmid was subsequently cloned into the pAd/PL-DEST vector (Invitrogen). The pAd/PL-DEST vector was then linearized with PacI, transfected into 293A cells, and viral plaques were allowed to develop for 2 weeks. The virus was purified using double CsCl2 centrifugation, yielding a titer of 1011 plaque forming units (pfu)/ml.
Plasmid transfection
The pENTR/D E/sox2:P/β-globin:EGFP:pA plasmid was introduced into the human fetal forebrain dissociates using FuGENE 6 Transfection Reagent (Roche), 12 h after plating. Briefly, 1.5 μl of FuGENE 6 was diluted with 100 μl of Opti-MEM I (Invitrogen), mixed, and incubated at room temperature for 5 min. A 0.5 μg quantity of either pENTR/D E/sox2:P/β-globin:EGFP or a control vector, pENTR/D P/β-globin:EGFP, was added to the FuGENE 6/Opti-MEM combination at a 3 (DNA):1 (FuGENE) ratio, then mixed and incubated at room temperature for 45 min. The mixture of FuGENE 6 and plasmid DNA was then added to fetal forebrain cells cultured in 0.5 ml of fresh Opti-MEM, incubated at 37°C in 5% CO2. After 14–16 h, the transfection reagent was replaced with fresh culture media. E/sox2:P/β-globin:EGFP expression was typically observed by day 3 after transfection.
Adenoviral infection
The day after tissue dissociation, the human fetal forebrain cells were collected, counted, and resuspended at a density of 2–4 × 10⁶ cells/ml in DMEM/F12/N2 containing 20 ng/ml bFGF, then replated in suspension culture dishes. The cells were allowed to recover for a few hours before infection with AdE/sox2:EGFP, at 5 multiplicities of infection (moi) for 8–12 h in DMEM/F12/N2 with 20 ng/ml bFGF. The cell suspension was then collected, transferred to a centrifuge tube, and pelleted at 200 × g for 10 min to exclude remaining adenovirus. The pelleted cells were resuspended in new DMEM/F12/N2 with 20 ng/ml bFGF and returned to the original suspension culture dishes. The infected cells were monitored daily until EGFP expression was detected, typically 3–5 d later, and were then dissociated with papain before FACS, as previously described (Keyoung et al., 2001).
Flow cytometry and sorting
Flow cytometry and sorting of E/sox2:EGFP+ and E/sox2:EGFP− cells were performed on a FACSAria (Becton Dickinson). Cells were washed twice with Ca2+- and Mg2+-free HBSS, then incubated with 50 U of papain (Worthington) and 100 U of DNase I (Sigma) in PIPES at 37°C for 10 min with gentle shaking. The samples were spun and then resuspended in 2 ml of DMEM/F12/N2 and dissociated by sequentially triturating with three serially narrowed glass Pasteur pipettes. The papain was inactivated with DMEM/F12/N2 plus 20% FBS, and the cells were pelleted. The pelleted cells were resuspended in HBSS (minus MgCl2, CaCl2, MgSO4, and Phenol Red) and then passed over a 40 μm cell strainer (BD). The cells were resuspended to a final concentration of 3–6 × 10⁶ cells/ml with 1.0 μg of 7-amino-actinomycin D (7-AAD). The cells were analyzed by forward and side scatter, for EGFP fluorescence through a 530 ± 30 nm bandpass filter and for 7-AAD fluorescence through a 695 ± 40 nm bandpass filter. The EGFP+ cells were sorted at 2000–5000 events/s using a purification mode algorithm. Either Ad/CMV/V5-GW/lacZ-infected cells or uninfected cells were used as a control to set the background fluorescence; a false-positive rate of 0.1% was accepted so as to ensure an adequate yield. Sorted E/sox2:EGFP+ and E/sox2:EGFP− cells were plated onto poly-l-ornithine/laminin- coated plates in DMEM/F12/N2 supplemented with 20 ng/ml bFGF for 2–5 d and then fixed for immunostaining.
Propagation of human neural stem cells
After FACS, AdE/sox2:EGFP+ and AdE/sox2:EGFP− cells were distributed into six-well plates at 50,000–100,000 cells/ml in serum-free medium supplemented with 20 ng/ml bFGF, 20 ng/ml EGF, and 2 ng/ml LIF. After 8 d, the number of primary neurospheres in each culture was determined. The primary neurospheres were then dissociated in papain and passaged. The passaged cells were then cultured for another 2 weeks and secondary spheres were observed. The number of secondary spheres was determined at 30 d. The secondary spheres were plated onto poly-l-ornithine/laminin-coated plates in DMEM/F12/N2 plus 1% FBS, without mitogens, for 7–10 d to allow for differentiation.
Immunocytochemistry
Histological sections.
Human fetal tissues were fixed with 4% paraformaldehyde for 30 min at 4°C. The tissue was then washed three times with 0.1 m PBS. The samples were then mounted in O.C.T. and cryosectioned at 15 μm. The sections were washed with 1× PBS, permeabilized with PBS containing 0.1% saponin and 1% normal donkey serum for 30 min at room temperature, and blocked with PBS containing 0.05% saponin and 5% normal donkey serum for 30 min. Sections were then labeled with goat anti-human Sox2 (1:1000, R&D Systems) and coimmunostained with one of the following antibodies: mouse anti-human glial fibrillary acidic protein (GFAP) (1:400, Sigma); mouse anti-human nestin (1:1000, Millipore Bioscience Research Reagents); mouse anti-human MAP2 (1:1000; Millipore Bioscience Research Reagents); or rabbit anti-human musashi (1:1000, courtesy of Dr. Hideyuki Okano, Keio University, Tokyo, Japan). Alexa Fluor secondary antibodies, including both Alexa-488 and -594-conjugated donkey anti-goat and anti-mouse antisera, respectively, were used at 1:400 (Invitrogen).
Cultures.
After 2 d in vitro, unsorted cultures or FACS-sorted cultures were fixed for immunocytochemistry. Alternatively, spheres were plated onto poly-l-ornithine/laminin-coated plates in DMEM/F12/N2 plus 1% FBS for 10 d. After 10 d, the spheres were fixed for immunocytochemistry. In either case, the cells were rinsed with HBSS, then fixed with 4% paraformaldehyde for 5 min at room temperature. The cells were incubated with primary antibodies overnight at 4°C and with secondary antibodies for 1 h at 25°C. Primary antibodies included those against: sox2 (1:1000, R&D Systems); GFAP (1:400, Sigma); nestin (1:1000, Millipore Bioscience Research Reagents); musashi (1:500, Dr. Hideyuki Okano); βIII-tubulin (1:1000, Covance); and oligodendrocytic sulfatide, as recognized by MAb O4 (1:100, Millipore Bioscience Research Reagents).
Gene expression and analysis
Total RNA was extracted from E/sox2:EGFP+ and E/sox2:EGFP− cells, as well as that of their parental VZ/SVZ tissues, using RNeasy (Qiagen) and amplified using 3′-biased ribo-SPIA (NuGen Ovation). Amplified product was labeled and hybridized onto Affymetrix U133-Plus 2 arrays according to manufacturer's instructions (Affymetrix). Microarray analysis was performed in Genespring GX 7.3.1 (Agilent). Raw CEL data were processed using the MAS5 method. Poor quality data were removed by filtering those probe sets whose raw expression control levels did not exceed the average ratio of base:proportional coefficients as defined by the cross-gene error model in at least half of the arrays. Further filtration was performed using MAS5 generated present/absent calls to remove those probe sets called “absent” in all samples. Significantly variable genes were then defined by one-way ANOVA followed by post hoc t test. p values were corrected using the false discovery rate (Benjamini and Hochberg, 1995). Following identification of significant probe sets, annotation was performed using a custom SQL database and gene ontology analysis performed. Venn diagrams were formulated using either Bioinformatics Resource Manager Software (BRM v2.0) obtained from the Pacific Northwest National Laboratory (http://omics.pnl.gov) or GeneSpring (Agilent).
Parametric gene set enrichment analysis was performed using KEGG pathways in Bioconductor and R (Gentleman et al., 2004). Following Robust Multichip Average (RMA)-based normalization and filtration to retain only the most variably annotated probe set for each gene, parametric gene set enrichment analysis (GSEA) was performed comparing E/sox2:EGFP-sorted (E/sox2:EGFP+), -depleted (E/sox2:EGFP−) and -unsorted fetal VZ/SVZ tissue dissociates, using a linear modeling approach (n = 4 each). p values were corrected using false discovery rate (FDR) and significance assigned at 5% FDR (q = 0.05).
Real-time RT-PCR low-density array analyses
Extracted total RNA was amplified using ribo-SPIA-based whole transcriptome-based amplification (NuGen). The expression of 95 cell type markers and pathway-specific genes was assessed using a 96 gene Taqman low-density array (Applied Biosystems). The complete list of primer/probes is given in supplemental Table 1 (available at www.jneurosci.org as supplemental material). The relative abundance of transcript expression was calculated by ΔΔCt analysis, and the expression data were normalized to glyceraldehyde-3-phosphate dehydrogenase (GAPDH). Genes whose expression was not detected in more than half of the RNA samples were excluded. Statistical analysis was performed on log2-transformed data and p values were calculated following a paired t test. Further analysis of differentially expressed genes was then performed using Bioconductor and R (Gentleman et al., 2004) using a moderated t test statistic with 5% false discovery rate cutoff (Smyth, 2004).
Telomerase assays
TRAP assay.
The telomeric repeat amplification protocol (TRAP) assay was conducted as described previously (Roy et al., 2004, 2007), using the TRAPeze telomerase detection kit (Millipore Bioscience Research Reagents), with the following modifications. The cells were collected by centrifugation, washed once with 1× PBS, and extracted with 1× cold CHAPS lysis buffer (supplemented with 100 U/ml RNaseOUT). Sample extracts corresponding to 10,000 or 20,000 cells were examined for telomerase activity using the following parameters: incubate at 30°C for 30 min then amplify by PCR in a thermocycler: 94°C for 30 s denaturation, 59°C for 30 s annealing, and 72°C for 1 min extension, for 33 cycles. Five microliters of loading dye were added to each sample, and 25 μl of each sample was loaded onto a 12.5% non-denaturing PAGE gel. The gel was stained with SybrGreen at a dilution of 1:10,000 in 0.5× TBE for 40 min and then visualized with a 254 or 302 nm UV transIlluminator. The gel image was acquired with Kodak Molecular Imaging software, and the total products generated from each sample (TPG units) were quantified as described by the TRAPeze manufacturer.
Telomere length.
Genomic DNA was isolated from cells using a genomic DNA extraction kit (High Pure PCR Template Preparation Kit, Roche) as per the manufacturer's instructions. Telomere length was determined as described previously (Roy et al., 2004, 2007), by nonradioactive Southern blot analysis of terminal restriction fragments obtained by the digestion of genomic DNA, using the TeloTAGGG Telomere Length Assay kit (Roche). Five hundred nanograms of DNA were digested using the restriction enzymes HinfI and RsaI. The digested DNA was then separated by electrophoresis on a 0.8% agarose gel in 1× Tris-acetate-EDTA (TAE) buffer. The digested DNA from the gel was transferred to a nylon membrane via Vacuum Blotter (Model 785, Bio-Rad) at room temperature using 20 × SSC as a transfer buffer for 2 h. The membrane was hybridized with the telomere-specific probe, washed, incubated with anti-DIG-alkaline phosphatase, and then detected using CDP-Star chemiluminescence substrate. Determination of mean TRF length was done as follows: Σ(ODi)/Σ(ODi/Li), where ODi is the densitometer output and Li is the length of the DNA position at i. The amount of telomeric DNA was calculated by integrating the volume of each band, using Kodak Molecular Imaging software.
Results
Sox2 is highly and selectively expressed in the fetal human VZ and SVZ
To assess the normal distribution of sox2-expressing cells in the mid-second trimester human forebrain, samples were fixed and immunostained for sox2, using an antibody whose lack of cross-reactivity with other soxB family members we verified by Western blot (supplemental Fig. 1, available at www.jneurosci.org as supplemental material). In 16 week g.a. fetal brain tissue, sox2+ cells were abundant in the VZ of the lateral ventricle; sox2 immunoreactivity (IR) was predominant in the VZ, in which virtually all cells were sox2+, but was less so in the SVZ. Abundant sox2-IR was also observed in the intermediate zone (IZ) (Fig. 1A); these latter sox2+ cells of the IZ were excluded from our in vitro and genomics assessments by selective dissection along the SVZ–IZ border, which could be identified by a distinct change in tissue consistency in fresh tissue. In the fetal VZ/SVZ, sox2-IR was coexpressed with the neural progenitor filament nestin (Fig. 1B,C) and the neural progenitor RNA binding protein musashi1 (Msi1) (Fig. 1D,E). At 16 weeks gestational age, few cells expressed GFAP in the VZ, although GFAP+ cells were evident in the SVZ, many of which manifested radial glial morphology and coexpressed sox2 (Fig. 1F,G). Sox2+ cells were never noted to coexpress the mature neuronal marker MAP2, in the VZ/SVZ, IZ, or cortical plate (not shown).
Figure 1.

Sox2 is expressed by neural progenitor cells within the VZ/SVZ of human fetal forebrain. A, A cross section of human forebrain ventricular wall at 16 weeks g.a., exhibiting dense concentrations of sox2+ cells (red) in the VZ and IZ (DAPI nuclear counterstain, blue). Within the VZ, sox2+ cells coexpressed the neural progenitor markers nestin (B, C) and musashi (D, E). A relatively small fraction of VZ cells also coexpressed sox2 with GFAP (F, G), although most GFAP+ cells at this stage were noted in the SVZ; these included both sox2+ and sox2− examples (G). Scale bars: A, 50 μm; B–G, 25 μm.
A 5′ sox2 enhancer identifies neural progenitors in the human fetal forebrain
Previous studies have reported that a 400 bp sequence located 2 kb upstream of the translation start codon of the sox2 gene, designated the N2 region, acts as a core enhancer that specifies sox2 expression to both mouse and chick forebrain neural progenitor cells (Zappone et al., 2000; Uchikawa et al., 2003; Ferri et al., 2004) (Fig. 2A). To assess whether the 0.4 kb N2 enhancer might be sufficient to direct sox2 expression in human forebrain neural stem and progenitor cells, we subcloned it upstream of a β-globin basal promoter, 5′ to an EGFP reporter. The resulting cassette, E/sox2(0.4):P/βglobin: EGFP:polyA, was subcloned into the pENTR/D plasmid vector (Fig. 2B). The expression and phenotypic specificity of the resultant E/sox2(0.4):P/βglobin:EGFP:polyA (hereafter referred to as E/sox2:EGFP) was assessed in dissociated human fetal forebrain cells, by plasmid transfection, followed by immunolabeling for sox2 and nestin. E/sox2:EGFP was observed in immature neural populations (Fig. 2C,D) that coexpressed both sox2 and nestin immunoreactivity. On that basis, we next sought to increase transduction efficiency, by generating an adenoviral vector containing the E/sox2-P:EGFP expression cassette. Adenoviral E/sox2:P/βglobin-EGFP:polyA (AdE/sox2:EGFP) was thereby generated in 293A cells, then titered in primary human fetal neural cells. Dissociates of the human fetal forebrain were then infected with AdE/sox2:EGFP, over a range of 1–50 moi. A standard dose of 5 moi was chosen on the basis of achieving efficient transduction efficiency with no evident toxicity. After EGFP expression 3–5 d later, the cells were then fixed with 4% paraformaldehyde. Immunolabeling confirmed the expression of sox2 protein (Fig. 2E), as well as both nestin and musashi-1 (Fig. 2F,G), by 95–100% of E/sox2:EGFP+ cells. In addition, an average of 31.9 ± 3.0% of E/sox2:EGFP+ cells coexpressed GFAP (Fig. 2H); these latter cells typically exhibited a radial glial morphology, suggesting the radial cell phenotype of a fraction of the sox2-defined pool. Together, these data indicate that the 0.4 kb upstream enhancer of the sox2 gene identifies a sox2+/nestin+/musashi+/GFAP± neural population from the developing human brain.
Figure 2.
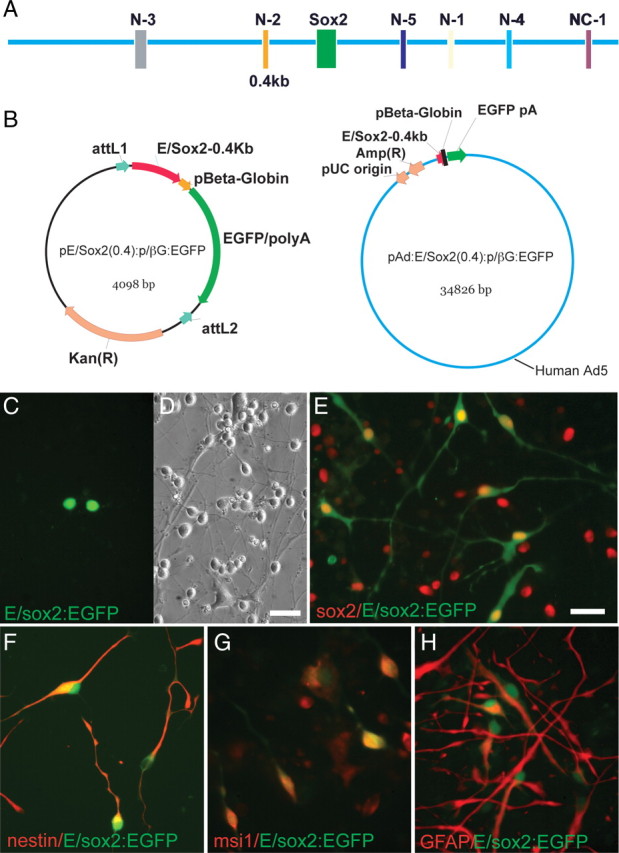
A 0.4 kb sox2 neuroepithelial core enhancer identifies human neural progenitor cells. A, Schematic of sox2 gene coding region and its upstream and downstream regulatory elements. The N2 region is a conserved POU binding domain located upstream of the Sox2 gene, which acts as a core enhancer that specifies sox2 expression to both mouse and chick forebrain neural stem and progenitor cells. B, The 0.4 kb neural-specific enhancer, lying 5′ to the sox2 coding region (Ferri et al., 2004), was subcloned into pENTR/D and subsequently into pAd/PL-DEST, so as to generate both plasmid and adenoviral vectors containing E/sox2:P/β-globin:EGFP:pA. C, D, E/sox2:EGFP+ cells, 3 d after transfection of an unsorted dissociate with plasmid cDNA encoding E/sox2:P/βglobin:EGFP. E–H, Expression of E/sox2:EGFP in cultured VZ/SVZ neural progenitor cells (NPCs) after infection with AdE/sox2-0.4:P/β-globin:EGFP. E, Virtually all E/sox2:EGFP+ cells (green) express sox2 immunoreactivity (red), indicating that the 0.4 kb sox2 neural enhancer drives EGFP expression in these cells. F, G, Essentially all E/sox2:EGFP+ cells (green) coexpress the neural progenitor markers nestin (F) and musashi1 (G) (red). H, Approximately one-third of E/sox2:EGFP+ cells (green) expressed immunodetectable GFAP (red); these sox2+/GFAP+ cells typically exhibited a radial glial morphology in vitro. Scale bars: D (for C, D), E (for E–H), 25 μm.
Sox2+ NSCs can be isolated by AdE/Sox2:EGFP-based FACS
To isolate sox2+ cells from the larger forebrain population, we next infected dissociated VZ/SVZ with AdE/sox2:EGFP, and then used FACS to extract the E/sox2:EGFP+ cell fraction. To this end, we exposed fresh dissociates of 13–21 week g.a. human fetal forebrain VZ/SVZ to 5 moi of adenovirus at a titer of 2 × 10¹¹/ml. Positive and negative sort controls were also infected, with AdCMV:EGFP or AdCMV:lacZ, respectively. At 16 weeks and beyond, the VZ/SVZ were dissected free of the overlying IZ and cortical mantle, the border of the SVZ and intermediate zone presenting a definable border on gross examination. For the 13–15 wk g.a. samples, this border was not distinct, resulting in less discrete dissections.
Within 2 d of infection, a fraction of AdE/sox2:EGFP-infected cells were noted to express EGFP, indicating their transcriptional activation of the sox2 enhancer. At 5 d, these cultures were subjected to FACS, using matched cultures of AdCMV:lacZ-infected or uninfected cells to establish gating thresholds (Fig. 3A,B). Cytometry revealed that the incidence of E/sox2:EGFP+ cells in these samples averaged 4.3 ± 0.79%, when pooled across all samples (13–21 wk g.a., n = 21; mean ± SD) (Fig. 3C,D). To correct for the transduction efficiency of adenoviral E/sox2:EGFP infection, the transduction efficiency of their AdCMV:EGFP-infected positive controls was assessed by flow cytometry at 5 d, at matched viral exposures of 5 moi. These controls revealed that 40.3 ± 7.1% of AdCMV:GFP-exposed cells were GFP+; no toxicity whatsoever was observed at this dose. The absolute incidence of E/sox2:EGFP+ cells in each preparation was then estimated by multiplying the E/sox2:EGFP+ incidence by the resultant correction factor of 1/0.403 = 2.48, yielding an average net incidence of E/sox2:EGFP+ cells, across gestational ages, of 10.7%. Interestingly, no significant difference was noted in the incidence of E/sox2:EGFP+ cells as a function of gestational age, over the age range examined.
Figure 3.

Sox2+ NPCs can be isolated and enriched using AdE/sox2:EGFP-based FACS. A–D, Human fetal NPCs were sorted after their infection by AdE/sox2:EGFP. A, B, The FACS gating threshold was set using nontransduced fetal VZ/SVZ cells as a nonfluorescent control. C, D, E/sox2:EGFP+ cells were sorted based on their expression of EGFP (P5 region), while E/sox2:EGFP− cells were collected as the nonfluorescent population (P4). Infection of cells with a control virus, AdP/CMV:lacZ, revealed no significant autofluorescence (not shown). E–H, Live E/sox2:EGFP+ and E/sox2:EGFP− cells, imaged 2 h after sort. Virtually every cell in the EGFP+ P5 gate expressed detectable fluorescence, while none of the cells in the EGFP− P4 gate did so. Scale bar: E–H, 30 μm.
Microscopy confirmed that 2 h after FACS, virtually all sox2-sorted cells expressed EGFP fluorescence (Fig. 3E,F); in contrast, only rare EGFP+ cells were visualized in the E/sox2:EGFP− fraction, and none were ever seen in uninfected controls (Fig. 3G,H). Immunolabeling confirmed that immediately after FACS, 85.3 ± 1.8% of the E/sox2:EGFP+ cells expressed detectable sox2-immunoreactivity, while only 20.5 ± 4.7% and 35.7 ± 5.2% of sox2:EGFP-depleted and -unsorted cells, respectively, did so (Fig. 4A,D,E) (n = 3 experiments; >3500 cells scored). Similarly, whereas 65.9 ± 2.1% of E/sox2:EGFP+ cells expressed the neuroepithelial filament nestin, only 16.9 ± 2.9% and 31.7 ± 1.8% of the sox2:EGFP-depleted and -unsorted cells, respectively, coexpressed nestin (Fig. 4B,F,G). By 3 d after FACS, E/sox2:EGFP+ cells almost uniformly expressed sox2 immunoreactivity (95.0 ± 1.05%), while all coexpressed both nestin (100 ± 0%) and musashi1 (100 ± 0%); in addition, approximately one-third immunolabeled as GFAP+ (31.9 ± 3.02%) (n = 3) (Fig. 4C,H,I). These results indicate that AdE/sox2:EGFP-based FACS isolates a neural progenitor population that uniformly coexpress the neural stem and progenitor cell markers sox2, nestin, and musashi1.
Figure 4.

AdE/Sox2:EGFP+ cells coexpress other neural progenitor and stem cell antigens. A, B, When immunostained immediately (2 h) after AdE/sox2:EGFP-based FACS, EGFP+ cells expressed sox2 protein (A), as well as nestin (B). C, By 3 d after FACS, E/sox2:EGFP+ cells almost uniformly expressed sox2, musashi1, and nestin, while approximately one-third of the population expressed GFAP. D–K, Corresponding immunofluorescent (top row) and phase (bottom row) images of E/sox2:EGFP+ cells immunostained for sox2 (D, E), nestin (F, G), musashi-1 (H, I), and GFAP (J, K), at 3 d after FACS. Scale bar: D–K, 50 μm.
E/sox2:EGFP-sorted human neural progenitors are clonogenic and self-renewing
To assess the clonogenicity of sox2+ cells, E/sox2:EGFP+-sorted cells and their EGFP− remainders were next raised in low-density, serum-free, EGF-, LIF-, and FGF2-supplemented suspension culture, and their production of neurospheres was quantified. By way of comparison, matched cultures of unsorted and EGFP− cells were also included. Sorted cells were seeded at 50,000–100,000 cells/ml (Fig. 5A,B), and were cultured in suspension to yield primary neurospheres, which were then redissociated and passaged to generate secondary spheres. The E/sox2:EGFP+ cells generated small neurospheres as early as 2–3 d after sort (Fig. 5C,D), while E/sox2:EGFP− cells largely remained as single cells or died in the depleted media. Within the 2 weeks thereafter, E/sox2:EGFP+ cells formed larger neurospheres (Fig. 5E–H), in contrast to EGFP− cells, which formed smaller spheres slowly if at all, while exhibiting ongoing death. At 2 weeks, the mean number of neurospheres generated from the E/sox2:EGFP+ and E/sox2:EGFP− fractions were 71.9 ± 22.4 and 12.9 ± 0.3 per 105 plated cells, respectively; sixfold more neurospheres were generated in the E/sox2:EGFP+ pool than in its E/sox2-depleted remainder (p = 0.058, n = 3) (Fig. 5I). The E/sox2:EGFP+ neurospheres continued to express EGFP for at least 4 weeks, though the intensity of EGFP gradually weakened over time (not shown). Neurospheres derived from E/sox2:EGFP+ cells were readily maintained >6 months, with monthly passages. The number of neurospheres arising from E/sox2:EGFP+ cells rose from 90 ± 13/105 cells at first passage, to 476 ± 185/105 at passage 3 (Fig. 5J); serial expansion slowed thereafter, yet 151 ± 30 neurospheres were still generated per 105 cells at 5 months in vitro.
Figure 5.

E/sox2:EGFP+ cells give rise to self-renewing neurospheres in sustained culture. A–H, E/Sox2:EGFP+ cells isolated from human forebrain VZ/SVZ (16–17 weeks g.a.) initiated neurospheres rapidly after FACS. A, B, Single E/sox2:EGFP+ cells 4 h after FACS, then as seen at 2 d (C, D), 4 d (E, F), and 15 d (G, H) after FACS. No such rapid initiation of neurospheres was observed in the E/sox2:EGFP− fractions, though low numbers were observed to arise in some cultures by 2 weeks in vitro (not shown); these likely reflected the occasional false-negative FACS assignment, of sox2+ cells sorted into the E/sox2:GFP− fraction, as well as the incomplete infection of the initial dissociates by the adenoviral E/sox2:EGFP vector. Of note, most E/sox2:EGFP+ cells remained fluorescent for at least 4 weeks after FACS, though their intensity of EGFP expression weakened with time thereafter. I, The mean number of neurospheres per 100,000 plated cells generated in E/sox2:EGFP+ and E/sox2:EGFP− populations was determined 2 weeks after FACS. J, E/sox2:EGFP+-derived neurospheres were maintained in vitro for 6 months, during which the incidence of neurospheres appeared to peak at 3 months. Scale bar: A–H, 100 μm.
E/sox2:EGFP+ cells are multipotential
To define the lineage potential of E/sox2:EGFP+ cells, neurospheres sampled from serial monthly passages, taken over a 5 month period in vitro, were switched from serum-free conditions to conditions encouraging phenotypic differentiation. The latter included passage onto a laminin substrate in media supplemented with 1% FBS, in which the cultures were maintained for 10 d, then fixed and immunostained for neuronal and glial markers. Both βIII-tubulin+ neurons and GFAP+ astrocytes were generated from single spheres, with smaller numbers of O4+ oligodendrocytes (Fig. 6A–D). With serial passage, robust multilineage cell genesis persisted, but a progressively lower ratio of neurons to astrocytes was observed. Thus, whereas at the third monthly passage (P3), 56.1 ± 9.8% (mean ± SD) of cells expressed neuronal βIII-tubulin and 19.5 ± 3.7% expressed astrocytic GFAP, by P6, 44.5 ± 14.4% of cells expressed βIII-tubulin and 23.8 ± 6.9% were GFAP+. Though the fall in the ratio of neurons to glia was slowly progressive over time, it was nonetheless significant (p = 0.002). Although oligodendrocyte generation in this 1% FBS-supplemented media was less common, such that <2% of the E/sox2:EGFP-generated progeny typically expressed oligodendrocytic O4, at least some O4+ cells were nonetheless identified throughout serial passage (Fig. 6D). Thus, when allowed to differentiate in serum-supplemented media, E/sox2:EGFP-derived neurospheres uniformly generated both neurons and glia, reflecting the multilineage potential of their E/sox2:EGFP+ founders. Together, these results indicate that E/sox2:EGFP+-based selection significantly enriches the population of self-renewing neural progenitor cells derivable from the fetal human brain, and that the E/sox2:EGFP+-cells thereby isolated are capable of sustained expansion with preserved multilineage competence.
Figure 6.

E/sox2:EGFP+ NSCs give rise to neurons and glia upon differentiation in vitro. A, E/sox2:EGFP+ cells were differentiated in DMEM/F12/1% FBS at passage 1. The resultant progeny included both neurons (βIII-tubulin, red) and astrocytes (GFAP, green). B–D, At passage 3, E/sox2:EGFP+ cells still readily differentiated into neurons and astrocytes (B, C), as well as O4-defined oligodendrocytes (D). Scale bars: A, C, D, 50 μm; B, 100 μm.
E/sox2:EGFP+ cells express telomerase and maintain long telomeres
In both embryonic and somatic stem cell populations, the telomerase enzymatic complex functions to sustain telomeric length and hence mitotic competence, by counteracting the division-associated erosion of telomeres (Harley et al., 1990; Allsopp et al., 1992). As stem cells differentiate into restricted lineages, the transcription of hTERT, the rate-limiting component of the telomerase complex, falls. Their telomerase enzymatic activity quickly follows suit, as a result of which their telomeres predictably shorten with further division (Harley et al., 1990). Thus, stem cells are characterized by active hTERT transcription, and hence hTERT promoter activation, which is associated with robust telomerase enzymatic activity, as typically assessed by the TRAP assay. In contrast, most stably differentiated somatic cells lack telomerase activity, as a result of which their telomeres are shorter than those found in stem cells, having receded in inverse proportion to the number of divisions experienced by the cells (Wright and Shay, 2005).
Since E/sox2:EGFP+ cells are both self-renewing and multipotential upon their initial isolation from human fetal brain tissue, we asked whether E/sox2:EGFP-based FACS might enrich telomerase-expressing neural stem cells, and hence telomerase activity, from the larger population of brain cells. To test this hypothesis, telomerase enzymatic activity was examined after FACS in E/sox2:EGFP+ and E/sox2:EGFP− populations, using the TRAP assay (Wright et al., 1995; Herbert et al., 2006). After E/sox2:EGFP+ and EGFP− populations were isolated from the VZ tissue of human fetal forebrain, their telomerase activities were assessed and compared to those of their parental VZ dissociates, after protein extraction. The TRAP-assessed telomerase activity was markedly higher in E/sox2:EGFP+ cells (23.9 units) than in their E/sox2:EGFP− (9.6 units) counterparts (Fig. 7A,B). Unlike the substantial differences in telomerase enzymatic activity, telomeric length did not differ between the sox2+ and sox2− pools. Instead, the telomere length assay (TLA) (Roy et al., 2007) revealed that the maximal length of telomeres of the E/sox2:EGFP+ sorted cells and their depleted remainder were approximately equivalent, at 15–17 kb (Fig. 7B). Yet given the early gestational age sampled here, and the slow decline in telomeric length after telomerase activity ceases, it is not surprising that we failed to note significant telomeric erosion in the sox2− pool, which is still mitotically active at this point in ontogeny.
Figure 7.

E/sox2:EGFP+ NSCs exhibit telomerase activity and maintain long telomere length. A, Telomerase enzymatic activity was examined in the purified E/sox2:EGFP+ and E/sox2:EGFP− populations by TRAP assay. CHAPS lysis buffer, a negative control, was substituted for a cell extract to check for primer-dimer PCR artifacts and/or PCR product carry-over contamination. TSR8 is a quantification standard that estimates the total product generated, expressed in relative terms as TPG units. Telomerase enzymatic activity was significantly higher in E/sox2:EGFP+ cells (23.9 units in this run) than in matched E/sox2:EGFP− cells (9.6 units). Telomerase-positive control cells (PCC; included in the TRAPeze kit) were included as standardization controls (116.9 units). B, Telomeric lengths were examined in the purified E/sox2:EGFP+ and E/sox2:EGFP− populations, by TLA. Freshly isolated E/sox2:EGFP+ cells exhibited telomeric lengths of 15–17 kb (mean, 16.3 kb), which did not significantly differ from those of E/sox2:EGFP− cells (mean, 15.9 kb) at this relatively early gestational stage.
E/sox2:EGFP+ cells express genes typifying neural stem and progenitor cell phenotype
To establish the genotype of human fetal sox2+ cells, we used Affymetrix microarrays to compare the gene expression patterns of AdE/sox2:EGFP+ cells to their corresponding EGFP− remainder, as well as to unsorted VZ/SVZ, using four forebrain samples derived from 16–19 weeks g.a. fetuses. The total RNAs of E/sox2:EGFP+ and E/sox2:EGFP− cells, as well as that of their parental VZ/SVZ tissues, were extracted, amplified, and analyzed with Affymetrix U133-Plus 2 arrays. A total of four matched sets of each of these three groups (sox2+, sox2−, and VZ/SVZ) were thus examined, for a total of 12 microarrays. Among 31,444 represented probe sets detected as present on at least one of the 12 chips, 10,012 were differentially expressed by one-way ANOVA (5% FDR). Using a fourfold difference cutoff (defined as significant by t test, at 5% FDR), we found that among these transcripts, 2187 were differentially expressed by E/sox2:EGFP+ cells relative to E/sox2:EGFP− cells, and 2285 by E/sox2:EGFP+ cells relative to the VZ/SVZ tissue from which they derived. Subsequent Venn analysis revealed 1342 probe sets that were differentially expressed by E/sox2:EGFP+ cells relative to both E/sox2:EGFP− cells and VZ tissue (Fig. 8A). Of these, 706 were upregulated, which were annotated to 492 unique genes; 636 were downregulated, representing 411 unique annotations. Gene Ontology analysis of these transcripts revealed functionally related sets of differentially expressed genes, as summarized in Table 1, with the complete list provided in supplemental Table 2 (available at www.jneurosci.org as supplemental material), as well as at http://www.urmc.rochester.edu/ctn/goldman-lab/supplemental-data.cfm.
Figure 8.

E/sox2:EGFP+ VZ/SVZ stem and progenitor cells express a transcript signature distinct from E/sox2:EGFP− cells. A, Following one-way ANOVA, sorted cell fractions and VZ/SVZ tissue RNA profiles were compared by post hoc t test and differentially expressed genes identified at 5% FDR and more than fourfold change between groups. The numbers of significantly different genes between comparisons were then plotted on a Venn diagram. Many more differentially expressed genes were found between E/sox2:EGFP+ cells to either E/sox2:EGFP− cells or tissue, than between E/sox2:EGFP− cells and tissue. The degree of overlap between sox2+ and either sox2-depleted or tissue was large, with >60% of genes shared. B, Bar graph of cell type-selective gene expression by E/sox2:EGFP+ cells. Expression ratios were calculated following normalization against the E/sox2:EGFP-depleted cells. E/sox2:EGFP+ cells expressed high levels of neuroepithelial progenitor and radial glial or astroglial associated transcripts. In contrast, expression of proneural and neuronal transcripts was significantly depleted from E/sox2:EGFP+ cells. Markers of glial progenitor and oligodendrocyte lineage cells were not enriched in E/sox2:EGFP+ cells. * indicates more than fourfold change and significance at 5% FDR, in transcript levels of E/sox2:EGFP+ and E/sox2:EGFP− cells.
Table 1.
Significantly enriched genes in E/sox2:EGFP+ relative to E/sox2:EGFP− cells
| Type | Symbol | Description | Ratio | p value |
|---|---|---|---|---|
| Ligand | GPNMB | Glycoprotein (transmembrane) nmb | 24.01 | 4.40 × 10⁻³ |
| S100A6 | S100 calcium binding protein A6 | 19.25 | 2.42 × 10⁻² | |
| AGTR1 | Angiotensin II receptor, type 1 | 18.37 | 1.17 × 10⁻⁴ | |
| NOG | Noggin | 16.59 | 3.75 × 10⁻³ | |
| ADM | Adrenomedullin | 13.08 | 1.92 × 10⁻³ | |
| Receptor | ELTD1 | EGF, latrophilin and seven transmembrane domain containing 1 | 33.92 | 3.94 × 10⁻³ |
| FZD10 | Frizzled 10 | 33.20 | 9.80 × 10⁻⁶ | |
| LY96 | Lymphocyte antigen 96 | 24.07 | 2.17 × 10⁻² | |
| CFI | Complement factor I | 20.74 | 1.54 × 10⁻² | |
| F2RL2 | Coagulation factor II (thrombin) receptor-like 2 | 18.93 | 1.48 × 10⁻³ | |
| TRPM3 | Transient receptor potential cation channel, subfamily M, member 3 | 18.92 | 4.68 × 10⁻⁵ | |
| ECM/cell adhesion | LUM | Lumican | 22.66 | 9.43 × 10⁻⁴ |
| ADAMTS9 | ADAM metallopeptidase with thrombospondin type 1 motif, 9 | 16.34 | 1.10 × 10⁻³ | |
| ADAMTS1 | ADAM Metallopeptidase with thrombospondin type 1 motif, 1 | 13.94 | 1.57 × 10⁻⁶ | |
| ITGB5 | Integrin, β5 | 12.45 | 3.82 × 10⁻⁴ | |
| CD99 | CD99 molecule | 11.84 | 1.06 × 10⁻⁴ | |
| Enzymes/catalytic | RAP1A | RAP1A, member of RAS oncogene family | 29.74 | 1.38 × 10⁻³ |
| LEPREL1 | Leprecan-like 1 | 23.50 | 4.00 × 10⁻⁴ | |
| NQO1 | NAD(P)H dehydrogenase, quinone 1 | 20.83 | 9.90 × 10⁻⁴ | |
| ATP10B | ATPase, Class V, type 10B | 19.90 | 3.95 × 10⁻⁵ | |
| THSD4 | Thrombospondin, type I, domain containing 4 | 16.31 | 2.27 × 10⁻⁵ | |
| Transcription factor | TAF7L | TAF7-like RNA polymerase II, TATA box binding protein (TBP)-associated factor, 50 kDa | 13.32 | 7.26 × 10⁻⁴ |
| PBXIP1 | Pre-B-cell leukemia homeobox interacting protein 1 | 10.54 | 9.62 × 10⁻⁵ | |
| CSDA | Cold shock domain protein A | 8.95 | 8.53 × 10⁻⁵ | |
| RREB1 | Ras-responsive element binding protein 1 | 8.60 | 2.06 × 10⁻² | |
| ZIC1 | Zic family member 1 (odd-paired homolog, Drosophila) | 8.46 | 2.58 × 10⁻³ | |
| Other/novel | SLC1A3 | GLAST | 25.01 | 1.70 × 10⁻³ |
| PIWIL1 | Piwi-like 1 (Drosophila) | 23.63 | 4.28 × 10⁻⁴ | |
| FAM148A | Family with sequence similarity 148, member A | 22.13 | 2.25 × 10⁻³ | |
| S100A11 | S100 calcium-binding protein A11 (calgizzarin) | 20.50 | 2.97 × 10⁻⁴ | |
| LOC284454 | Hypothetical protein LOC284454 | 20.35 | 9.60 × 10⁻⁵ |
Significantly enriched genes were identified following one-way ANOVA and post hoc t test (>4-fold change, 5% FDR cut-offs). Four hundred ninety-two unique genes were significantly overexpressed in E/sox2:EGFP+ relative to both E/sox2:EGFP− and VZ/SVZ tissue. These genes were annotated into functionally relevant categories. The top five from each category are shown in the table. The full list, with gene ID numbers, is available in supplemental Table 2 (available at www.jneurosci.org as supplemental material). The ratio of gene expression by E/sox2+ cells relative to E/sox2− cells is shown, along with the corrected t test q value.
The gene expression pattern of the E/sox2:EGFP+ cells differed significantly from that of E/sox2:EGFP− cells, as well as from that of the parental VZ/SVZ from which each derived. In contrast, the expression patterns of the sox2− pool and VZ tissue largely overlapped (Fig. 8A). E/sox2:EGFP+ cells expressed a number of known NSC genes, such as nestin (eightfold enriched relative to VZ/SVZ tissue, and sevenfold higher than in E/sox2:EGFP− cells) and PROM1/CD133 (4.4-fold higher in E/sox2:EGFP+ cells than in parental VZ). Sox2 mRNA was 3.4-fold and 1.8-fold higher in the E/sox2:EGFP+ pool than in the E/sox2:EGFP− cells and VZ/SVZ, respectively. Moreover, the other members of the sox B1 subgroup, SOX1 and SOX3, were expressed 2.0- and 8.2-fold higher in E/sox2:EGFP+ than in E/sox2:EGFP− cells, just as PAX6 was 4.1- and 5.5-fold higher in E/sox2:EGFP+ than in E/sox2:EGFP− cells or VZ/SVZ tissue, respectively (Table 2, Fig. 8B). In addition, the radial glial transcripts GLAST (SLC1A3) and BLBP (FABP7) were both differentially overexpressed by E/sox2:EGFP+ cells, consistent with the progenitor phenotype of radial cells and the observed coexpression of these transcripts in neurogenic radial cells (Ghashghaei et al., 2007; Suh et al., 2007). Similarly, GFAP mRNA was fivefold higher in E/sox2:EGFP+ than E/sox2:EGFP− cells, consistent with the expression of GFAP by murine neural stem and progenitor cells (Doetsch et al., 1999; Garcia et al., 2004). Together, these data suggest that sox2-directed isolation selects a discrete population of cells that express transcripts typifying neural progenitor phenotype.
Table 2.
Marker gene expression profile of E/sox2:EGFP+ cells
| Category | Gene | Sox2+ relative to Sox2− |
Sox2+ relative to tissue |
||
|---|---|---|---|---|---|
| Array | qPCR | Array | qPCR | ||
| Neuroepithelial | NES | 7.1 (p = 4.01 × 10⁻³) | 7.9 (p = 3.94 × 10⁻²) | 8.1 (p = 6.06 × 10⁻⁵) | 6.0 (p = 6.27 × 10⁻³) |
| SOX1 | 2.0 (p = 1.68 × 10⁻¹) | 1.4 (p = 6.85 × 10⁻²) | |||
| SOX2 | 3.4 (p = 3.19 × 10⁻²) | 2.9 (p = 1.57 × 10⁻¹) | 1.8 (p = 5.68 × 10⁻²) | 1.6 (p = 3.38 × 10⁻²) | |
| SOX3 | 8.2 (p = 5.56 × 10⁻³) | 6.9 (p = 1.07 × 10⁻¹) | |||
| PAX6 | 4.1 (p = 2.50 × 10⁻⁵) | 3.5 (p = 4.73 × 10⁻²) | 5.5 (p = 1.20 × 10⁻¹) | 4.9 (p = 2.01 × 10⁻¹) | |
| PROM1 | 2.0 (p = 1.39 × 10⁻¹) | 1.6 (p = 4.05 × 10⁻¹) | 4.4 (p = 3.29 × 10⁻²) | 4.0 (p = 1.12 × 10⁻¹) | |
| Proneural | DLX1 | 0.1 (p = 1.71 × 10⁻²) | 0.2 (p = 1.43 × 10⁻¹) | ||
| DLX2 | 0.1 (p = 2.79 × 10⁻²) | 0.2 (p = 1.44 × 10⁻¹) | |||
| DLX5 | 0.3 (p = 6.32 × 10⁻²) | 0.4 (p = 1.66 × 10⁻¹) | |||
| DLX6 | 0.1 (p = 1.16 × 10⁻²) | 0.0 (p = 4.98 × 10⁻²) | |||
| Neuronal | NSE | 0.6 (p = 1.05 × 10⁻²) | 0.7 (p = 1.28 × 10⁻¹) | ||
| ELAVL4 | 0.2 (p = 1.10 × 10⁻⁴) | 0.0 (p = 1.41 × 10⁻³) | 0.3 (p = 2.81 × 10⁻⁴) | 0.0 (p = 1.50 × 10⁻³) | |
| ELAVL3 | 0.2 (p = 1.21 × 10⁻⁴) | 0.3 (p = 1.17 × 10⁻³) | |||
| SNAP25 | 0.2 (p = 4.32 × 10⁻⁴) | 0.2 (p = 4.13 × 10⁻⁴) | |||
| DCX | 0.2 (p = 3.08 × 10⁻³) | 0.2 (p = 2.29 × 10⁻³) | |||
| Astroglial/ | AQP4 | 27.1 (p = 2.76 × 10⁻³) | 6.1 (p = 2.01 × 10⁻¹) | 4.0 (p = 4.36 × 10⁻¹) | 7.6 (p = 4.54 × 10⁻¹) |
| radial glial | FABP7 | 2.8 (p = 6.22 × 10⁻³) | 1.2 (p = 6.22 × 10⁻¹) | 3.6 (p = 1.09 × 10⁻¹) | 2.4 (p = 2.11 × 10⁻¹) |
| SLC1A3 | 25.0 (p = 1.70 × 10⁻³) | 3.8 (p = 5.26 × 10⁻²) | 77.5 (p = 8.48 × 10⁻³) | 3.0 (p = 2.09 × 10⁻¹) | |
| GFAP | 5.0 (p = 2.40 × 10⁻²) | 6.4 (p = 6.50 × 10⁻²) | 1.6 (p = 5.96 × 10⁻¹) | 1.0 (p = 9.84 × 10⁻¹) | |
| CD44 | 16.4 (p = 1.77 × 10⁻⁵) | 12.0 (p = 6.26 × 10⁻³) | 9.0 (p = 8.53 × 10⁻³) | 5.4 (p = 7.03 × 10⁻²) | |
| TNC | 4.3 (p = 5.52 × 10⁻⁴) | 7.2 (p = 2.59 × 10⁻²) | |||
| Glial Progenitor | OLIG2 | 1.2 (p = 7.81 × 10⁻¹) | 14.7 (p = 1.05 × 10⁻¹) | 2.1 (p = 2.67 × 10⁻¹) | 4.0 (p = 3.82 × 10⁻¹) |
| PDGFRA | 1.5 (p = 4.53 × 10⁻¹) | 0.7 (p = 5.01 × 10⁻¹) | 3.7 (p = 7.36 × 10⁻²) | 2.2 (p = 3.63 × 10⁻²) | |
| ST8SIA1 | 1.8 (p = 7.74 × 10⁻³) | 1.0 (p = 9.69 × 10⁻¹) | 1.7 (p = 2.92 × 10⁻¹) | 0.3 (p = 8.87 × 10⁻²) | |
| CSPG4 | 1.9 (p = 5.32 × 10⁻¹) | 1.7 (p = 8.36 × 10⁻¹) | 0.8 (p = 8.06 × 10⁻¹) | 0.1 (p = 5.62 × 10⁻²) | |
| SOX10 | 0.6 (p = 5.69 × 10⁻¹) | 0.2 (p = 3.91 × 10⁻¹) | 1.5 (p = 3.92 × 10⁻¹) | 0.1 (p = 2.44 × 10⁻¹) | |
| Oligodendrocyte | MBP | 7.8 (p = 3.88 × 10⁻²) | 1.7 (p = 6.54 × 10⁻¹) | ||
| PLP1 | 3.2 (p = 3.29 × 10⁻²) | 1.1 (p = 8.93 × 10⁻¹) | |||
| CNP | 2.0 (p = 8.16 × 10⁻³) | 3.2 (p = 1.21 × 10⁻³) | |||
| QKI | 3.0 (p = 2.08 × 10⁻²) | 2.8 (p = 1.76 × 10⁻²) | |||
| MOG | 0.7 (p = 2.69 × 10⁻²) | 1.2 (p = 4.92 × 10⁻¹) | |||
| MOBP | 0.5 (p = 2.65 × 10⁻¹) | 0.5 (p = 3.58 × 10⁻¹) | |||
| NKX6–2 | 0.6 (p = 3.60 × 10⁻¹) | 3.5 (p = 2.50 × 10⁻¹) | |||
| Microglial | CD68 | 0.8 (p = 7.76 × 10⁻¹) | 0.8 (p = 7.62 × 10⁻¹) | 0.7 (p = 7.56 × 10⁻¹) | 0.4 (p = 2.49 × 10⁻¹) |
| CD36 | 4.7 (p = 2.60 × 10⁻²) | 1.5 (p = 5.41 × 10⁻¹) | |||
| Endothelial | CDH5 | 0.7 (p = 1.27 × 10⁻¹) | 0.3 (p = 2.16 × 10⁻⁴) | ||
| TEK | 0.5 (p = 3.88 × 10⁻¹) | 0.4 (p = 3.32 × 10⁻¹) | |||
The microarray profiles of E/sox2:EGFP-sorted cells were compared to the depleted population (E/sox2:EGFP−) and to the tissue from which they derived. The ratio and p value are shown for each selected gene. Significantly regulated genes are indicated in bold. For those genes with multiple probe sets, data are presented from only the most significant probe set. To validate the array data, real-time Taqman RT-PCR was performed using a 96-gene microfluidics card. The expression of each gene was normalized to GAPDH, and p values were calculated on ΔCt values. There is very close agreement of array and qPCR data (r2 = 0.69, p < 0.0001). We note that E/sox2:EGFP+ cells express markers of neuroepithelial/neural stem cells and radial glial or astroglial markers yet are depleted of all proneural and neuronal markers examined.
In contrast, E/sox2:EGFP+ cells were relatively depleted in genes typical either of terminally differentiated neurons and glia or of their phenotypically committed progenitors. For instance, the DLX genes, ASCL1, and the mature neuronal markers ELAVL4 (HuD) and MAP2 were all depleted in E/sox2:EGFP+ cells, and were instead overexpressed within the corresponding E/sox2:EGFP− fractions (Tables 2 and 3). Similarly, no markers typically expressed by mature oligodendrocytes were differentially expressed by E/sox2:EGFP+ NSCs (Table 2, Fig. 8B). Together, these data indicate that E/sox2:EGFP+ cells exhibit a gene expression signature typical of neural stem cells.
Table 3.
Pathway-specific transcript expression by E/sox2:EGFP-sorted cells
| Category | Gene | Sox2+/Sox2− ratio |
|
|---|---|---|---|
| Array | qPCR | ||
| Growth factors/receptors | FGF2 | 3.1 (p = 4.90 × 10⁻⁴) | 8.7 (p = 6.83 × 10⁻²) |
| FGFR1 | 2.6 (p = 3.19 × 10⁻³) | ||
| LIFR | 6.8 (p = 2.89 × 10⁻⁴) | 2.7 (p = 5.09 × 10⁻¹) | |
| NOG | 16.6 (p = 3.75 × 10⁻³) | 11.8 (p = 3.95 × 10⁻²) | |
| EGF | 9.9 (p = 1.43 × 10⁻⁴) | 13.6 (p = 8.29 × 10⁻³) | |
| EGFR | 4.4 (p = 2.71 × 10⁻²) | ||
| BMP2R | 0.4 (p = 1.09 × 10⁻³) | ||
| Notch pathway | NOTCH1 | 3.4 (p = 3.59 × 10⁻³) | 4.0 (p = 1.63 × 10⁻¹) |
| NOTCH2 | 4.5 (p = 1.74 × 10⁻³) | 5.8 (p = 3.45 × 10⁻²) | |
| NOTCH3 | 8.4 (p = 4.32 × 10⁻³) | 14.4 (p = 5.53 × 10⁻²) | |
| HES1 | 8.7 (p = 1.71 × 10⁻⁴) | 5.6 (p = 3.07 × 10⁻³) | |
| HES5 | 2.6 (p = 2.25 × 10⁻¹) | 1.9 (p = 4.81 × 10⁻¹) | |
| JAG1 | 3.3 (p = 1.50 × 10⁻³) | 5.0 (p = 7.82 × 10⁻²) | |
| DLL1 | 0.4 (p = 1.94 × 10⁻²) | 0.3 (p = 5.83 × 10⁻²) | |
| HEY1 | 2.9 (p = 8.04 × 10⁻³) | 3.7 (p = 5.66 × 10⁻²) | |
| HEY2 | 8.7 (p = 7.88 × 10⁻²) | ||
| ASCL1 | 0.4 (p = 4.46 × 10⁻²) | 0.3 (p = 1.76 × 10⁻¹) | |
| NUMB | 0.4 (p = 9.35 × 10⁻⁴) | 0.3 (p = 6.65 × 10⁻³) | |
| NEUROD2 | 0.1 (p = 2.54 × 10⁻⁵) | 0.0 (p = 1.45 × 10⁻²) | |
| NEUROD1 | 0.1 (p = 6.53 × 10⁻³) | 0.0 (p = 1.21 × 10⁻²) | |
| NEUROG1 | 0.2 (p = 6.97 × 10⁻²) | 0.8 (p = 9.27 × 10⁻¹) | |
| NEUROG2 | 0.8 (p = 8.24 × 10⁻¹) | 0.0 (p = 1.50 × 10⁻⁴) | |
| Wnt pathway | WNT5A | 0.3 (p = 1.70 × 10⁻²) | 0.1 (p = 7.36 × 10⁻⁴) |
| WNT16 | 3.6 (p = 2.69 × 10⁻²) | ||
| DKK1 | 5.4 (p = 1.66 × 10⁻³) | 14.4 (p = 2.32 × 10⁻¹) | |
| DKK3 | 9.0 (p = 1.34 × 10⁻⁵) | 7.3 (p = 1.73 × 10⁻³) | |
| FZD6 | 4.0 (p = 5.69 × 10⁻⁴) | 50.9 (p = 7.54 × 10⁻³) | |
| FZD8 | 10.4 (p = 1.46 × 10⁻⁵) | 17.6 (p = 4.60 × 10⁻²) | |
| FZD10 | 33.2 (p = 9.80 × 10⁻⁶) | 176.5 (p = 2.15 × 10⁻²) | |
| CTNNB1 | 1.3 (p = 1.46 × 10⁻¹) | ||
| APC | 0.5 (p = 9.43 × 10⁻⁴) | ||
| SHH pathway | PTCH1 | 0.2 (p = 1.43 × 10⁻²) | |
| STK36 | 1.2 (p = 2.27 × 10⁻¹) | ||
| SUFU | 2.4 (p = 7.97 × 10⁻²) | ||
| GLI2 | 2.2 (p = 1.83 × 10⁻³) | ||
| GLI3 | 4.7 (p = 3.57 × 10⁻³) | 4.9 (p = 3.67 × 10⁻²) | |
| ECM integrin | ITGB1 | 3.1 (p = 4.90 × 10⁻⁴) | 8.7 (p = 6.83 × 10⁻²) |
Representative pathway-specific genes were selected from the microarray profiles using gene set enrichment analysis and manual annotation. The expression of selected transcripts was assessed by calculating the expression ratio of E/sox2:EGFP-sorted cells to the depleted population (E/sox2:EGFP−) (n = 4 per group). The ratio and p value are shown for each selected gene. Significantly regulated genes are indicated in bold. For those genes with multiple probe sets, data are presented from only the most significant probe set. Real-time Taqman RT-PCR was performed using a 96-gene microfluidics card and normalized to GAPDH and p values calculated from ΔCt values. For the complete list, see supplemental Table 1 (available at www.jneurosci.org as supplemental material).
E/sox2:EGFP+ cells exhibit gene expression patterns indicative of mitogenic signaling
E/sox2:EGFP+ cells exhibited differential expression of a number of receptors known to be involved in neural stem and progenitor cell expansion (Table 3). FGFR1, EGFR, and LIFR were markedly overexpressed by human E/sox2:EGFP+ cells, in accord with the described actions of the fibroblast growth factors, EGF and TGFα, and LIF on these cells (Reynolds and Weiss, 1992; Vescovi et al., 1993; Morshead et al., 1994; Craig et al., 1996; Qian et al., 1997; Fallon et al., 2000; Doetsch et al., 2002; Bauer and Patterson, 2006; Bauer et al., 2007). Parametric gene set enrichment analysis of KEGG pathways (http://www.genome.jp/kegg/pathway.html) (Fig. 9A) revealed that the MAP kinase (Fig. 9B) and JAK-STAT (Fig. 10A) pathways were significantly regulated in E/sox2:EGFP+ cells (FDR-corrected q values = 0.023 and q = 0.033, respectively). In addition, E/sox2:EGFP+ cells expressed high levels of the MET receptor (13-fold higher in E/sox2:EGFP+ than E/sox2:EGFP− cells by microarray; 24-fold higher by qPCR, p = 0.0002), suggesting a possible role for the c-met ligand HGF in regulating stem and progenitor cell turnover in the human VZ/SVZ.
Figure 9.
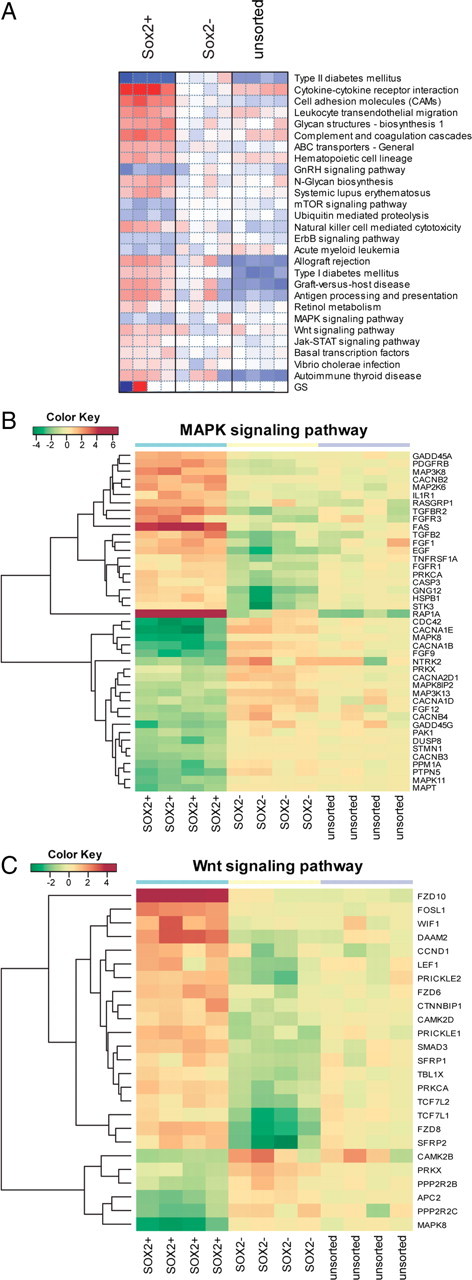
E/sox2:EGFP+ cells exhibit differential expression of pathway specific transcripts. A, Parametric gene set enrichment analysis of KEGG signaling pathways was performed on the profiles of E/sox2:EGFP-sorted (E/sox2:EGFP+), -depleted (E/sox2:EGFP−), and -unsorted VZ/SVZ dissociates (n = 4 each). Using a linear modeling approach, significant KEGG pathways were identified between E/sox2:EGFP+ and E/sox2:EGFP− cells at 5% FDR. The heat map visualization shows relative enrichment within each pathway; red indicates overexpression and blue lower expression relative to the mean of E/sox2:EGFP− profiles. B, The MAP kinase signaling pathway was significantly depleted according to KEGG pathway analysis. The heat map shows expression of those MAPK pathway genes whose expression differed significantly between E/sox2:EGFP+ and E/sox2:EGFP− cells (>3-fold change, 5% FDR). Furthermore, activators of the MAPK pathways were identified as significantly enriched in E/sox2:EGFP+ following GO-based GSEA. C, The wnt signaling pathway was significantly overexpressed in E/sox2:EGFP+ cells. As in B, the heat map shows only significant differentially expressed genes. GO-GSEA further confirmed the overrepresentation of wnt genes in E/sox2:EGFP+ cells (q < 0.05). The color key indicates relative expression on a log2 scale, with red indicating high expression and green low expression values.
Figure 10.

JAK-STAT and Notch pathway expression profiles in E/sox2:EGFP+ cells. A, Like the MAPK and wnt pathways, the JAK-STAT pathway was identified as differentially expressed in E/sox2:EGFP+ cells. This heat map shows only those members of the JAK-STAT pathway that were significantly differentially expressed in E/sox2:EGFP+ vs E/sox2:EGFP− cells (>3-fold change, 5% FDR). B, Manual analysis of differentially expressed genes identified a large number of Notch-related transcripts. See Table 3 for further details. As in Figure 9, the color key indicates relative expression on a log2 scale, with red and green indicating high- and low-level gene expression, respectively.
In this regard, it is notable that the E/sox2:EGFP+ cells prominently overexpressed not only EGFR, but also its cognate ligand EGF (13.6-fold higher in E/sox2:EGFP+ than E/sox2− cells), and did so concurrently with overexpressing the BMP inhibitors noggin (16.6-fold higher by microarray; 11.8-fold by qPCR; p = 0.04) and BAMBI (8.1-fold higher by microarray; 10.7-fold by qPCR; p = 0.0005) (Table 3; supplemental Table 2, available at www.jneurosci.org as supplemental material). Given the progliogenic roles of the BMPs, these data suggest that E/sox2-defined neural progenitors may exhibit a tonic suppression of BMP signals via a combination of BAMBI expression and noggin release, similar to the strategy of active BMP inhibition used by adult glial progenitor cells (Sim et al., 2006). By inhibiting BMP signals concurrently with autocrine EGF-signaled expansion, E/sox2:EGFP+-defined stem and progenitor cells would appear to have strong autocrine mechanisms by which to preserve their competence for undifferentiated expansion.
E/sox2:EGFP+ cells express genes suggestive of prominent wnt and notch signaling
E/sox2:EGFP+ cells also expressed several categories of transcripts associated with undifferentiated self-renewal. Foremost among these were a number of wnt pathway members, both ligands and receptors. KEGG gene set enrichment analysis showed that wnt pathway transcripts were significantly overrepresented in E/sox2:EGFP+ cells (q = 0.026) (Fig. 9C). Interestingly, hypergeometric tests on KEGG pathways further revealed that gene sets associated with colorectal cancer, small cell lung cancer, prostate cancer, and p53-regulated pathways were all differentially expressed by E/sox2:EGFP+ cells, relative to E/sox2:EGFP− cells (p < 0.05 on genes overexpressed in E/sox2:EGFP+ cells), highlighting the commonalities between self-renewal pathways in normal neuroectodermal development and cancer. In regards to individual upregulated components of the wnt pathway, our microarray data indicated that E/sox2:EGFP+ cells overexpressed wnt16, a little-studied canonical wnt ligand closely related to wnt7 (Mazieres et al., 2005), as well as the wnt family receptors FZD-6, FZD-8, and FZD-10. Indeed, FZD-10 was overexpressed by 33- and 55-fold, respectively, relative to E/sox2:EGFP− cells and VZ/SVZ tissue (Table 3). Quantitative real-time PCR confirmed the relative overexpression of these wnt receptor transcripts by E/sox2:EGFP+ cells, validating the microarray data; FZD-6, -8, and -10 mRNAs were expressed at levels respectively 50-fold, 18-fold, and 180-fold higher in E/sox2+ than E/sox2− cells (Table 3). Interestingly, E/sox2:EGFP+ cells also differentially overexpressed the wnt antagonists DKK1 (14.4-fold higher in E/sox2:EGFP+ than in E/sox2− cells) and DKK3 (7.3-fold higher), suggesting that wnt-regulated neural progenitors might be inhibited by their neighbors.
Further manual pathway analysis revealed that besides wnt pathway components, E/sox2:EGFP+ cells also selectively overexpressed gene sets indicative of active notch signaling (Fig. 10B), which has been previously implicated in the regulation of neural stem and progenitor cell self-renewal. In regards to notch pathway components, E/sox2:EGFP+ cells were found to overexpress NOTCH2, NOTCH3, HES1, and HES5, all positive activators and/or effectors of notch signaling (Table 3). Conversely, genes typically suppressed by notch receptor activation, such as NUMB and the bHLH transcription factors ASCL1 (mash1), NEUROG1 (neurogenin1), NEUROG2 (neurogenin2), NEUROD1 (neuroD1), and NEUROD2 (neuroD2), were all relatively underexpressed in E/sox2:EGFP+ cells relative to their sox2-depleted controls, again suggesting the maintenance of active notch signaling in E/sox2+ cells.
Discussion
In this report, we used a sox2 enhancer-based selection strategy to isolate and profile uncommitted neural precursor cells from the second trimester human fetal ventricular and subventricular zones. These cells expressed sox2 protein, were multilineage competent, and proved capable of sustained self-renewal in vitro, indicating their inclusion of competent neural stem cells. In addition, these E/sox2:EGFP-defined isolates sustained both telomerase transcription and enzymatic activity, in contrast to their matched E/sox2:EGFP-depleted populations, which failed to do so. Genomic analysis of the E/sox2:EGFP+ cell population and comparison to the matched unsorted and E/sox2:EGFP-depleted populations revealed that E/sox2:EGFP+ cells differentially expressed a discrete set of transcripts suggestive of active wnt, EGF, and notch pathway signaling.
Neural stem cells are defined as both multilineage competent for neurons and glia, and self-renewing. In humans, self-renewal competence is attended by sustained telomerase activity, which prevents telomeric erosion, thereby maintaining mitotic competence (Wright et al., 1996; Wright and Shay, 2005). Stem cell-derived daughter cells—which may be defined as transit amplifying progenitors, based on their mitotic expansion concurrent with departure from the ventricular zone—include restricted neuronal and glial progenitors, as well as still-multipotential progenitors, all of which may share a loss of self-renewal competence (Goldman, 2005a,b). At least in development, this loss in self-renewal is associated with a fall in the telomerase activity of neural progenitors (Ostenfeld et al., 2000). As a result, whereas a sox2− pool devoid of self-renewing stem and progenitor cells would be expected to manifest little telomerase enzymatic activity, one might anticipate that a sox2+ pool, comprised of both neural stem cells and their derived transit-amplifying progenitor cells, would exhibit sustained telomerase activity. We observed this to be the case, as telomerase enzymatic activity was robustly higher in the E/sox2:EGFP+ cells, relative to their depleted remainder of E/sox2:EGFP− cells.
This maintenance of telomerase activity by E/sox2:EGFP+ cells was associated with their corresponding differential overexpression of telomerase-dependent transcripts, among others. Indeed, E/sox2:EGFP+ cells expressed several categories of transcripts associated with both mitogenic expansion and undifferentiated self-renewal. Likely mitogenic pathways were represented largely by genes associated with the MAP kinase pathways, activators of which were significantly upregulated in E/sox2:EGFP+ cells. In particular, E/sox2:EGFP+ cells differentially expressed a number of receptor tyrosine kinases, that included the class 1, 4, and 6 receptor tyrosine kinases EGFR, FGF1/2R, and MET, respectively, each of which has been previously implicated in the expansion of neural stem and progenitor cells. Yet perhaps most striking in their degree of overexpression by E/sox2:EGFP+ cells were components of the wnt signaling pathway. Wnt ligands have been noted to comprise self-renewal signals for murine neural stem cells (Kalani et al., 2008), and may serve a similar function in human neural precursors as well. Nonetheless, we were surprised to note that in human fetal VZ/SVZ-derived E/sox2:EGFP+ cells, the most specifically and differentially overexpressed wnt ligand proved to be WNT16, a functionally obscure molecule that may signal through the canonical pathway (Mazieres et al., 2005). In addition, the wnt receptors FZD-6, FZD-8, and FZD-10 were all highly overexpressed, as were a number of wnt target genes. These overexpressed wnt targets included dickkopf3 (DKK3), follistatin (FST), Krupple-like factor 5 (KLF5), TWIST1, jagged1 (JAG1), NrCAM (NRCAM), RUNX2, autotaxin (ENPP2), and cyclin D (CCND1), among others. Several of these are of especial interest. The simultaneous overexpression of the WNT16 and FZD-6, -8, and -10 together with DKK3, an antagonist of LRP5/6 and hence of wnt signaling, suggests the possibility of autocrine wnt signaling with concurrent lateral inhibition of neighboring wnt-regulated neural progenitors.
E/sox2:EGFP-defined cells were noted to differentially express a number of other wnt target genes, a number of which may serve to modulate wnt pathway activity. For instance, the E/sox2:EGFP-overexpressed transcript NRCAM has been shown to bind and regulate the receptor tyrosine phosphatase NRCAM PTPRZ1, which is involved in both radial cell maintenance and β-catenin-dependent progenitor cell expansion, introducing yet another mechanism by which the undifferentiated self-renewal of E/sox2:EGFP+ cells might be regulated in trans. The differential upregulation of these wnt-regulated genes in E/sox2:EGFP-defined progenitors is consistent with their distinct roles in both maintaining the undifferentiated self-renewal of early neuroepithelial stem cells, and in potentiating the phenotypic diversification of both neighbors and daughter cells into differentiated derivatives.
In regards to the latter, E/sox2:EGFP+ cells were found to overexpress a number of serially activated components of the notch pathway, suggesting active notch signaling and concurrent repression of genes associated with the assumption of a differentiated fate. NOTCH2, NOTCH3, HES1, and HES5, all positive activators and/or effectors of notch signaling, were all differentially overexpressed by E/sox2:EGFP+ cells (Fig. 10B). Conversely, genes typically suppressed by notch receptor activation, such as NUMB and the bHLH transcription factors ASCL1, NEUROG1, NEUROG2, NEUROD1, and NEUROD2, were all relatively underexpressed in E/sox2:EGFP+ cells, again suggesting active notch signaling. In this regard, it is interesting to note that E/sox2:EGFP+ cells differentially expressed high levels of jagged1 (JAG), a transactivating positive stimulus for notch signaling. The high-level expression of JAG by E/sox2:EGFP+ cells suggests again that E/sox2:EGFP+ progenitors may exert a strong influence upon the turnover and fate of their neighbors.
E/sox2:EGFP+ cells also manifested high differential overexpression of noggin (NOG), a soluble antagonist of the bone morphogenetic proteins, and hence of BMP signaling. Given the progliogenic actions of the BMPs (Mabie et al., 1997; Lim et al., 2000), the overexpression of noggin by sox2+ NSCs might serve to prevent their premature glial differentiation, and hence preserve their undifferentiated expansion competence (Kondo and Raff, 2004). Together, these data suggest the concurrence of wnt and notch signaling in E/sox2:EGFP-defined neural stem and progenitor cells, occurring in the context of a noggin-mediated minimization of concurrent BMP receptor-dependent signaling. Acting in concert, these signals appear to act to ensure the cell-autonomous, active repression of terminal differentiation by these phenotypically plastic neural progenitor cells.
Thus, sox2 enhancer-based FACS permits the prospective and selective enrichment of a population of multipotential, self-renewing, and telomerase-expressing neural precursor cells from the fetal human brain. These E/sox2:EGFP+ cells included an hTERT+ fraction with active telomerase enzymatic activity, which likely defined the self-renewing fraction of neural stem cells within the larger pool of E/sox2:EGFP-defined neural progenitors. Most importantly, the E/sox2-based isolation of human neural stem and progenitor cells has permitted the definition of both the transcriptome and dominant signaling pathways of these cells. Assessed in the context of regional gene expression within the second trimester human forebrain (Johnson et al., 2009), these progenitor-selective pathways should permit the prediction of ligand-receptor interactions with both neural and non-neural cells within the host germinal matrix. Indeed, by defining their selective engagement of distinct receptor tyrosine kinase, wnt, notch, and BMP signaling pathways, and by identifying the specific receptors used by human neural progenitors, this analysis provides substantial molecular insight into how the expansion and fate of human neural stem and progenitor cells may be modulated for therapeutic benefit.
Footnotes
This work was supported by the Adelson Medical Research Foundation, the Mathers Charitable Foundation, the James S. McDonnell Foundation, the New York State Stem Cell Science Board, and National Institute of Neurological Disorders and Stroke Grants P01NS050315, R01NS33106, and R01NS39559. S.K.N. was supported by AIRC (Associazione Italiana Ricerca sul Cancro, MIUR (Minestero dell' Istruzione, dell' Università e della Ricerca), FBML (Fondazione Banca del Monte di Lombardia), and Regione Lombardia. We thank Brad Poulis of the Human Fetal Tissue Resource of the Albert Einstein College of Medicine for assistance in tissue acquisition.
References
- Allsopp RC, Vaziri H, Patterson C, Goldstein S, Younglai EV, Futcher AB, Greider CW, Harley CB. Telomere length predicts replicative capacity of human fibroblasts. Proc Natl Acad Sci U S A. 1992;89:10114–10118. doi: 10.1073/pnas.89.21.10114. [DOI] [PMC free article] [PubMed] [Google Scholar]
- Bauer S, Patterson PH. Leukemia inhibitory factor promotes neural stem cell self-renewal in the adult brain. J Neurosci. 2006;26:12089–12099. doi: 10.1523/JNEUROSCI.3047-06.2006. [DOI] [PMC free article] [PubMed] [Google Scholar]
- Bauer S, Kerr BJ, Patterson PH. The neuropoietic cytokine family in development, plasticity, disease and injury. Nat Rev Neurosci. 2007;8:221–232. doi: 10.1038/nrn2054. [DOI] [PubMed] [Google Scholar]
- Benjamini Y, Hochberg Y. Controlling the false discovery rate: a practical and powerful approach to multiple testing. J R Stat Soc Series B Stat Methodol. 1995;57:289–300. [Google Scholar]
- Capela A, Temple S. LeX/ssea-1 is expressed by adult mouse CNS stem cells, identifying them as nonependymal. Neuron. 2002;35:865–875. doi: 10.1016/s0896-6273(02)00835-8. [DOI] [PubMed] [Google Scholar]
- Catena R, Tiveron C, Ronchi A, Porta S, Ferri A, Tatangelo L, Cavallaro M, Favaro R, Ottolenghi S, Reinbold R, Schöler H, Nicolis SK. Conserved POU binding DNA sites in the Sox2 upstream enhancer regulate gene expression in embryonic and neural stem cells. J Biol Chem. 2004;279:41846–41857. doi: 10.1074/jbc.M405514200. [DOI] [PubMed] [Google Scholar]
- Craig CG, Tropepe V, Morshead CM, Reynolds BA, Weiss S, van der Kooy D. In vivo growth factor expansion of endogenous subependymal neural precursor cell populations in the adult mouse brain. J Neurosci. 1996;16:2649–2658. doi: 10.1523/JNEUROSCI.16-08-02649.1996. [DOI] [PMC free article] [PubMed] [Google Scholar]
- Doetsch F, Caillé I, Lim DA, García-Verdugo JM, Alvarez-Buylla A. Subventricular zone astrocytes are neural stem cells in the adult mammalian brain. Cell. 1999;97:703–716. doi: 10.1016/s0092-8674(00)80783-7. [DOI] [PubMed] [Google Scholar]
- Doetsch F, Petreanu L, Caille I, Garcia-Verdugo JM, Alvarez-Buylla A. EGF converts transit-amplifying neurogenic precursors in the adult brain into multipotent stem cells. Neuron. 2002;36:1021–1034. doi: 10.1016/s0896-6273(02)01133-9. [DOI] [PubMed] [Google Scholar]
- Fallon J, Reid S, Kinyamu R, Opole I, Opole R, Baratta J, Korc M, Endo TL, Duong A, Nguyen G, Karkehabadhi M, Twardzik D, Patel S, Loughlin S. In vivo induction of massive proliferation, directed migration, and differentiation of neural cells in the adult mammalian brain. Proc Natl Acad Sci U S A. 2000;97:14686–14691. doi: 10.1073/pnas.97.26.14686. [DOI] [PMC free article] [PubMed] [Google Scholar]
- Ferri AL, Cavallaro M, Braida D, Di Cristofano A, Canta A, Vezzani A, Ottolenghi S, Pandolfi PP, Sala M, DeBiasi S, Nicolis SK. Sox2 deficiency causes neurodegeneration and impaired neurogenesis in the adult mouse brain. Development. 2004;131:3805–3819. doi: 10.1242/dev.01204. [DOI] [PubMed] [Google Scholar]
- Garcia AD, Doan NB, Imura T, Bush TG, Sofroniew MV. GFAP-expressing progenitors are the principal source of constitutive neurogenesis in adult mouse forebrain. Nat Neurosci. 2004;7:1233–1241. doi: 10.1038/nn1340. [DOI] [PubMed] [Google Scholar]
- Gentleman RC, Carey VJ, Bates DM, Bolstad B, Dettling M, Dudoit S, Ellis B, Gautier L, Ge Y, Gentry J, Hornik K, Hothorn T, Huber W, Iacus S, Irizarry R, Leisch F, Li C, Maechler M, Rossini AJ, Sawitzki G, et al. Bioconductor: open software development for computational biology and bioinformatics. Genome Biol. 2004;5:R80. doi: 10.1186/gb-2004-5-10-r80. [DOI] [PMC free article] [PubMed] [Google Scholar]
- Ghashghaei HT, Weimer JM, Schmid RS, Yokota Y, McCarthy KD, Popko B, Anton ES. Reinduction of erbB2 in astrocytes promotes radial glial progenitor identity in adult cerebral cortex. Genes Dev. 2007;21:3258–3271. doi: 10.1101/gad.1580407. [DOI] [PMC free article] [PubMed] [Google Scholar]
- Goldman S. Stem and progenitor cell-based therapy of the human central nervous system. Nat Biotechnol. 2005a;23:862–871. doi: 10.1038/nbt1119. [DOI] [PubMed] [Google Scholar]
- Goldman SA. Neural progenitor cells of the adult human forebrain. In: Rao M, editor. Stem cells and CNS development. Ed 2. New York: Humana; 2005b. pp. 267–298. [Google Scholar]
- Graham V, Khudyakov J, Ellis P, Pevny L. SOX2 functions to maintain neural progenitor identity. Neuron. 2003;39:749–765. doi: 10.1016/s0896-6273(03)00497-5. [DOI] [PubMed] [Google Scholar]
- Harley CB, Futcher AB, Greider CW. Telomeres shorten during ageing of human fibroblasts. Nature. 1990;345:458–460. doi: 10.1038/345458a0. [DOI] [PubMed] [Google Scholar]
- Herbert B-S, Hochreiter AE, Wright WE, Shay JW. Nonradioactive detection of telomerase activity using the telomeric repeat amplification protocol. Nat Protoc. 2006;1:1583–1590. doi: 10.1038/nprot.2006.239. [DOI] [PubMed] [Google Scholar]
- Johnson MB, Kawasawa YI, Mason CE, Krsnik Z, Coppola G, Bogdanović D, Geschwind DH, Mane SM, State MW, Sestan N. Functional and evolutionary insights into human brain development through global transcriptome analysis. Neuron. 2009;62:494–509. doi: 10.1016/j.neuron.2009.03.027. [DOI] [PMC free article] [PubMed] [Google Scholar]
- Kalani MY, Cheshier SH, Cord BJ, Bababeygy SR, Vogel H, Weissman IL, Palmer TD, Nusse R. Wnt-mediated self-renewal of neural stem/progenitor cells. Proc Natl Acad Sci U S A. 2008;105:16970–16975. doi: 10.1073/pnas.0808616105. [DOI] [PMC free article] [PubMed] [Google Scholar]
- Kawaguchi A, Miyata T, Sawamoto K, Takashita N, Murayama A, Akamatsu W, Ogawa M, Okabe M, Tano Y, Goldman SA, Okano H. Nestin-EGFP transgenic mice: visualization of the self-renewal and multipotency of CNS stem cells. Mol Cell Neurosci. 2001;17:259–273. doi: 10.1006/mcne.2000.0925. [DOI] [PubMed] [Google Scholar]
- Keyoung HM, Roy NS, Benraiss A, Louissaint A, Jr, Suzuki A, Hashimoto M, Rashbaum WK, Okano H, Goldman SA. High-yield selection and extraction of two promoter-defined phenotypes of neural stem cells from the fetal human brain. Nat Biotechnol. 2001;19:843–850. doi: 10.1038/nbt0901-843. [DOI] [PubMed] [Google Scholar]
- Kondo T, Raff MC. A role for Noggin in the development of oligodendrocyte precursor cells. Developmental Biology. 2004;267:242–251. doi: 10.1016/j.ydbio.2003.11.013. [DOI] [PubMed] [Google Scholar]
- Lim DA, Tramontin AD, Trevejo JM, Herrera DG, García-Verdugo JM, Alvarez-Buylla A. Noggin antagonizes BMP signaling to create a niche for adult neurogenesis. Neuron. 2000;28:713–726. doi: 10.1016/s0896-6273(00)00148-3. [DOI] [PubMed] [Google Scholar]
- Mabie PC, Mehler MF, Marmur R, Papavasiliou A, Song Q, Kessler JA. Bone morphogenetic proteins induce astroglial differentiation of oligodendroglial-astroglial progenitor cells. J Neurosci. 1997;17:4112–4120. doi: 10.1523/JNEUROSCI.17-11-04112.1997. [DOI] [PMC free article] [PubMed] [Google Scholar]
- Mazieres J, You L, He B, Xu Z, Lee AY, Mikami I, McCormick F, Jablons DM. Inhibition of Wnt16 in human acute lymphoblastic leukemia cells containing the t(1;19) translocation induces apoptosis. Oncogene. 2005;24:5396–5400. doi: 10.1038/sj.onc.1208568. [DOI] [PubMed] [Google Scholar]
- Mignone JL, Kukekov V, Chiang AS, Steindler D, Enikolopov G. Neural stem and progenitor cells in nestin-GFP transgenic mice. J Comp Neurol. 2004;469:311–324. doi: 10.1002/cne.10964. [DOI] [PubMed] [Google Scholar]
- Miyagi S, Nishimoto M, Saito T, Ninomiya M, Sawamoto K, Okano H, Muramatsu M, Oguro H, Iwama A, Okuda A. The sox2 regulatory region 2 functions as a neural stem cell-specific enhancer in the telencephalon. J Biol Chem. 2006;281:13374–13381. doi: 10.1074/jbc.M512669200. [DOI] [PubMed] [Google Scholar]
- Morshead CM, Reynolds BA, Craig CG, McBurney MW, Staines WA, Morassutti D, Weiss S, van der Kooy D. Neural stem cells in the adult mammalian forebrain: a relatively quiescent subpopulation of subependymal cells. Neuron. 1994;13:1071–1082. doi: 10.1016/0896-6273(94)90046-9. [DOI] [PubMed] [Google Scholar]
- Ostenfeld T, Caldwell MA, Prowse KR, Linskens MH, Jauniaux E, Svendsen CN. Human neural precursor cells express low levels of telomerase in vitro and show diminishing cell proliferation with extensive axonal outgrowth following transplantation. Exp Neurol. 2000;164:215–226. doi: 10.1006/exnr.2000.7427. [DOI] [PubMed] [Google Scholar]
- Pevny L, Placzek M. SOX genes and neural progenitor identity. Curr Opin Neurobiol. 2005;15:7–13. doi: 10.1016/j.conb.2005.01.016. [DOI] [PubMed] [Google Scholar]
- Pevny LH, Nicolis SK. Sox2 roles in neural stem cells. Int J Biochem Cell Biol. 2010;42:421–424. doi: 10.1016/j.biocel.2009.08.018. [DOI] [PubMed] [Google Scholar]
- Qian X, Davis AA, Goderie SK, Temple S. FGF2 concentration regulates the generation of neurons and glia from multipotent cortical stem cells. Neuron. 1997;18:81–93. doi: 10.1016/s0896-6273(01)80048-9. [DOI] [PubMed] [Google Scholar]
- Reynolds BA, Weiss S. Generation of neurons and astrocytes from isolated cells of the adult mammalian central nervous system. Science. 1992;255:1707–1710. doi: 10.1126/science.1553558. [DOI] [PubMed] [Google Scholar]
- Roy NS, Nakano T, Keyoung HM, Windrem M, Rashbaum WK, Alonso ML, Kang J, Peng W, Carpenter MK, Lin J, Nedergaard M, Goldman SA. Telomerase immortalization of neuronally restricted progenitor cells derived from the human fetal spinal cord. Nat Biotechnol. 2004;22:297–305. doi: 10.1038/nbt944. [DOI] [PubMed] [Google Scholar]
- Roy NS, Chandler-Militello D, Lu G, Wang S, Goldman SA. Retrovirally-mediated telomerase immortalization of human neural progenitor cells. Nat Protoc. 2007;2:2815–2825. doi: 10.1038/nprot.2007.402. [DOI] [PubMed] [Google Scholar]
- Sim F, Lang J, Waldau B, Roy N, Schwartz T, Pilcher W, Chandross K, Natesan S, Merrill J, Goldman SA. Complementary patterns of gene expression by human oligodendrocyte progenitor cells and their environment predict determinants of progenitor maintenance and differentiation. Ann Neurol. 2006;59:763–779. doi: 10.1002/ana.20812. [DOI] [PubMed] [Google Scholar]
- Smyth GK. Linear models and empirical Bayes methods for assessing differential expression in microarray experiments. Stat Appl Genet Mol Biol. 2004;3 doi: 10.2202/1544-6115.1027. Article3. [DOI] [PubMed] [Google Scholar]
- Suh H, Consiglio A, Ray J, Sawai T, D'Amour KA, Gage FH. In vivo fate analysis reveals the multipotent and self-renewal capacities of Sox2(+) neural stem cells in the adult hippocampus. Cell Stem Cell. 2007;1:515–528. doi: 10.1016/j.stem.2007.09.002. [DOI] [PMC free article] [PubMed] [Google Scholar]
- Uchida N, Buck DW, He D, Reitsma MJ, Masek M, Phan TV, Tsukamoto AS, Gage FH, Weissman IL. Direct isolation of human central nervous system stem cells. Proc Natl Acad Sci U S A. 2000;97:14720–14725. doi: 10.1073/pnas.97.26.14720. [DOI] [PMC free article] [PubMed] [Google Scholar]
- Uchikawa M, Ishida Y, Takemoto T, Kamachi Y, Kondoh H. Functional analysis of chicken Sox2 enhancers highlights an array of diverse regulatory elements that are conserved in mammals. Dev Cell. 2003;4:509–519. doi: 10.1016/s1534-5807(03)00088-1. [DOI] [PubMed] [Google Scholar]
- Vescovi AL, Reynolds BA, Fraser DD, Weiss S. bFGF regulates the proliferative fate of unipotent (neuronal) and bipotent (neuronal/astroglial) EGF-generated CNS progenitor cells. Neuron. 1993;11:951–966. doi: 10.1016/0896-6273(93)90124-a. [DOI] [PubMed] [Google Scholar]
- Wright WE, Shay JW. Telomere biology in aging and cancer. J Am Geriatr Soc. 2005;53:S292–294. doi: 10.1111/j.1532-5415.2005.53492.x. [DOI] [PubMed] [Google Scholar]
- Wright WE, Shay JW, Piatyszek MA. Modifications of a telomeric repeat amplification protocol (TRAP) result in increased reliability, linearity and sensitivity. Nucleic Acids Res. 1995;23:3794–3795. doi: 10.1093/nar/23.18.3794. [DOI] [PMC free article] [PubMed] [Google Scholar]
- Wright WE, Piatyszek MA, Rainey WE, Byrd W, Shay JW. Telomerase activity in human germline and embryonic tissues and cells. Dev Genet. 1996;18:173–179. doi: 10.1002/(SICI)1520-6408(1996)18:2<173::AID-DVG10>3.0.CO;2-3. [DOI] [PubMed] [Google Scholar]
- Zappone MV, Galli R, Catena R, Meani N, De Biasi S, Mattei E, Tiveron C, Vescovi AL, Lovell-Badge R, Ottolenghi S, Nicolis SK. Sox2 regulatory sequences direct expression of a (beta)-geo transgene to telencephalic neural stem cells and precursors of the mouse embryo, revealing regionalization of gene expression in CNS stem cells. Development. 2000;127:2367–2382. doi: 10.1242/dev.127.11.2367. [DOI] [PubMed] [Google Scholar]