

Abstract
Increasing evidence suggests that prostate cancer is over diagnosed and over treated, and prognostic biomarkers would aid in treatment selection. To define prognostic biomarkers for aggressive prostate cancer, we carried out gene expression profiling of 98 prostate tumors and 52 benign adjacent prostate tissue samples with detailed clinical annotation. We identified 28 transcripts significantly associated with recurrence after radical prostatectomy including NuSAP, a protein that binds DNA to the mitotic spindle. Elevated NuSAP transcript levels were associated with poor outcome in 2 independent prostate cancer gene expression datasets. To characterize the role and regulation of NuSAP in prostate cancer, we studied the expression of NuSAP in the LNCaP and PC3 human prostate cancer cell lines. Post-transcriptional silencing of the NuSAP gene severely hampered the ability of PC3 to invade and proliferate in vitro. The promoter region of the NuSAP gene contains 2 CCAAT boxes and binding sites for E2F. Transient transfection of an E2F1 cDNA and 431 bp of the NuSAP promoter demonstrated E2F1 as an important regulator of expression. Deletion of the E2F binding site at nt −246 negated the effects of E2F1 on NuSAP expression. Electrophoretic mobility shift assays demonstrated that nuclear extracts of cells over-expressing E2F1 bound directly to the E2F binding site in the NuSAP promoter region. Finally, immunohistochemistry showed a strong correlation between E2F1 and NuSAP expression in human prostate cancer samples. NuSAP is a novel biomarker for prostate cancer recurrence after surgery and its over-expression appears to be driven in part by E2F1 activation.
Keywords: prostate cancer, gene expression profiling, NuSAP, E2F1, recurrence
Introduction
Prostate cancer is the most frequently diagnosed cancer in the western world. An estimated 648,400 men will be diagnosed with prostate cancer this year and 136,500 will die of their disease (1). The disparity between the number of men with prostate cancer and the number of men who die of their disease is largely due to the wide variation in the behavior of prostate cancer. Only a fraction of patients have tumors capable of metastasizing and causing death. One of the most important challenges in treating prostate cancer is in identifying patients with potentially lethal tumors needing aggressive treatment and those with indolent tumors that can be safely watched. The European Randomized Study of Screening for Prostate Cancer (ERSPC) trial estimated that the number of PSA detected prostate cancers treated to save one man’s life was 48 (2). A recent analysis that was restricted to the men who were actually screened suggested a smaller ratio of treated cancers at 30 to save one man’s life at 10 years (3).
Many investigators have documented significant molecular diversity in human prostate cancer and this heterogeneity undoubtedly contributes to the spectrum of clinical behavior. Several groups have shown that comprehensive gene expression profiling can capture molecular features that distinguish normal from cancerous prostate, and a few have identified genes associated with prognosis (2, 4–11). However, many of these studies have been small in size and on samples with minimal clinical annotation, limiting their ability to identify prognostic markers or provide insights into the biology of prostate cancer. To identify gene expression signatures associated with recurrence after definitive prostate cancer surgery, we performed gene expression profiling of 98 primary prostate tumor samples from 86 patients with detailed clinical annotation and clinical follow-up. From this analysis, we identified over-expression of the nucleolar and spindle associated protein (NuSAP) gene as an important marker of prognosis in prostate cancer. Functional studies confirm the potential biological importance of the NuSAP gene in prostate cancer and identify NuSAP as a potential end-target of E2F1.
Results
We performed gene expression profiling on 98 tumors from 86 individuals using HEEBO spotted microarrays containing 44,544 70-mer probes. The prostate tissue samples were harvested from men who underwent radical retropubic prostatectomy for clinically localized prostate cancer at Stanford University by a single surgeon (JDB) between 1998 and 2007. Detailed clinical data, including follow-up and recurrence status were available in 90 patients (92%). Mean patient age, pre-operative serum PSA levels, clinical stage and pathological Gleason grade were compatible with the risk profiles of contemporary patients undergoing surgery for prostate cancer (Supplementary Table S1).
Screen-detected prostate cancers found in contemporary surgical series are rarely lethal even after a decade of follow-up. Recurrence after surgery has been associated with a more aggressive clinical course and lethality, and has therefore been used as a surrogate endpoint of prostate cancer aggressiveness in many studies (12). To identify genes that are associated with biochemical recurrence following radical prostatectomy, we performed a SAM survival analysis using all 83 of the tumor samples that had associated clinical follow-up. SAM survival analysis uses Cox modeling to identify genes whose expression levels are significantly associated with time to biochemical recurrence. Since enrichment for highly variable genes improves the performance of SAM, we selected 1600 genes that varied by at least 5-fold across the entire dataset and used these to perform SAM-survival analysis. From this, 28 transcripts were identified that were significantly associated with recurrence after radical prostatectomy at FDR of 4% (Figure 1 and Supplementary Table S2). Among the 28 genes were several (KIAA0101, TOP2, EZH2, IGFBP3, RAC2, RCSD1, CYP2D6, MCM6, Versican, HGF and ETV5) that have been reported to be prognostic in a variety of malignancies including prostate cancer (13–32). More than half of the transcripts have not been previously implicated as prognostic and included NuSAP, TPX2, RACGAP1, CP, SIPA1L2, CF1, LOC391426, EST_AA496936, THBS2, SCUBE2, CERK, CRABP2, ENO1, AK2, CYP2D6, LOC285296, BCR/TCR_IGKV1/OR-2 and APOC1.
Figure 1.

a) 2-class SAM Survival analysis comparing 19 recurrent and 63 non-recurrent prostate cancer samples. A false discovery rate of 4% resulted in 28 gene transcripts differentially expressed between the two groups. Each tumor sample is represented in a column and individual transcripts are displayed in rows. Red indicates relative increased expression level of transcripts relative to the median level across the samples while green represents relative decrease in expression levels, while the degree of color saturation corresponds to the degree of change. b) Kaplan-Meier Survival analysis of NuSAP gene expression performed in our dataset. Tumor samples were divided into 2 groups based on whether the NuSAP gene expression value was above or below the median value. c) Increased expression of NuSAP is prognostic in that dataset from Glinsky GV et al. (34) and d) Taylor BS et al. (35) prostate datasets. P values calculated using the log rank test.
Interestingly, TPX2, RACGAP1 and NuSAP are important members of the microtubule and mitotic spindle regulation pathway and were found up regulated in recurrent samples compared to non-recurrent samples. Both NuSAP and TPX2 are indispensible proteins required for microtubule stabilization and crosslinking in response to local generation of RanGTP and its regulator RACGAP1. NuSAP has been associated with poor prognosis in human melanoma (33) but has never been linked to outcome in other solid tumors. Expression levels of NuSAP in the prostate samples were validated by qPCR on 20 (4 adjacent normal, 8 non-recurrent and 8 recurrent) prostate samples and excellent concordance was found with the microarray data (Supplemental Figure S1).
We hypothesized NuSAP might have an important role in prostate cancer progression and aggressiveness. Not surprisingly, when cancers in our dataset were segregated into groups with NuSAP expression levels above and below the median value, tumors with higher NuSAP levels had a significantly increased risk of biochemical recurrence after surgery (P < 0.01 by log-rank test; Figure 1b). To validate this observation, we investigated the relationship between NuSAP expression levels and outcome in 2 independent prostate cancer microarray datasets. Both of these datasets have used a large cohort of patients with well characterized prostate tumor samples and associated clinical follow up (34, 35). Increased NuSAP expression levels were significantly associated with recurrence after radical prostatectomy (P < 0.01 and P = 0.05, log rank test; Figure 1c and 1d)
NuSAP is expressed at relatively high levels in the prostate cancer cell lines LNCaP and PC3. To evaluate the possible effects of NuSAP overexpression in prostate cancer we knocked down expression levels of NuSAP in the prostate cancer cell line PC3. Cells were transiently transfected with either the NuSAP siRNA; Silencer Select 27674 (Invitrogen-USA) or scrambled siRNA control and NuSAP transcript levels were evaluated by qPCR (Figure 2b and Supplemental Figure S2). Knockdown of NuSAP transcript levels significantly decreased proliferation of PC3 cells in vitro compared to control cells (Figure 2a). In addition, knockdown of NuSAP transcript levels significantly decreased invasion to < 5% compared to controls in which 40% cells invaded through the membrane (Figure 2b). Similarly, knockdown of NuSAP in LNCaP cells significantly decreased proliferation (not shown). However, since wild-type LNCaP cells were poorly invasive, we could not assess the effects of NuSAP knock down on invasion in this cell line.
Figure 2.
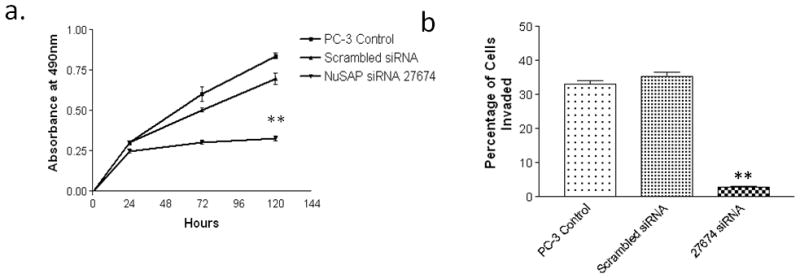
NuSAP knockdown reduces proliferation and invasion in PC3 cells. a) Cells transfected with NuSAP siRNA; Silencer Select 27674 show significantly decreased cell viability/proliferation, measured by the MTS assay. b) Cells transfected with NuSAP siRNA; Silencer Select 27674 display significantly decreased cell invasion through Matrigel. **P<0.001 compared to scrambled vector.
To understand the underlying mechanisms of NuSAP over-expression in aggressive prostate cancers, we investigated the promoter sequences of the NuSAP gene. Previously, NFYA and MYC have been implicated as transcriptional regulators of NuSAP (36, 37). Using MATCH™ software (TRANSFAC), we investigated whether there might be other potential transcription factor binding sites in the 5′-upstream region of the NuSAP gene. As expected, 2 putative NFYA (−139/−144 and −310/−315) binding sites were identified, although no MYC binding sites were observed. Interestingly, one E2F (−246/−252) binding site also was identified (Figure 3a). We cloned 431bp of the human NuSAP promoter region and created 5 deletion mutants containing the putative NFYA and E2F regulatory elements. The cloned NuSAP promoter constructs were ligated into pGL4.11-luc luciferase vector and the promoter-reporter constructs were verified by direct sequencing. LNCaP and PC3 prostate cancer cell lines were transiently transfected with 431bp promoter region and the 5 deletion constructs and luciferase activity was assayed. In both PC3 and LNCaP cell lines, constructs containing −123 to −431 of the NuSAP promoter showed comparable luciferase activity which essentially decreased to background levels in the constructs lacking those sequences, suggesting this region harbors critical regulatory elements (Figure 3b and 3c).
Figure 3.
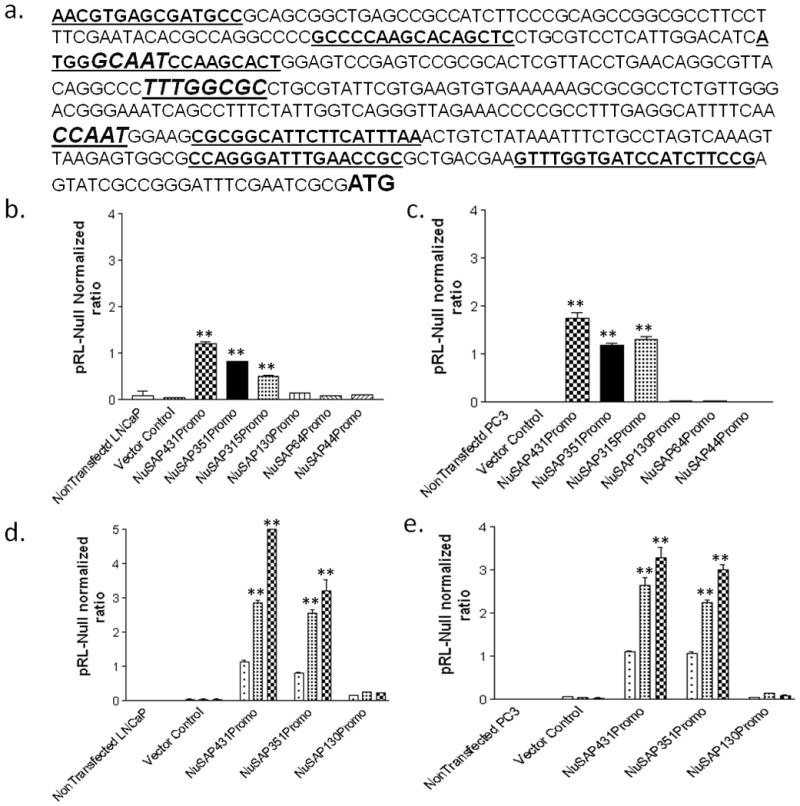
Promoter analysis of the human NuSAP gene. a) The 431bp human NuSAP promoter sequence. Bold underlined: primer sequences for amplifying NuSAP promoter deletion constructs. Bold Italics: Transcription factor binding sequences for NFYA (GCAAT and CCAAT) and E2F (TTTGGCGC). b) Baseline expression levels of the 431bp human NuSAP gene promoter and 5 deletion constructs ligated to pGL4.11-luciferase in LNCaP cells. The bp −123 to −431 region of the NuSAP promoter induces expression of NuSAP in LNCaP cells. c) Baseline expression for the promoter constructs in PC3 cells shows identical regulation. d) Co-transfection of LNCaP cells with NFYA and MYC increases NuSAP expression above baseline in LNCaP cells in the bp −123 to −431 region. e) Similar regulation by MYC and NFYA in PC3 cells. Data represents relative luciferase activity (firefly luciferase activity versus Renilla luciferase activity) which was calculated in each cell line and are the mean values from three separate experiments. ** P < 0.001 compared to vector controls.
To further investigate the regulatory elements within the −-431 to −123 region, we co-transfected the 431bp NuSAP promoter-luciferase reporter in tandem with cMyc or NFYA cDNAs into LNCaP and PC3 cell lines. As anticipated, MYC and NFYA resulted in 6- and 4-fold respectively higher luciferase activity above baseline activity (Figure 3d and 3e).
Increased expression of the E2F1 transcription factor has previously been suggested to be prognostic for prostate cancer (38, 39), but has not been implicated as a regulator of NuSAP gene expression. When E2F1 and the NuSAP promoter-reporter construct were co-transfected into LNCaP and PC3 cell lines, luciferase activity increased 3-fold above baseline (Figure 4a and 4b). Targeted mutation of the E2F binding sequence (TTTGGCGC to TTTGATAC) ablated E2F1 enhanced expression.
Figure 4.

E2F1 enhances NuSAP expression. Co-transfection of 431bp NuSAP promoter and E2F1 results in significantly increased NuSAP reporter expression in a) LNCaP and b) PC3 cell lines. Mutation of E2F binding sequence in NuSAP promoter negates the effects of E2F1. Data represents relative luciferase activity (firefly luciferase activity versus Renilla luciferase activity) which was calculated in each cell line. Data are the mean values from three separate experiments. ** P <0.001 compared to cells not transfected with E2F1.
To demonstrate whether E2F1 directly interacts with NuSAP gene promoter sequences, we prepared nuclear extracts from E2F1 transfected LNCaP and PC3 cell lines and ran a mobility shift assay using a 24 bp biotin labeled oligonucleotide probe corresponding to the −237 to −261 of NuSAP promoter region containing the E2F binding site (Figure 5). Nuclear extracts from both LNCaP and PC-3 bound the NuSAP E2F promoter sequences suggesting a direct interaction between E2F1 and the NuSAP promoter. We were able to compete away binding with unlabeled probe and eliminate binding using an anti-E2F1 antibody (BD- Pharmingen, USA).
Figure 5.
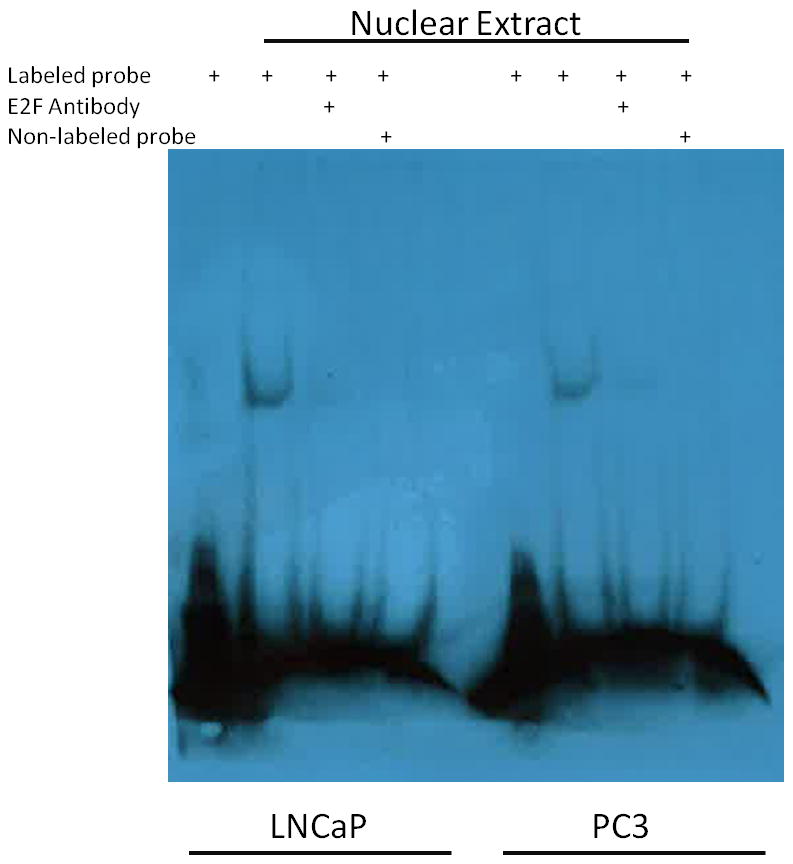
E2F1 directly binds to NuSAP promoter. Nuclear extracts from both LNCaP and PC3 cell lines were incubated with a biotin labeled oligonucleotide probe corresponding to the E2F binding site in the NuSAP promoter at bp −246/−254 (lanes 2, 6). Binding could be competed away by co-incubation with an anti-E2F1 antibody (lanes 3, 7) and with 100-fold molar excess of unlabeled probe (lanes 4, 8).
The further test whether E2F1 and NuSAP show coordinated expression in vivo, we performed immunohistochemical staining with NuSAP and E2F1 antibodies of a tissue microarray containing 121 primary prostate cancers (Figure 6a and 6b). Each core was evaluated for nuclear over-expression of E2F1 and NuSAP. An individual core was regarded as “positive” if the neoplastic cells showed unambiguous (2+ or greater) nuclear staining intensity on a 0–3 scale. The number of neoplastic cells showing positive nuclear reactivity was also counted in each core for each antibody. 35 cancer samples showed focal nuclear immunoreactivity for both proteins, 20 cancers were positive for E2F1 alone, 10 were positive for NuSAP alone and 47 were negative for both proteins (X2 = 20.8, p= 0.000) (Figure 6c). Since Gleason grade is a powerful predictor of prostate cancer aggressiveness, we also looked at the association between Gleason grading of the TMA core and the staining profile of both antibodies. Tumors with higher Gleason grades showed significant increased in numbers of cells positive for E2F1 (P < 0.000). Interestingly, the number of cells positive for NuSAP staining did not correlate with Gleason grade (P=0.8) (Figure 6d).
Figure 6.

Immunostaining of prostate TMA with NuSAP and E2F1. a) Nuclear staining of NuSAP observed in isolated prostate cancer nuclei (arrows). b) Nuclear staining of E2F1 in an adjacent section of prostate cancer. c) Correlation between NuSAP and E2F1 staining in 121 prostate cancer specimens on a tissue microarray. d) Number of nuclei with positive staining per 1 mm core of prostate cancer tissue on the tissue microarray separated by Gleason grade of the core. * P < 0.05, ** P < 0.001 compared to benign tissue.
Discussion
Through gene expression profiling, we identify NuSAP and a candidate biomarker for recurrence after radical prostatectomy. Over-expression of NuSAP is associated with recurrence of prostate cancer and this finding was validated in 2 independent datasets. It is particularly notable that of the 28 transcripts associated with biochemical recurrence after surgery, three of them (NuSAP, TPX2 and RACGAP1) are members of the microtubule associated protein family that regulate mitotic spindle organization. NuSAP appears to be critical for mitotic spindle assembly and for binding of DNA to the microtubules. Our data suggest that NuSAP plays an important functional role in some aggressive prostate cancers.
One obvious explanation for the role of NuSAP in prostate cancer is that it is a marker for proliferation. Increased expression of proliferation biomarkers has been shown to be prognostic in many cancer types (40–42). A recent analysis of gene sets shown to be prognostic in breast cancer suggests that they all reflect increased proliferation in aggressive cancers (40). Several studies have demonstrated that biomarkers of increased proliferation connote poor prognosis in prostate cancer and that measurement of several markers of prognosis simultaneously improves outcome prediction (39). Therefore, NuSAP represents a promising candidate biomarker to add to an immunohistochemical panel of prognostic biomarkers.
Since NuSAP is correlated with more aggressive prostate cancers, we sought to understand the mechanisms by which it becomes over-expressed in some prostate cancers. NuSAP is located on chromosome 15q15.1, a region not implicated in copy number alterations or other structural alterations in human prostate cancers (5, 43). Whole genome sequencing of several prostate cancers has not identified mutations within or near the NuSAP gene (44). We therefore investigated the 5′-regulatory elements of the NuSAP gene. Copy number gains of chromosome 8q in the region of the Myc gene are relatively common in prostate cancer. We confirmed that over-expression of Myc in prostate cells in vitro is associated with increased expression of a NuSAP promoter construct, despite the absence of canonical Myc binding sequences in this region. Although NFYA also increased expression of the NuSAP promoter-reporter construct, NFYA is an unlikely regulator of NuSAP in prostate cancer since it is expressed constitutively and NuSAP and NFYA transcript levels were not correlated in our dataset (36). The NuSAP promoter does harbor an E2F binding site and we were able to document that E2F1 over-expression results in increased expression of a NuSAP promoter reporter construct. In addition, deletion of this binding site abrogates expression, and E2F1 physically interacts with the binding sequence in the NuSAP gene promoter. Since E2F1 has been correlated with aggressive prostate cancer, it is a promising regulator of increased NuSAP expression in aggressive prostate cancers.
Identification of E2F1 as a regulator of NuSAP has potential implications in understanding prostate cancer progression. E2F controls cell division by regulating the transcription of genes that are essential for DNA synthesis and cell cycle progression. Aberrant expression of E2F1 has been documented in large number of malignancies including prostate cancer. Overexpression of E2F1 has been found in invasive ductal breast carcinomas and non–small cell lung carcinomas, where high levels of E2F1 were associated with advanced disease and poor prognosis (38). Increased expression of E2F transcript levels occurs as part of a proliferation cluster in a prostate cancer gene expression dataset that we have reported previously. Expression of E2F1 protein, along with proliferation markers Ki67 and TOP2A, is associated with an increased risk of recurrence after surgery in men with prostate cancer, independent of clinical stage, pre-treatment serum prostate specific antigen (PSA) levels and tumor Gleason grade (39). The retinoblastoma protein negatively regulates E2F and deletions of the Rb gene are relatively common events in prostate cancer. Recently, Sharma et al. have suggested that the progression to castration resistant prostate cancer is dependent on disruption of Rb which produces increased expression of the androgen receptor (AR) through the direct action of E2F1 (45). Therefore, like AR, NuSAP could represent another important effector protein in the Rb-E2F regulatory pathway in prostate cancer. In addition, the activation and release of NuSAP from Imp α, Imp β, and Imp 7 is mediated by RANGTP, an AR regulated gene (46). Therefore, NuSAP over-expression could cooperate to AR signaling in prostate cancer progression (Figure 7).
Figure 7.
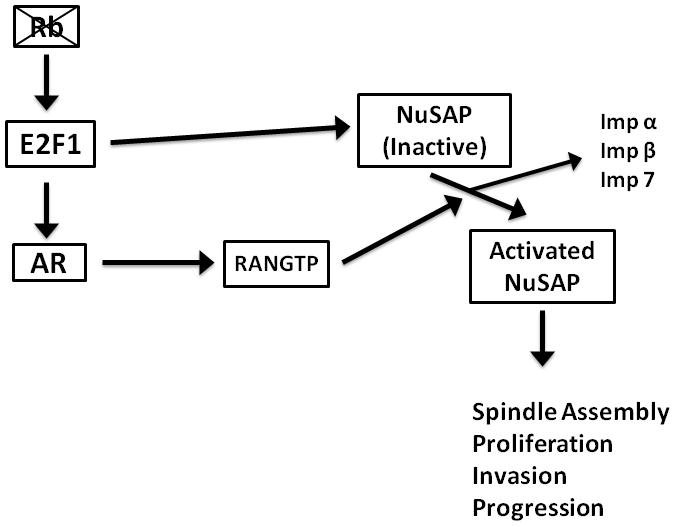
Schematic representation of possible role of NuSAP in the Rb-E2F signaling pathway including possible interactions with AR signaling.
The functional consequences of NuSAP over-expression are somewhat unclear. NuSAP is indispensable to cell division and is selectively expressed in the proliferating cells. Its expression peaks during G2-mitosis phase and declines rapidly following cell division. NuSAP expression is highly correlated with cell proliferation during embryogenesis and adult life, and NuSAP deficiency in mice leads to early embryonic lethality (47). In agreement with this finding, we found that knockdown of NuSAP in LNCaP and PC3 prostate cancer cell lines essentially stopped cell growth and significantly inhibited invasion of matrigel. NuSAP over-expression appears to be an end product of a regulatory pathway important in prostate cancer and might represent a critical effector protein in this pathway in its effects on the microtubules. Selective inhibition of NuSAP-mitotic spindle complex results in mitotic arrest, abnormal chromatin condensation, apoptosis and cell death. Based on its critical role in cell division, NuSAP could represent an important candidate target protein for therapy. For example, in acute myelogenous leukemia (AML), some patients who undergo ablative chemotherapy and stem cell transplant subsequently develop auto antibodies against NuSAP and these antibodies are produced by the stem cell graft. Patients with auto antibodies against NuSAP show improved cancer remission rates and it is hypothesized that NuSAP is the direct target of a graft-versus-leukemia (GVL) response (44). Therefore, NuSAP, as an important effector protein in proliferation, could represent a novel therapeutic target in prostate cancer, melanoma and other malignancies.
Materials and Methods
Sample collection
All prostate samples used for this study were collected at the Stanford University Medical Center between 1999 and 2007 with patient’s informed consent under an IRB approved protocol. Multiple tissue samples were harvested from each prostate, flash frozen and stored at −80°C. Frozen sections of each prostate sample were performed and evaluated by a genitourinary pathologist (JKM). The tumor and non-tumor areas were marked and contaminating tissues were trimmed away from the block as described previously (48). Tumor samples in which at least 90% of the epithelial cells were cancerous were selected for extraction of DNA and RNA. In total, we selected 98 tumors from 86 patients that met these criteria. Associated clinical data was collected and included pre-operative prostate specific antigen (PSA) levels, clinical stage, pathological stage, tumor Gleason grade, and clinical follow-up. Recurrence was defined as a measurable serum PSA (> 0.1 ng/ml on 2 consecutive measurements) after surgery.
DNA/RNA Extraction
The tumor and normal prostate tissue samples (=< 100mg) were homogenized for 1 minute using P-2100 Polytron homogenizer. The homogenates were centrifuged at 9000 RPM for 3 minutes and the supernatants were passed through a 21G needle 4–5 times before proceeding to DNA/RNA extraction. DNA, RNA and microRNA were isolated from each tissue sample using Qiagen AllPrep DNA/RNA mini kit following the manufacturer’s protocol. RNA quality was assessed by the integrity of rRNA bands following gel electrophoresis.
Gene Expression Profiling
Gene expression profiling was performed as reported (48). Briefly, Cy5-labeled cDNA was prepared by using 50 ug of total RNA from prostate samples, and Cy3-labeled cDNA was prepared by using common reference mRNA (Stratagene, USA), pooled from 11 established human cell lines. For each experimental sample, Cy5- and Cy3-labeled samples were cohybridized to HEEBO (Human Exonic Evidence Based Oligonucleotide – HEEBO) spotted microarrays (49). HEEBO microarrays were manufactured in the Stanford Functional Genomics Facility at Stanford University and contained 44,544 70-mer probes. After hybridization, microarrays were imaged using an Axon GenePix 4000 scanner (Axon Instruments). Fluorescence ratios for array elements were extracted using GENEPIX software, and uploaded into the Stanford Microarray Database for subsequent analysis (50). Fluorescence ratios were normalized by mean centering genes for each array. Ratios were then mean-centered for each gene across all arrays within each of four different array print runs used, to minimize potential print run specific bias. Gene expression data have been deposited in GEO (ID# pending).
Plasmid Construction and Mutagenesis
The human NuSAP promoter along with promoter deletion constructs were amplified from normal human genomic DNA and ligated to Kpn1/HindIII restriction site of the pGL4.11 luciferase reporter plasmid. Following primers were used to amplify the NuSAP promoter and its deletion constructs: (positions −1 to −431) Forward 5′ GGTACCCAACGTGAGCGATGCC 3′, Reverse 5′AAGCTTCGCGATTCGAAATCCC 3′, (positions −1 to −352) Forward 5′ GGTACCGCCCCAAGCACAGCTC 3′, (positions −1 to −316) Forward 5′ GGTACCATGGGCAATCCAAGCACT, (positions −1 to −130) Forward 5′ GGTACCCGCGGCATTCTTCATTTAA 3′, (positions −1 to −71) Forward 5′ GGTACCCCAGGGATTTGAACCGC 3′ and (position −1 to −45) Forward 5′ GGTACCGTTTGGTGATCCATCTTCCG. The E2F binding site within the NuSAP promoter was mutated using the QuikChange multi site directed mutagenesis kit (Stratagene) based on manufacturer’s recommendations. The primers used for mutagenesis were Forward 5′-AGGCGTTACAGGCCCTTTGATACCTGCGTATTCGTGAAGTG-3′ and Reverse 3′-TCCGCAATGTCCGGGAAACTATGGACGCATAAGCACTTCAC-5′. Human E2F1, c-MYC and NFYA/NFDN (dominant negative) were kind gifts from Drs. Julien Sage, Dean Felsher (Stanford University) and Roberto Mantovani (University of Milan).
Cell Culture and Transfection
LNCaP and PC-3 prostate cancer cell lines were grown in T-Medium and DMEM respectively, supplemented with 10% fetal bovine serum. A total of 2 × 10⁵ cells were transfected with 1.8 μg of firefly reporter plasmid (pGL4.11-Luc) containing the NuSAP gene promoter constructs and 200ng of Renilla luciferase reporter plasmid (pRL-Null) using lipofectamine 2000 (Invitrogen, USA) reagent according to manufacturer’s recommendations. After 48 hours, cells were harvested and both firefly and Renilla luciferase activities in the cell extracts were determined by Dual Luciferase Assay kit (Promega). Co-Transfections of cells with either of E2F1, NF-YA, NFDN, c-MYC and NuSAP promoter plasmids were done using the same protocol stated above keeping the ratio of Firefly to Renilla constant (1:0.1).
Cell proliferation and invasion assays
Cell proliferation was quantified using the MTS (Promega, USA) assay, a colorimetric assay based on detection of MTS tetrazolium compound (Owen’s reagent) by metabolically active cells. Cell invasion was measured by a Boyden chamber assay (BD Biosciences, Franklin Lakes, NJ). Five-thousand PC3 cells per 24-well insert were seeded onto pre-coated filters (8 μm pore size, Matrigel 100 μg/cm2), using a 0.5% FBS to 10% FBS gradient. After 24 hours, cells traversing the filter were fixed with 10% buffered formalin, stained with crystal violet, and manually counted. All the above assays were done in triplicate, and all experiments were replicated at least once.
Nuclear Extract and Electrophoretic Mobility Shift Assay (EMSA)
Nuclear extracts were prepared by using NE-PER Nuclear and Cytoplasmic Extraction reagents (Thermo Scientific, USA) according to manufacturer’s instructions. Nuclear extracts (10 μg) from E2F1 transfected LNCaP and PC3 cell lines were incubated for 15 minutes at room temperature with 20 nM of a biotin labeled oligonucleotide probe containing a putative E2F binding sequence from the NuSAP promoter in a 20 μl binding reaction containing 5X binding buffer (final concentration 20 mM HEPES pH 8.0, 50 mM KCL, 1 mM DTT, 1 mM EDTA, 1 mM MgCl2, 5% Glycerol) and 1 mg/ml Poly (dI-dC). The oligonucleotides sequences used were Forward 5′ CAGGCCCTTTGGCGCCTGCGTATT 3′ and Reverse 5′ GTCCGGGAAACCGCGGACGCATAA 3′. In order to demonstrate the specificity of the reaction, the extracts were also incubated with either of E2F1 antibody (1 μg) (sc-22820, Santa Cruz Biotechnology, Inc. CA, USA) or (2 μM) non-labeled probe for 15 minutes at room temperature prior to adding the labeled oligonucleotide. The probe bound nuclear extracts were separated from the free probe in a 6% DNA retardation gel (Invitrogen, USA) and the biotin-labeled probe was detected using the Phototope Star kit (New England Biolabs, USA).
Immunohistochemistry
A standard 2 layer Strepavidin-biotin method was used to stain a prostate tissue microarray containing 121 cases. For NuSAP protein detection, sections were heated to 95°C after adding Tris–EDTA solution (10 mM Tris-HCl, 1 mM EDTA, pH 9). E2F1 antigen retrieval was carried out using 1 mM EDTA pH 9.0 and the samples were microwaved for 20 minutes. Endogenous peroxidase activity was blocked with 0.3% H2O2 in methanol. Non-specific binding was blocked with protein block serum free reagent (Dako, Glostrup, Denmark). Sections were incubated overnight with rabbit anti-human NuSAP polyclonal antibody (Proteintech Group) (1:400) or mouse anti-E2F1 monoclonal antibody (BD biosciences, USA; 1:50). Antibody binding was visualized with the Dako Envision System (Dako, Glostrup, Denmark). The stained sections reviewed and scored by a genitourinary pathologist (JKM). Only luminal epithelial cells displaying nuclear expression of NuSAP or E2F1 were scored as positive.
Data analysis
For analysis of gene expression data, we included only well measured genes whose expression varied, as determined by (1) signal intensity over background >1.5-fold in both test and reference channels in at least 75% of samples, and (2) 2-fold ratio variation from the mean in at least two samples. Transcripts associated with recurrence after surgery were identified using the SAM (Statistical Analysis of Microarray) Survival method (51). Hierarchical clustering was performed and displayed using Cluster and TreeView software. Kaplan Meier analysis and the log-rank test were performed using Prism Software version 2.01 to test the association between NuSAP expression levels and clinical outcome. The association between NuSAP and E2F1 protein expression levels was carried out using Chi-Square analysis. Comparison of the expression levels in the transfection assays was done by two-tailed Student’s t-test using SPSS.
Supplementary Material
Acknowledgments
Funding
This project was funded by NIH (CA112016, CA111782, CA130472 to J.D.B.), and Department of Defense (W81XWH-11-1-0447 to JDB),
Footnotes
Author Contributions
Agree with the manuscript’s results and conclusions: ZGG JDB JKM. Designed the experiments/the study: ZGG, JDB. Analyzed the data: ZGG JDB JKM. Collected data/did experiments for the study: ZGG JKM. Prepared tissue samples: ZGG JKM JDB. Wrote the first draft of the paper: ZGG. Contributed to the writing of the paper: ZGG JDB JKM.
Conflict of Interest
The authors have no financial, personal, or professional interests that could be construed to have influenced our paper.
Reference List
- 1.Jemal A, Bray F, Center MM, Ferlay J, Ward E, Forman D. Global cancer statistics. CA Cancer J Clin. 2011;61(2):69–90. doi: 10.3322/caac.20107. [DOI] [PubMed] [Google Scholar]
- 2.Schroder FH, Hugosson J, Roobol MJ, Tammela TL, Ciatto S, Nelen V, et al. Screening and prostate-cancer mortality in a randomized European study. N Engl J Med. 2009;360(13):1320–1328. doi: 10.1056/NEJMoa0810084. [DOI] [PubMed] [Google Scholar]
- 3.Roobol MJ, Kerkhof M, Schroder FH, Cuzick J, Sasieni P, Hakama M, et al. Prostate cancer mortality reduction by prostate-specific antigen-based screening adjusted for nonattendance and contamination in the European Randomised Study of Screening for Prostate Cancer (ERSPC) Eur Urol. 2009;56(4):584–591. doi: 10.1016/j.eururo.2009.07.018. [DOI] [PubMed] [Google Scholar]
- 4.Dhanasekaran SM, Barrette TR, Ghosh D, Shah R, Varambally S, Kurachi K, et al. Delineation of prognostic biomarkers in prostate cancer. Nature. 2001;412(6849):822–826. doi: 10.1038/35090585. [DOI] [PubMed] [Google Scholar]
- 5.Lapointe J, Li C, Giacomini CP, Salari K, Huang S, Wang P, et al. Genomic profiling reveals alternative genetic pathways of prostate tumorigenesis. Cancer Res. 2007;67(18):8504–8510. doi: 10.1158/0008-5472.CAN-07-0673. [DOI] [PubMed] [Google Scholar]
- 6.LaTulippe E, Satagopan J, Smith A, Scher H, Scardino P, Reuter V, et al. Comprehensive gene expression analysis of prostate cancer reveals distinct transcriptional programs associated with metastatic disease. Cancer Res. 2002;62(15):4499–4506. [PubMed] [Google Scholar]
- 7.Luo J, Duggan DJ, Chen Y, Sauvageot J, Ewing CM, Bittner ML, et al. Human prostate cancer and benign prostatic hyperplasia: molecular dissection by gene expression profiling. Cancer Res. 2001;61(12):4683–4688. [PubMed] [Google Scholar]
- 8.Luo JH, Yu YP, Cieply K, Lin F, Deflavia P, Dhir R, et al. Gene expression analysis of prostate cancers. Mol Carcinog. 2002;33(1):25–35. doi: 10.1002/mc.10018. [DOI] [PubMed] [Google Scholar]
- 9.Singh D, Febbo PG, Ross K, Jackson DG, Manola J, Ladd C, et al. Gene expression correlates of clinical prostate cancer behavior. Cancer Cell. 2002;1(2):203–209. doi: 10.1016/s1535-6108(02)00030-2. [DOI] [PubMed] [Google Scholar]
- 10.Varambally S, Dhanasekaran SM, Zhou M, Barrette TR, Kumar-Sinha C, Sanda MG, et al. The polycomb group protein EZH2 is involved in progression of prostate cancer. Nature. 2002;419(6907):624–629. doi: 10.1038/nature01075. [DOI] [PubMed] [Google Scholar]
- 11.Welsh JB, Sapinoso LM, Su AI, Kern SG, Wang-Rodriguez J, Moskaluk CA, et al. Analysis of gene expression identifies candidate markers and pharmacological targets in prostate cancer. Cancer Res. 2001;61(16):5974–5978. [PubMed] [Google Scholar]
- 12.Freedland SJ, Humphreys EB, Mangold LA, Eisenberger M, Dorey FJ, Walsh PC, et al. Risk of prostate cancer-specific mortality following biochemical recurrence after radical prostatectomy. JAMA. 2005;294(4):433–439. doi: 10.1001/jama.294.4.433. [DOI] [PubMed] [Google Scholar]
- 13.Abraham JE, Maranian MJ, Driver KE, Platte R, Kalmyrzaev B, Baynes C, et al. CYP2D6 gene variants: association with breast cancer specific survival in a cohort of breast cancer patients from the United Kingdom treated with adjuvant tamoxifen. Breast Cancer Res. 2010;12(4):R64. doi: 10.1186/bcr2629. [DOI] [PMC free article] [PubMed] [Google Scholar]
- 14.Amemiya H, Menolascino F, Pena A. Role of the expression of c-Met receptor in the progression of gastric cancer. Invest Clin. 2010;51(3):369–380. [PubMed] [Google Scholar]
- 15.Aune G, Lian AM, Tingulstad S, Torp SH, Forsmo S, Reseland JE, et al. Increased circulating hepatocyte growth factor (HGF): a marker of epithelial ovarian cancer and an indicator of poor prognosis. Gynecol Oncol. 2011;121(2):402–406. doi: 10.1016/j.ygyno.2010.12.355. [DOI] [PubMed] [Google Scholar]
- 16.Bryant RJ, Cross NA, Eaton CL, Hamdy FC, Cunliffe VT. EZH2 promotes proliferation and invasiveness of prostate cancer cells. Prostate. 2007;67(5):547–556. doi: 10.1002/pros.20550. [DOI] [PubMed] [Google Scholar]
- 17.Chan JM, Stampfer MJ, Ma J, Gann P, Gaziano JM, Pollak M, et al. Insulin-like growth factor-I (IGF-I) and IGF binding protein-3 as predictors of advanced-stage prostate cancer. J Natl Cancer Inst. 2002;94(14):1099–1106. doi: 10.1093/jnci/94.14.1099. [DOI] [PubMed] [Google Scholar]
- 18.Chotteau-Lelievre A, Revillion F, Lhotellier V, Hornez L, Desbiens X, Cabaret V, et al. Prognostic value of ERM gene expression in human primary breast cancers. Clin Cancer Res. 2004;10(21):7297–7303. doi: 10.1158/1078-0432.CCR-04-0593. [DOI] [PubMed] [Google Scholar]
- 19.Engers R, Ziegler S, Mueller M, Walter A, Willers R, Gabbert HE. Prognostic relevance of increased Rac GTPase expression in prostate carcinomas. Endocr Relat Cancer. 2007;14(2):245–256. doi: 10.1677/ERC-06-0036. [DOI] [PubMed] [Google Scholar]
- 20.Gorter A, Zijlmans HJ, van Gent H, Trimbos JB, Fleuren GJ, Jordanova ES. Versican expression is associated with tumor-infiltrating CD8-positive T cells and infiltration depth in cervical cancer. Mod Pathol. 2010;23(12):1605–1615. doi: 10.1038/modpathol.2010.154. [DOI] [PubMed] [Google Scholar]
- 21.Helfenstein A, Frahm SO, Krams M, Drescher W, Parwaresch R, Hassenpflug J. Minichromosome maintenance protein (MCM6) in low-grade chondrosarcoma: distinction from enchondroma and identification of progressive tumors. Am J Clin Pathol. 2004;122(6):912–918. doi: 10.1309/G638-TKNN-G2CJ-UXWL. [DOI] [PubMed] [Google Scholar]
- 22.Kosari F, Munz JM, Savci-Heijink CD, Spiro C, Klee EW, Kube DM, et al. Identification of prognostic biomarkers for prostate cancer. Clin Cancer Res. 2008;14(6):1734–1743. doi: 10.1158/1078-0432.CCR-07-1494. [DOI] [PubMed] [Google Scholar]
- 23.Lammers LA, Mathijssen RH, van Gelder T, Bijl MJ, de Graan AJ, Seynaeve C, et al. The impact of CYP2D6-predicted phenotype on tamoxifen treatment outcome in patients with metastatic breast cancer. Br J Cancer. 2010;103(6):765–771. doi: 10.1038/sj.bjc.6605800. [DOI] [PMC free article] [PubMed] [Google Scholar]
- 24.Miyata Y, Sakai H, Kanda S, Igawa T, Hayashi T, Kanetake H. Expression of insulin-like growth factor binding protein-3 before and after neoadjuvant hormonal therapy in human prostate cancer tissues: correlation with histopathologic effects and biochemical recurrence. Urology. 2004;63(6):1184–1190. doi: 10.1016/j.urology.2004.02.015. [DOI] [PubMed] [Google Scholar]
- 25.Monge M, Colas E, Doll A, Gil-Moreno A, Castellvi J, Diaz B, et al. Proteomic approach to ETV5 during endometrial carcinoma invasion reveals a link to oxidative stress. Carcinogenesis. 2009;30(8):1288–1297. doi: 10.1093/carcin/bgp119. [DOI] [PubMed] [Google Scholar]
- 26.Murphy AJ, Hughes CA, Barrett C, Magee H, Loftus B, O’Leary JJ, et al. Low-level TOP2A amplification in prostate cancer is associated with HER2 duplication, androgen resistance, and decreased survival. Cancer Res. 2007;67(6):2893–2898. doi: 10.1158/0008-5472.CAN-06-2962. [DOI] [PubMed] [Google Scholar]
- 27.Mustjoki S, Hernesniemi S, Rauhala A, Kahkonen M, Almqvist A, Lundan T, et al. A novel dasatinib-sensitive RCSD1-ABL1 fusion transcript in chemotherapy-refractory adult pre-B lymphoblastic leukemia with t(1;9)(q24;q34) Haematologica. 2009;94(10):1469–1471. doi: 10.3324/haematol.2009.008094. [DOI] [PMC free article] [PubMed] [Google Scholar]
- 28.Schrader C, Janssen D, Klapper W, Siebmann JU, Meusers P, Brittinger G, et al. Minichromosome maintenance protein 6, a proliferation marker superior to Ki-67 and independent predictor of survival in patients with mantle cell lymphoma. Br J Cancer. 2005;93(8):939–945. doi: 10.1038/sj.bjc.6602795. [DOI] [PMC free article] [PubMed] [Google Scholar]
- 29.Setoguchi T, Kikuchi H, Yamamoto M, Baba M, Ohta M, Kamiya K, et al. Microarray analysis identifies versican and CD9 as potent prognostic markers in gastric gastrointestinal stromal tumors. Cancer Sci. 2011;102(4):883–889. doi: 10.1111/j.1349-7006.2011.01872.x. [DOI] [PMC free article] [PubMed] [Google Scholar]
- 30.Wong N, Yeo W, Wong WL, Wong NL, Chan KY, Mo FK, et al. TOP2A overexpression in hepatocellular carcinoma correlates with early age onset, shorter patients survival and chemoresistance. Int J Cancer. 2009;124(3):644–652. doi: 10.1002/ijc.23968. [DOI] [PubMed] [Google Scholar]
- 31.Yu J, Yu J, Rhodes DR, Tomlins SA, Cao X, Chen G, et al. A polycomb repression signature in metastatic prostate cancer predicts cancer outcome. Cancer Res. 2007;67(22):10657–10663. doi: 10.1158/0008-5472.CAN-07-2498. [DOI] [PubMed] [Google Scholar]
- 32.Yuan RH, Jeng YM, Pan HW, Hu FC, Lai PL, Lee PH, et al. Overexpression of KIAA0101 predicts high stage, early tumor recurrence, and poor prognosis of hepatocellular carcinoma. Clin Cancer Res. 2007;13(18 Pt 1):5368–5376. doi: 10.1158/1078-0432.CCR-07-1113. [DOI] [PubMed] [Google Scholar]
- 33.Bogunovic D, O’Neill DW, Belitskaya-Levy I, Vacic V, Yu YL, Adams S, et al. Immune profile and mitotic index of metastatic melanoma lesions enhance clinical staging in predicting patient survival. Proc Natl Acad Sci U S A. 2009;106(48):20429–20434. doi: 10.1073/pnas.0905139106. [DOI] [PMC free article] [PubMed] [Google Scholar]
- 34.Glinsky GV, Glinskii AB, Stephenson AJ, Hoffman RM, Gerald WL. Gene expression profiling predicts clinical outcome of prostate cancer. J Clin Invest. 2004;113(6):913–923. doi: 10.1172/JCI20032. [DOI] [PMC free article] [PubMed] [Google Scholar]
- 35.Taylor BS, Schultz N, Hieronymus H, Gopalan A, Xiao Y, Carver BS, et al. Integrative genomic profiling of human prostate cancer. Cancer Cell. 2010;18(1):11–22. doi: 10.1016/j.ccr.2010.05.026. [DOI] [PMC free article] [PubMed] [Google Scholar]
- 36.Fujiwara T, Harigae H, Okitsu Y, Takahashi S, Yokoyama H, Yamada MF, et al. Expression analyses and transcriptional regulation of mouse nucleolar spindle-associated protein gene in erythroid cells: essential role of NF-Y. Br J Haematol. 2006;135(4):583–590. doi: 10.1111/j.1365-2141.2006.06340.x. [DOI] [PubMed] [Google Scholar]
- 37.Hussain S, Benavente SB, Nascimento E, Dragoni I, Kurowski A, Gillich A, et al. The nucleolar RNA methyltransferase Misu (NSun2) is required for mitotic spindle stability. J Cell Biol. 2009;186(1):27–40. doi: 10.1083/jcb.200810180. [DOI] [PMC free article] [PubMed] [Google Scholar]
- 38.Davis JN, Wojno KJ, Daignault S, Hofer MD, Kuefer R, Rubin MA, et al. Elevated E2F1 inhibits transcription of the androgen receptor in metastatic hormone-resistant prostate cancer. Cancer Res. 2006;66(24):11897–11906. doi: 10.1158/0008-5472.CAN-06-2497. [DOI] [PubMed] [Google Scholar]
- 39.Malhotra S, Lapointe J, Salari K, Higgins JP, Ferrari M, Montgomery K, et al. A tri-marker proliferation index predicts biochemical recurrence after surgery for prostate cancer. PLoS One. 2011;6(5):e20293. doi: 10.1371/journal.pone.0020293. [DOI] [PMC free article] [PubMed] [Google Scholar]
- 40.Adamo B, Anders CK. Stratifying triple-negative breast cancer: which definition(s) to use? Breast Cancer Res. 2011;13(2):105. doi: 10.1186/bcr2852. [DOI] [PMC free article] [PubMed] [Google Scholar]
- 41.Rodriguez-Enriquez S, Pacheco-Velazquez SC, Gallardo-Perez JC, Marin-Hernandez A, Aguilar-Ponce JL, Ruiz-Garcia E, et al. Multi-biomarker pattern for tumor identification and prognosis. J Cell Biochem. 2011;112(10):2703–2715. doi: 10.1002/jcb.23224. [DOI] [PubMed] [Google Scholar]
- 42.von Euler H, Eriksson S. Comparative aspects of the proliferation marker thymidine kinase 1 in human and canine tumour diseases. Vet Comp Oncol. 2011;9(1):1–15. doi: 10.1111/j.1476-5829.2010.00238.x. [DOI] [PubMed] [Google Scholar]
- 43.Pflueger D, Terry S, Sboner A, Habegger L, Esgueva R, Lin PC, et al. Discovery of nonETS gene fusions in human prostate cancer using next-generation RNA sequencing. Genome Res. 2011;21(1):56–67. doi: 10.1101/gr.110684.110. [DOI] [PMC free article] [PubMed] [Google Scholar]
- 44.Wadia PP, Coram M, Armstrong RJ, Mindrinos M, Butte AJ, Miklos DB. Antibodies specifically target AML antigen NuSAP1 after allogeneic bone marrow transplantation. Blood. 2010;115(10):2077–2087. doi: 10.1182/blood-2009-03-211375. [DOI] [PMC free article] [PubMed] [Google Scholar]
- 45.Sharma A, Yeow WS, Ertel A, Coleman I, Clegg N, Thangavel C, et al. The retinoblastoma tumor suppressor controls androgen signaling and human prostate cancer progression. J Clin Invest. 2010;120(12):4478–4492. doi: 10.1172/JCI44239. [DOI] [PMC free article] [PubMed] [Google Scholar]
- 46.Iyer J, Moghe S, Furukawa M, Tsai MY. What’s Nu(SAP) in mitosis and cancer? Cell Signal. 2011;23(6):991–998. doi: 10.1016/j.cellsig.2010.11.006. [DOI] [PubMed] [Google Scholar]
- 47.Vanden Bosch A, Raemaekers T, Denayer S, Torrekens S, Smets N, Moermans K, et al. NuSAP is essential for chromatin-induced spindle formation during early embryogenesis. J Cell Sci. 2010;123(Pt 19):3244–3255. doi: 10.1242/jcs.063875. [DOI] [PubMed] [Google Scholar]
- 48.Lapointe J, Li C, Higgins JP, van de RM, Bair E, Montgomery K, et al. Gene expression profiling identifies clinically relevant subtypes of prostate cancer. Proc Natl Acad Sci U S A. 2004;101(3):811–816. doi: 10.1073/pnas.0304146101. [DOI] [PMC free article] [PubMed] [Google Scholar]
- 49.Kim YH, Pollack JR. Comparative genomic hybridization on spotted oligonucleotide microarrays. Methods Mol Biol. 2009;556:21–32. doi: 10.1007/978-1-60327-192-9_3. [DOI] [PMC free article] [PubMed] [Google Scholar]
- 50.Sherlock G, Hernandez-Boussard T, Kasarskis A, Binkley G, Matese JC, Dwight SS, et al. The Stanford Microarray Database. Nucleic Acids Res. 2001;29(1):152–155. doi: 10.1093/nar/29.1.152. [DOI] [PMC free article] [PubMed] [Google Scholar]
- 51.Tibshirani R, Hastie T, Narasimhan B, Chu G. Diagnosis of multiple cancer types by shrunken centroids of gene expression. Proc Natl Acad Sci U S A. 2002;99(10):6567–6572. doi: 10.1073/pnas.082099299. [DOI] [PMC free article] [PubMed] [Google Scholar]
Associated Data
This section collects any data citations, data availability statements, or supplementary materials included in this article.