Abstract
Patho-physiological conditions with high oxidative stress, such as conditions associated with increased denatured heme-proteins, are associated with enhanced adipogenic response. This effect predominantly manifests as adipocyte hypertrophy characterized by dysfunctional, pro-inflammatory adipocytes exhibiting reduced expression of anti-inflammatory hormone, adiponectin. To understand how increased levels of cellular heme, a pro-oxidant molecule, modulates adipogenesis; the following study was designed to evaluate effects of heme on adipogenesis in human mesenchymal stem cells (hMSCs) and mouse pre-adipocytes (3T3L1). Experiments were conducted in the absence and in the presence of a superoxide dismutase mimetic (tempol, 100μM). Heme (10μM) increased (p<0.05) adipogenesis in hMSCs and mouse pre-adipocytes, where tempol alone (100μmol/l) attenuated adipogenesis in these cells (p<0.05). Tempol also reversed heme-induced increase in adipogenesis in both hMSCs and mouse pre-adipocytes (p<0.05). In addition, heme exposed 3T3L1 exhibited reduced (p<0.05) expression of transcriptional regulator–sirtuin 1 (Sirt1), along with, increased (p<0.05) expression of adipogenic markers PPARγ, C/EBPα and aP2. These effects of heme were rescued (p<0.05) in cells concurrently treated with heme and tempol (p<0.05) and prevented in cells over-expressing Sirt1. Taken together, our results indicate that heme-induced oxidative stress inhibits Sirt1, thus un-inhibiting adipogenic regulators such as PPARγ and C/EBPα; which in turn induce increased adipogenesis along with adipocyte hypertrophy in pre-adipocytes. Anti-oxidant induced offsetting of these effects of heme supports the role of heme-dependent oxidative stress in mediating such events.
Keywords: Adipogenesis, Heme, Oxidative stress, Tempol, 3T3L1
INTRODUCTION
Dysfunctional adipogenesis is one of the hallmarks of chronic obesity and is characterized by adipocyte hypertrophy, increased lipid accumulation and altered endocrine function of the adipose tissue (Gesta et al., 2007;Pausova 2006). Adipose tissue regulates energy metabolism and insulin sensitivity via secretion of soluble factors such as adiponectin, leptin and TNFα. This adipocytic function is altered in chronic obesity leading to increased secretion of inflammatory cytokines as opposed to anti-inflammatory adipokines (Kloting et al., 2008;Skurk et al., 2007). Macrophage infiltration of the adipose tissue is another accompaniment of chronic obesity and contributes towards adipocyte dysfunction (Bluher 2008).
Human MSCs and mouse pre-adipocyte cell line, 3T3L1, has been widely used for elucidating mechanisms involved in mammalian adipogenesis (Kim et al., 2010;MacDougald et al., 1995). These pre-adipocytes undergo a well-characterized process of differentiation upon induction with insulin, dexamethasone, and indomethacin (MacDougald et al., 1995). Differentiated 3T3L1 cells exhibit many of the characteristics found in mature adipocytes from mammalian fat tissue, including the production and storage of fat globules and secretion of adipokines and other growth factors. Growth and differentiation of, both, hMSCs and 3T3L1 cells is regulated by various transcription factors, including peroxisome proliferators-activated receptor (PPARγ), C/EBPα, aP2 and MEST proteins. PPARγ, which is central to adipocyte differentiation, has been shown to be both necessary and sufficient for this process (Rosen et al., 2006;Rosen et al., 1999;Hosono et al., 2005).
Recent reports have illustrated potential mechanisms involved in adipocyte dysfunction, including genetic and epigenetic factors such as tissue hypoxia and local and systemic inflammation (Iyer et al., 2010). Imbalances in cellular redox status have also been linked to adipose tissue dysfunction and recent studies have documented inhibitory effects of anti-oxidants on adipogenesis (Kim et al., 2006). Free cellular heme, from denatured heme proteins, has been shown to induce oxidative stress (Nath et al., 1998) and induce differentiation of 3T3L1 cells (Chen et al., 1981). However, mechanisms involved in mediating heme-induced effects on the adipogenic process are sparse and scattered. Previous investigators, including published and un-published work from our lab, have demonstrated a strong correlation between models of obesity and increased oxidative stress (Li et al., 2008;Nicolai et al., 2009); thus, the aim of the current study was to examine direct adipogenic and redox effects of heme, a pro-oxidant (Abraham et al., 1996), in an established model of adipogenesis so as to decipher contributory role of this oxidant molecules in chronic pathological states such as obesity and diabetes. Our results show that exogenous heme, at concentrations of 10μmol/l, increase adipogenesis in both hMSCs and 3T3L1 cells. This increase was associated with enhanced (p<0.05) oxidative stress along with significantly increased expression of adipogenic regulators and markers including, PPARγ, aP2, CEBPα and MEST. Concurrent exposure of heme treated cells to tempol reversed adipogenic and oxidative effects of heme while attenuating protein expression of markers of adipogenesis. In addition, heme-induced increase in adipogenesis was accompanied by a concomitant attenuation of Sirt1, a member of the NAD-dependent deacetylase protein superfamily. Sirt1, an evolutionarily conserved gene form yeasts to mammals, has recently been shown to modulate metabolic homeostasis and promote longevity (reviewed in (Canto et al., 2012)). We show here that pre-adipocytes over-expressing Sirt1 are characterized by reduced adipogenesis, which also, do not respond to heme by increased adipogenesis.
MATERIALS AND METHODS
Cell culture from BM and differentiation into pre-adipocytes
Frozen mouse pre-adipocytes (3T3L1) were purchased from ATCC (ATCC, Manassas, VA). After thawing, 3T3L1 cells were resuspended in an α-minimal essential medium (α-MEM, Invitrogen, Carlsbad CA) supplemented with 10% heat inactivated fetal bovine serum (FBS, Invitrogen, Carlsbad, CA) and 1% antibiotic/antimycotic solution (Invitrogen, Carlsbad, CA). The cells were plated at a density of 1–5X10⁶ cells per 100 cm2 dish. The cultures were maintained at 37°C in a 5% CO2 incubator and the medium was changed after 48h and every 3~4 days thereafter. When the 3T3L cells were confluent, the cells were recovered by the addition of 0.25% trypsin/EDTA (Invitrogen, Carlsbad, CA). 3T3L1 cells (Passage 2–3) were plated in a 96 and 24 well plates at a density of 10,000 cells/cm2 and cultured in α-MEM with 10% FBS until 80% confluence was achieved. The medium was replaced with adipogenic medium, and the cells were cultured for an additional 7 days. The adipogenic media consisted of complete culture medium supplemented with DMEM-high glucose, 10% (v/v) FBS, 10 μg/ml insulin, 0.5 mM dexamethasone (Sigma-Aldrich, St. Louis, MO), 0.5 mM isobutylmethylxanthine (Sigma-Aldrich, St. Louis, MO) and 0.1mM indomethacin (Sigma-Aldrich, St. Louis, MO).
For human MSCs, frozen bone marrow mononuclear cells were purchased from Allcells (Allcells, Emeryville, CA). After thawing, mononuclear cells were resuspended in an α-minimal essential medium (α-MEM, Invitrogen, Carlsbad CA) supplemented with 10% heat inactivated fetal bovine serum (FBS, Invitrogen, Carlsbad, CA) and 1% antibiotic/antimycotic solution (Invitrogen, Carlsbad, CA). The cells were plated at a density of 1–5×10⁶ cells per 100 cm2 dish. The cultures were maintained at 37°C in a 5% CO2 incubator and the medium was changed after 48h and every 3~4 days thereafter. When the MSCs were confluent, the cells were recovered by the addition of 0.25% trypsin/EDTA (Invitrogen, Carlsbad, CA). MSCs (Passage 2–3) were plated in a 96 and 24 well plates at a density of 10,000cells/cm2 and cultured in α-MEM with 10% FBS for 7 days. The medium was replaced with adipogenic medium, and the cells were cultured for an additional 14 days. The adipogenic media consisted of complete culture medium supplemented with DMEM-high glucose, 10% (v/v) FBS, 10 μg/ml insulin, 0.5 mM dexamethasone (Sigma-Aldrich, St. Louis, MO), 0.5 mM isobutylmethylxanthine (Sigma-Aldrich, St. Louis, MO) and 0.1mM indomethacin (Sigma-Aldrich, St. Louis, MO).
Both, hMSCs and 3T3L1, cells were cultured in media containing and not containing heme (1 and 10μM), in the absence and in the presence of tempol (100μM) up until 14 days for hMSCs and 7 days for 3T3L1 cells respectively. Mouse pre-adipocytes were, similarly, also cultured in 75 cm2 flasks, to be used for Immunoblots for adipogenic markers. Media for all cells was changed daily.
Oil Red O staining
For Oil Red O staining, 0.21%Oil Red O in 100% isopropanol (Sigma-Aldrich, St. Louis, MO) was used. Briefly, mouse pre-adipocytes were fixed in 10% formaldehyde, washed in Oil red O for 10 min, rinsed with 60% isopropanol (Sigma-Aldrich, St. Louis, MO), and the Oil Red O eluted by adding 100% isopropanol for 10 min and measured OD at 490 nm, for 0.5 sec reading. Mouse pre-adipocytes were measured by Oil Red O staining (OD=490nm) after day 7. Data is presented with and without normalization by cell numbers (Values at OD=490nm/104 cells ratio).
Comet assay
In order to assess the presence of DNA fragmentation we performed single-cell gel electrophoresis (Comet assay) both on untreated control and differently treated tempol (100μM) and heme (10 μM) and in association (heme and tempol) on 3T3L1cells. The cells were collected using trypsin–EDTA, washed once with PBS, centrifuged and resuspended in a small volume of PBS, in order to obtain no more than 5x10⁴ cells/10μl. Ten micro liters of cell suspension were mixed with 65μl of 0.7% low melting point agarose (LMA) and pipetted onto microscope slides covered with 1% standard melting point agarose (NMA). The slides were lysed (1% N-lauroyl-sarcosine, 2.5M NaCl, 100mM Na2EDTA, 1% Triton X100, 10% DMSO, pH= 10) at 4°C for 1 hour under dark conditions. Then the samples were denatured with high-pH buffer (300mM NaOH, 1mM Na2EDTA, pH= 13) for 20 min, and run in refreshed buffer at 4°C for 40 min at 0.7 V/cm under semi-dark conditions. Afterwards the slides were neutralized in buffer (0.4M Tris-HCl, pH= 7.5), stained with CYBR Green and marked using a Leica fluorescence microscope (Leica, Wetzlar, Germany) interfaced to a computer. For each slide, at least 100 cells were analyzed and DNA images were acquired to quantify the damage. Dedicated software (CASP) allowed the analysis and the quantification of DNA damage by measuring the level of DNA damage as percentage of the fragmented DNA (%TDNA). The results are presented as %DNA, since it is considered to be the most comprehensive and meaningful Comet parameter (Singh et al., 1991).
Lucigenin chemiluminescence
Superoxide detection, in treated and untreated samples, was performed using lucigenin chemiluminescence as described previously (Ahmad et al., 2009). Briefly, 3T3L1 cells, exposed to and not exposed to described treatment combinations, were collected at the end of the treatment period and re-suspended in plastic scintillation mini vials containing 5 μM lucigenin in 1 ml of Krebs solution buffered with 10 mM HEPES-NaOH (pH 7.4). The chemiluminescence from superoxide was measured by a liquid scintillation counter (LS6000IC; Beckman Instruments, San Diego, CA) with a single active photomultiplier tube in a dark room. Background chemiluminescence in the absence of cells was subtracted from subsequent measurements made in the presence of 3T3L1 cells. Cell number was counted before the experiment and the data is presented as counts per minute (CPM) normalized to cell count.
SIRT1 over-expression studies
To examine the role of SIRT1 in mediating heme-induced effects on adipogenesis, SIRT1 was over-expressed in 3T3L1 cells. Mouse SIRT1, full length variant (isoform 1, Gene ID- 93759) was synthesized into pJ603 vector, along with corresponding pJ603-GFP negative control, by DNA 2.0 Inc. (Menlo park, CA, USA). Transfection of the cell line was achieved using FuGENE HD Transfection reagent (Promega Corporation, Madison, WI, USA) as per manufacturer’s protocol. Briefly, 3T3L1 cells were plated at 80% confluence and treated with DNA plasmid at a concentration of 350ng/cm2 in FuGENE HD Transfection reagent at a ratio of DNA/FuGENE HD of 1:3. Tranfection was performed in FBS free OptiMEM media for 24 hrs. After 24 hrs, cells were washed with PBS and adipogenesis induced with adipogenic media, with and without heme. On day 7 of adipogenesis, cells were either fixed for Oil Red O analysis or collected for immunoblotting.
Western blot analysis
Mouse pre-adipocytes were incubated with stimulants in T75 flasks for 24 h. They were then washed with PBS and trypsinized (0.05% trypsin w/v with 0.02% EDTA). The pellets were lysed in buffer (Tris–Cl 50 mM, EDTA 10 mM, Triton X-100 1% v/v, PMSF 1%, pepstatin A 0.05 mM and leupeptin 0.2 mM) and, after mixing with sample loading buffer (Tris–Cl 50 mM, SDS 10% w/v, glycerol 10% v/v, 2-mercaptoethanol 10% v/v and bromophenol blue 0.04%) at a ratio of 4:1, were boiled for 5 min. Samples (10 μg protein) were loaded onto 12% gels and subjected to electrophoresis (150 V, 80 min). The separated proteins were transferred to nitrocellulose membranes (Bio-Rad, Hercules, CA; 1 h, 200 mA per gel). After transfer, the blots were incubated overnight with 5% nonfat milk in TBS followed by incubation with 1:1000 dilution of the primary antibody for 3 h. Polyclonal rabbit antibodies directed against the human CEBPα, MEST and PPAR γ were obtained from Stressgen Biotechnologies (Victoria, BC). After washing with TTBS, the blots were incubated for 2 h with secondary antibody (1:1000) and conjugated with alkaline phosphatase. Finally, the blots were developed using a premixed solution containing 0.56 mM 5-bromo-4-chloro-3-indolyl phosphate (BCIP) and 0.48 mM nitro blue tetrazolium (NBT) in buffer (Tris–HCl 10 mM, NaCl 100 mM, MgCl2 59.3 μM, pH 9.5). The blots were scanned and the optical density of the bands was measured using Scion (New York, NY) Image software.
Statistical analyses
Statistical significance (p<0.05) between experimental groups was determined by the Fisher method of analysis of multiple comparisons. For comparison between treatment groups, the nullhypothesis was tested by either a single-factor ANOVA for multiplegroups or unpaired t test for two groups and the data are presented as mean ± SE.
RESULTS
Effect of Heme on adipogenesis in mouse pre-adipocytes
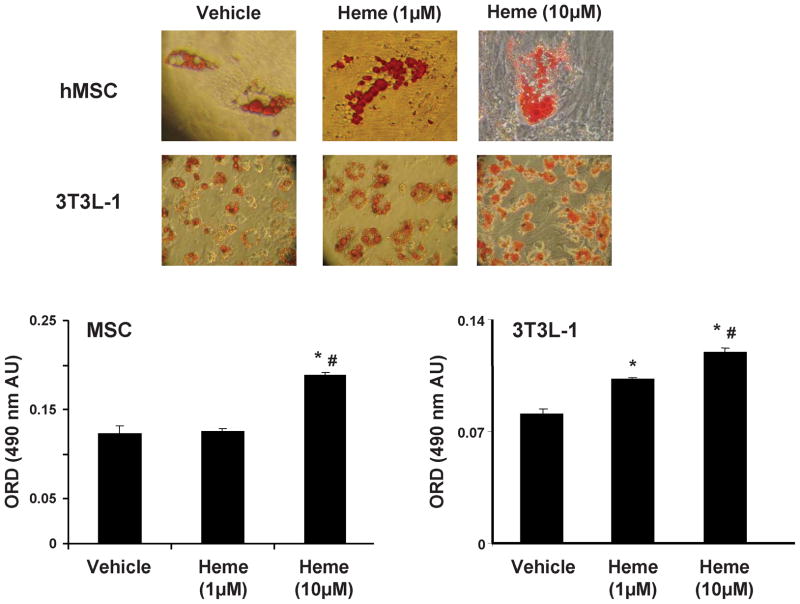
We examined the effect of heme on adipogenesis in hMSCs and 3T3L1 pre-adipocytes; measured as the relative absorbance of Oil Red O on day 7 for 3T3L1 and on day 14 for hMSCs (fig 1). Heme increased (p<0.05) adipogenesis in mouse pre-adipocytes by 28% at 1.0μmol/l and 47.5% at 10.0μmol/l as compared to vehicle (measured by absorbance of oil red o at 490nm). Similarly, heme also enhanced adipogenesis (p<0.05) in hMSCs by 42% at 10μM, although it had no such effect on hMSCs at 1μM concentration (representative images are shown).
Figure 1.
Effect of heme on adipogenesis in hMSC and mouse 3T3L1 cells; Results are means ± SE, n=5/group.Adipogenesis was measured as the relative absorbance of Oil Red O at day 14 (hMSC) and day 7 (3T3L1) after inducing adipogenesis as described in the materials and methods section. * p<0.05 vs. vehicle; # p<0.05 vs. heme (1μM).
Effect of Tempol on adipogenesis in mouse pre-adipocytes
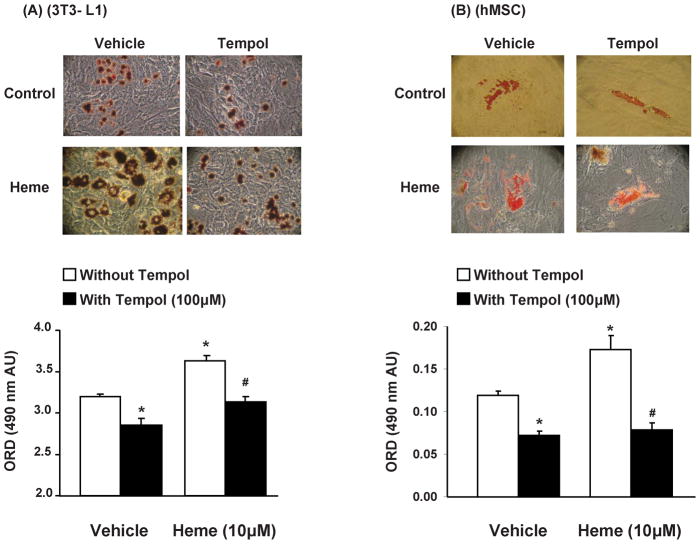
As shown in Figure 2, with representative images shown, we examined the effect of tempol on adipogenesis in hMSCs and mouse pre-adipocytes exposed and not exposed to heme (10μM). Tempol alone (100μmol/l) attenuated adipogenesis, in both hMSCs and 3T3L1 cells (p<0.05) and successfully reversed hemin-induced increase in adipogenesis (p<0.05). This effect of tempol, on heme-induced adipogenesis, was not a result of its effects on cell survival and proliferation as duplicate culture plates showed no significant difference in cell number in wells treated with and without tempol (heme-3.6±0.258 vs. heme + tempol– 4.4±0.477 × 10⁵ cells, n=6, 3T3L1 cells). As the process of adipogenesis is remarkably similar in hMSCs and 3T3L1 cells and heme and tempol exhibited similar effects on both cell types, further experiments for characterization of heme induced adipogenesis were pursued in 3T3L1 cells only.
Figure 2.
Effect of tempol, with and without heme (μM), on adipogenesis in hMSC and mouse 3T3L1 cells; Results are means ± SE, n=5/group. Adipogenesis was measured as the relative absorbance of Oil Red O at day 14(hMSC) and day 7(3T3L1) after inducing adipogenesis as described in the materials and methods section. *p<0.05 vs. vehicle only; #p<0.05 vs. heme without tempol.
Effect of heme and tempol on redox status in 3T3L1 cells
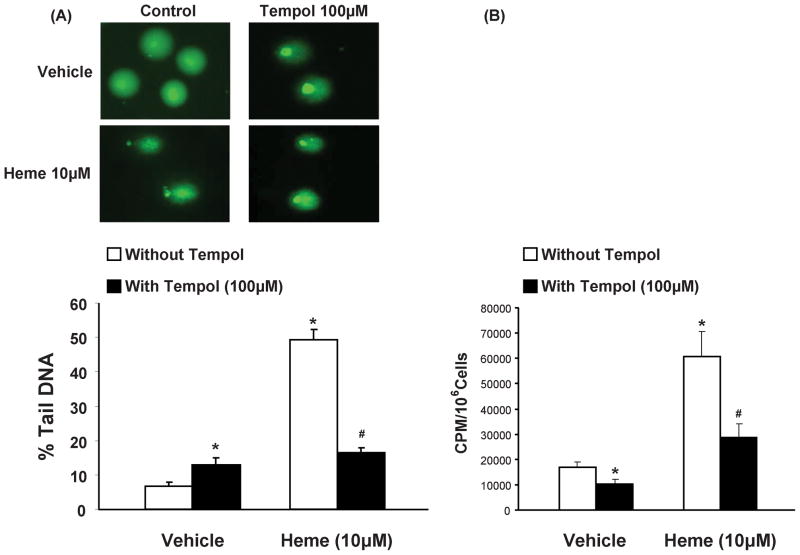
Nuclear DNA fragmentation was examined by alkaline comet assay, as an indicator of cellular redox status (Gedik et al., 2002). Quantification data of the comet assay are reported as %TDNA, in fig. 3(A). The results evidence significant (p<0.05) damaging effect elicited by heme at concentrations of 10μM. Concurrent exposure to tempol (100μM) in heme treated 3T3L1 cells shows the protective action of tempol (p<0.05) on the damaging effect elicited by heme alone on nuclear DNA. Also, pre-adipocytes exposed to tempol alone (p<0.05) demonstrated small, albeit significantly (p<0.05) higher DNA fragmentation as compared to control cells. This effect of tempol on DNA integrity, as measured by comet assay, cannot be fully explained at this time. As such, complementary redox assessment experiments were performed via lucigenin chemiluminesence assay (fig. 3B) which showed that cells exposed to heme displayed significantly higher oxidative stress (p<0.05). Treatment with tempol attenuated oxidative stress in both control and heme treated cells (p<0.05).
Figure 3.
Effect of heme and tempol on DNA damage (A), in 3T3L1 cells, via comet assay; Results are means ± SE, n=5/group; *p<0.05 vs. vehicle only, #p<0.05 vs. heme without tempol. (B) Lucigenin chemiluminesence assay demonstrating effects of heme in 3T3L1 cells, in the absence and in the presence of tempol. Results are means ± SE, n=5/group; *p<0.05 vs. vehicle only; #p<0.05 vs. heme without tempol.
Effect of heme and tempol on aP2 and PPARγ protein expression in pre-adipocytes
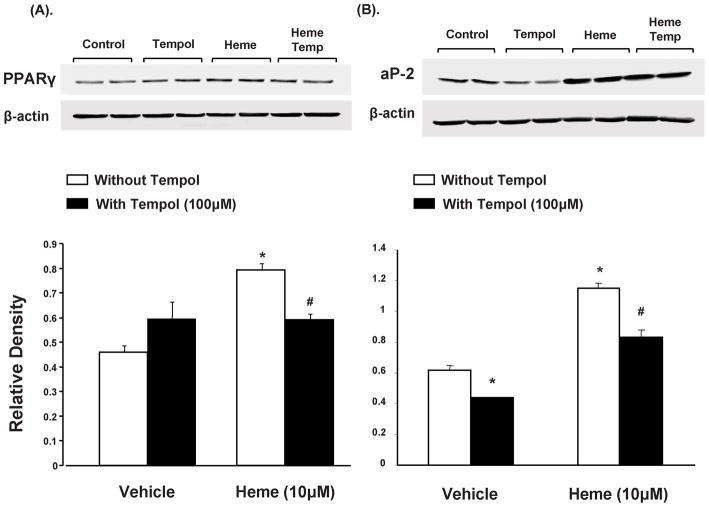
Western blot analysis of PPARγ, normalized against actin, showed a significant increase (p<0.05) in 3T3L1 cells exposed to heme (10μM) compared to the controls, as seen in Figure 4A. Concurrent administration of tempol resulted in decreased PPARγ expression, in heme treated cells. Similar pattern was observed in aP2 protein expression, a marker of adipogenesis, as seen in figure 4B. Treatment with heme increased adipogenesis as indicated by aP2 protein levels as compared to control pre-adipocytes (p<0.05). This effect was attenuated (p<0.05) by concurrent exposure to tempol (100μM).
Figure 4.
Effect of heme and tempol on ap2 and PPARγ protein expression in 3T3L1 cells. (A) Western blot and densitometry analysis of PPARγ levels. Data are shown as mean band density normalized to β-actin, Results are means ± SE, n=5, *p<0.05 vs. vehicle only, #p<0.05 vs. heme without tempol. (B) Western blot and densitometry analysis of ap2 levels. Data are shown as mean band density normalized to β-actin, Results are means ± SE, n=5, *p<0.05 vs. vehicle only; #p<0.05 vs. heme without tempol.
Effect of heme and tempol on MEST, CEBPα and Sirt1 protein expression in pre-adipocytes
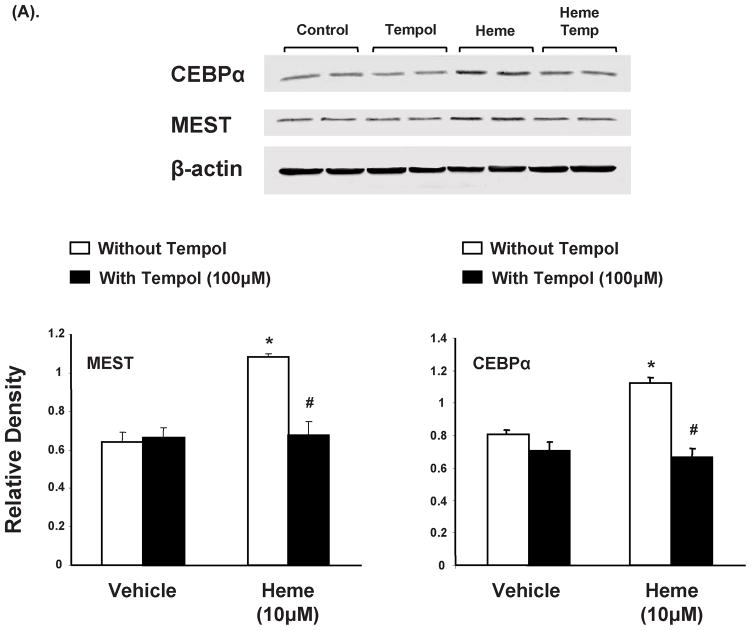
Western blot analysis of MEST, normalized against actin, showed a significant increase (p<0.01) in 3T3L1 cells exposed to heme (10μM) compared to the controls, as seen in Figure 5A. Concurrent administration of tempol resulted in decreased MEST expression, a marker of adipogenesis. Similar pattern was observed in CEBPα protein expression as seen in figure 5A. Treatment with heme increased adipogenesis as indicated by CEBPα protein levels as compared to control pre-adipocytes (p<0.05). This effect was attenuated (p<0.05) by concurrent exposure to tempol (100μM).
Figure 5.
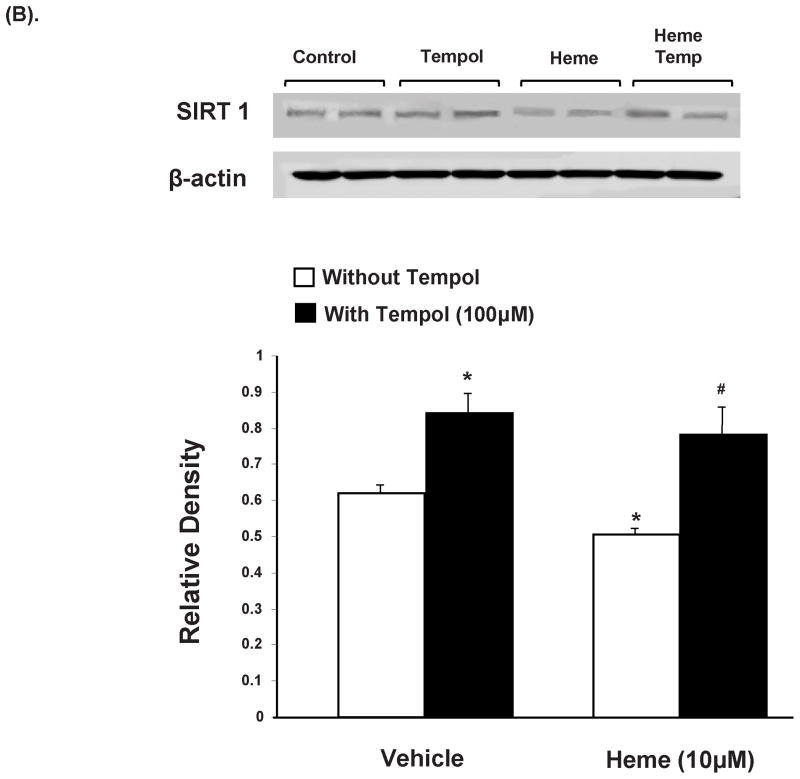
Effect of heme and tempol on MEST and CEBPα protein expression in 3T3L1 cells. (A) Western blot and densitometry analysis of MEST and CEBPα levels. Data are shown as mean band density normalized to β-actin, Results are means ± SE, n=5, *p<0.05 vs. vehicle only; #p<0.05 vs. heme without tempol. (B) Western blot and densitometry analysis of Sirt1 levels. Data are shown as mean band density normalized to β-actin, Results are means ± SE, n=5, *p<0.05 vs. vehicle only; #p<0.05 vs. heme without tempol.
Western blot analysis of SIRT1, normalized against β-actin, revealed expression levels significantly attenuated (p<0.05) in 3T3L1 cells exposed to heme (10μM) as compared to the controls (fig 5B). Concurrent administration of tempol resulted in restoration of SIRT1 expression, in 3T3L1 cells exposed to heme (p<0.05). Also, SIRT1 expression was significantly enhanced in pre-adipocytes exposed to tempol alone (p<0.05).
Effect of Sirt1 over-expression on adipogenesis and adipogenic regulators in mouse pre-adipocytes
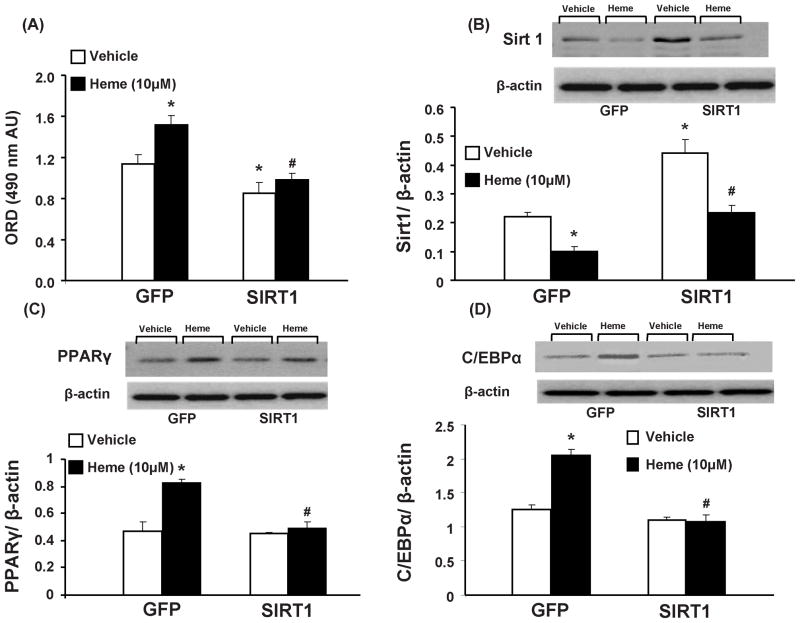
As shown in Figure 6A, 3T3L1 cells transfected with Sirt1 plasmid exhibited lower adipogenesis than cells transfected with the control plasmid. Heme, which increased (p<0.05) adipogenesis in control plasmid treated cells, had no such effect in 3T3L1 cells exposed to the Sirt1 plasmid. In complementary experiments, where 3T3L1 cells transfected with Sirt1 expressed significantly higher (p<0.05) levels of the same; heme treatment attenuated Sirt1 levels in both control and Sirt1 transfected groups (p<0.05). It is noteworthy, that although heme attenuated Sirt1 levels in cells over-expressing Sirt1, the expression was not different from cells treated with a control plasmid.
Figure 6.
Effect of heme and tempol on adipogenesis in 3T3L1 cells transfected by either Sirt1 or GFP containing plasmid. (A) Effect of heme, with and without tempol, on adipogenesis in mouse 3T3L1 cells; Results are means ± SE, n=8/group. Adipogenesis was measured as the relative absorbance of Oil Red O at day 7 after inducing adipogenesis, as described in the materials and methods section. * p<0.05 vs. vehicle in GFP plasmid treated cells; # p<0.05 vs. heme in GFP plasmid treated cells (B) Western blot and densitometry analysis of Sirt1 levels. Data are shown as mean band density normalized to β-actin, Results are means ± SE, n=5, *p<0.05 vs. vehicle in GFP plasmid treated cells; #p<0.05 vs. heme in Sirt1 plasmid treated cells. (C) Western blot and densitometry analysis of PPARγ levels. Data are shown as mean band density normalized to β-actin, Results are means ± SE, n=5, *p<0.05 vs. vehicle in GFP plasmid treated cells; #p<0.05 vs. heme in GFP plasmid treated cells. (D) Western blot and densitometry analysis of C/EBPα levels. Data are shown as mean band density normalized to β-actin, Results are means ± SE, n=5, *p<0.05 vs. vehicle in GFP plasmid treated cells; #p<0.05 vs. heme in GFP plasmid treated cells.
Western blot analysis of PPARγ, normalized against actin, showed a significant increase (p<0.05) in control plasmid treated cells exposed to heme (10μM), as seen in Figure 6C. However, in concurrence with earlier results, pre-adipocytes exposed to Sirt1 plasmid showed no effect in PPARγ expression after exposure to heme. As shown in figure 6D, C/EBPα expression, another adipogenic marker, demonstrated similar patterns; an increased expression (p<0.05) in response to heme in GFP plasmid exposed cells and no such effect in cells over-expressing Sirt1. It should be noted however, that Sirt1 plasmid treated cells, not exposed to heme, were characterized by reduced adipogenesis and enhanced Sirt1 in the absence of any effects on PPARγ or C/EBPα expression.
DISCUSSION
Heme, an iron containing tetrapyrrole, is a prosthetic group in a large number of cellular hemoproteins critical for sustenance of homeostasis (Tsiftsoglou et al., 2006;Tracz et al., 2007). Heme is synthesized in the mitochondria and cytoplasm from δ aminolevulinic acid (ALA) by ALA-synthase. Heme oxygenase (HO) is the only cellular enzyme which degrades heme to equimolar concentration of carbon monoxide (CO), ferric iron and biliverdin (BV) (Abraham et al., 2008). Heme degradation by HO isoforms 1 &2 serves multiple purposes including; regulating bioavailability of heme containing proteins such as cytochrome (CYP) P450s (Laniado-Schwartzman et al., 1992), generation of bioactive metabolites- CO and BV and preventing cellular buildup of free (non-protein bound) heme. Intracellular levels of free heme are regulated by de novo synthesis, heme oxygenase activity and import form extracellular environment (Ponka 1999). Non-protein bound heme is toxic to the cellular environment as it promotes oxidative stress and lipid peroxidation via generation of hydrogen peroxide (H2O2) and other free radical species (Nath et al., 1998;Balla et al., 1993).
The first key finding presented in this study is the demonstration of heme-induced increase in adipogenesis, in both hMSCs and mouse pre-adipocytes, which is characterized by increased lipid accumulation by these cells. Recent studies have shown an inhibition and/or insufficient activation of heme-HO system in conditions associated with chronic oxidative stress, raising the possibility of buildup of free heme in such a setting (Peterson et al., 2008;Nicolai et al., 2009). Also, inflammatory-oxidative events such as atherosclerosis predispose circulating red blood cells (RBCs) to premature hemolysis, releasing free heme into the circulation which can be imported intracellularly and may contribute towards oxidative damage (Balla et al., 1993). As oxidative stress has been causally linked to increased dysfunctional adipogenesis (a hallmark of obesity and diabetes); we examined in vitro effects of exogenous heme, a known pro-oxidant, on adipogenesis in hMSCs and mouse pre-adipocytes. Exogenous heme enhanced adipogenesis and lipid accumulation in both cell types, as measured by Oil Red O-staining. That heme does not stimulate cell proliferation suggest that its effects on adipogenesis are primarily due to adipocyte hypertrophy and increased in lipid droplet size/cell. These observations are in agreement with earlier studies linking oxidative stress to adipose tissue hypertrophy with resultant metabolic dysfunction (Marchesi et al., 2009). Also, it has been well documented now that adipocyte/adipose tissue hypertrophy precedes adipose tissue hypoxia and inflammation in conditions such as obesity (Spalding et al., 2008). Clonal expansion of adipocytes, as opposed to hypertrophic fat accumulation, protects against adipose tissue malfunction including preservation of anti-inflammatory adipokines such as adiponectin (Skurk et al., 2007).
Reversal of heme-induced adipocyte hypertrophy, and increased adipogenesis, by an SOD mimetic highlights the second key finding presented here i.e. the role of heme-induced oxidative stress in mediating its said effects. Involvement of reactive oxygen species (ROS) in mediating heme-induced stimulation of adipogenesis is corroborated by reversal of effects of heme in cells concurrently exposed to tempol. Tempol reduced adipogenesis, even in the absence of heme, which was complemented by its ability to reduce oxidative stress observed in cells exposed or not exposed to heme. This adipogenic effect of heme, and anti-adipogenic effect of tempol, is corroborated during examination of genes regulating the process of adipogenesis. PPARγ, a gene both necessary and sufficient for adipogenesis, is both, enhanced by heme and restored in cells exposed to heme and tempol, in tandem with extent and type of adipogenesis observed in these settings. These results are in line with earlier reports from our lab showing increased levels of adipogenic regulators, mRNA and proteins, in oxidative stress settings associated with attenuated HO system (Barbagallo et al., 2010;Vanella et al., 2011). PPARγ not only induces adipocyte differentiation and fatty acid uptake but also activates other genes, such as C/EBPα and aP2, thus further promoting adipogenesis (Rosen et al., 2002). Similar trends were observed in heme treated cells, where apart from PPARγ, C/EBPα, aP2 and MEST protein expression levels were also significantly enhanced. Tempol-mediated attenuation of adipogenesis, in heme treated cells, along with restoration of adipogenic regulatory proteins points to the role of heme-induced oxidative stress in mediating, at least partly, such effects.
One of the possible mediators of this heme-induced oxidative stress-dependent stimulation of adipogenesis and dysregulation of adipogenic promoters, including PPARγ, is via suppression of Sirt1. Sirt1 is an NAD-dependent deacetylase that is activated by environmental stimuli, such as caloric restriction, and has been shown to suppress PPARγ dependent adipogenesis in 3T3L1 cells (Picard et al., 2004). Also, Sirt1 is amenable to redox manipulations as evidenced by its regulation by intracellular thiols, especially glutathione (Chung et al., 2010). The third key finding, presented in this study, demonstrates modulatory effects of exogenous heme on cellular Sirt1 levels. Heme-dependent attenuation of Sirt1 in pre-adipocytes seems to involve oxidant properties of heme. Tempol-mediated abatement of ROS and enhancement of cellular Sirt1 expression extends credibility to this hypothesis. Heme-induced oxidative stress and concomitant attenuation of cellular Sirt1 could lead to enhanced PPARγ expression along with stimulation of adipogenic regulators dependent on it, such as aP2 and C/EBPα.
That cells over-expressing Sirt1 show resistance to heme-dependent increase in adipogenesis, strongly suggests involvement of this transcriptional regulator in contributing towards such events. The complexity of the system involved, however, is underscored by the observations that basal increase in Sirt1 expression, achieved by either plasmid or antioxidant treatment alone (tempol), in the absence of heme, attenuates adipogenesis without affecting baseline levels of adipogenic regulators such as PPARγ and C/EBPα. These seemingly counterintuitive observations point towards a multi-factorial regulation of this evolutionary conserved protein; which in turn may regulate metabolic balance and processes such as adipogenesis through various different pathways some of which may not involve PPARγ or C/EBPα activation. Whatever the mechanism involved, precise molecular devices leading up to redox-dependent Sirt1 regulation, and their extrapolated effects on adipogenic process, need further exploration and elaboration.
In conclusion, oxidative stress, via its inhibitory effects on Sirt1 expression, could enhance PPARγ levels, the master regulator of adipogenesis. This effect, in turn modulates downstream molecular targets such as C/EBPα, thus, stimulating adipogenesis and lipid droplet accumulation in adipocytes. Heme, whose cellular overload could complicate various patho-physiological states, disrupts cellular redox homeostasis and sets this pro-adipogenic cascade in motion. Over-expression of Sirt1 not only prevents heme-induced adipocyte hypertrophy but also prevents up-regulation of adipogenic regulators such as, PPARγ and C/EBPα. Enhanced adipogenesis with adipocyte hypertrophy, in turn, is one of the leading causes of adipose tissue hypoxia, inflammation and dysfunction.
Acknowledgments
This work was supported by National Institutes of Health grants DK068134, HL55601 and HL34300 (NGA). All authors had full access to the data and take responsibility for its integrity. All authors have read and agree with the manuscript as written. We thank Jennifer Brown for her outstanding editorial assistance in the preparation of the manuscript.
Footnotes
DISCLOSURE
The authors declare no competing financial interests.
References
- Abraham NG, Drummond GS, Lutton JD, Kappas A. The biological significance and physiological role of heme oxygenase. Cell Physiol Biochem. 1996;6:129–168. [Google Scholar]
- Abraham NG, Kappas A. Pharmacological and clinical aspects of heme oxygenase. Pharmacol Rev. 2008;60:79–127. doi: 10.1124/pr.107.07104. [DOI] [PubMed] [Google Scholar]
- Ahmad M, Zhao X, Kelly MR, Kandhi S, Perez O, Abraham NG, Wolin MS. Heme Oxygenase-1 Induction Modulates Hypoxic Pulmonary Vasoconstriction through Upregulation of ecSOD. Am J Physiol Heart Circ Physiol. 2009 doi: 10.1152/ajpheart.00315.2009. [DOI] [PMC free article] [PubMed] [Google Scholar]
- Balla J, Jacob HS, Balla G, Nath K, Eaton JW, Vercellotti GM. Endothelial-cell heme uptake from heme proteins: induction of sensitization and desensitization to oxidant damage. Proc Natl Acad Sci U S A. 1993;90:9285–9289. doi: 10.1073/pnas.90.20.9285. [DOI] [PMC free article] [PubMed] [Google Scholar]
- Barbagallo I, Vanella A, Peterson S, Kim DH, Tibullo D, Giallongo C, Vanella L, Parrinello N, Palumbo G, Di Raimondo F, Abraham NG, Asprinio D. Overexpression of heme oxygenase-1 increases human osteoblast stem cell differentiation. J Bone Miner Metab. 2010;28:276–288. doi: 10.1007/s00774-009-0134-y. [DOI] [PMC free article] [PubMed] [Google Scholar]
- Bluher M. The inflammatory process of adipose tissue. Pediatr Endocrinol Rev. 2008;6:24–31. [PubMed] [Google Scholar]
- Canto C, Auwerx J. Targeting sirtuin 1 to improve metabolism: all you need is NAD+? Pharmacol Rev. 2012;64:166–187. doi: 10.1124/pr.110.003905. [DOI] [PMC free article] [PubMed] [Google Scholar]
- Chen JJ, London IM. Hemin enhances the differentiation of mouse 3T3 cells to adipocytes. Cell. 1981;26:117–122. doi: 10.1016/0092-8674(81)90039-8. [DOI] [PubMed] [Google Scholar]
- Chung S, Yao H, Caito S, Hwang JW, Arunachalam G, Rahman I. Regulation of SIRT1 in cellular functions: role of polyphenols. Arch Biochem Biophys. 2010;501:79–90. doi: 10.1016/j.abb.2010.05.003. [DOI] [PMC free article] [PubMed] [Google Scholar]
- Gedik CM, Boyle SP, Wood SG, Vaughan NJ, Collins AR. Oxidative stress in humans: validation of biomarkers of DNA damage. Carcinogenesis. 2002;23:1441–1446. doi: 10.1093/carcin/23.9.1441. [DOI] [PubMed] [Google Scholar]
- Gesta S, Tseng YH, Kahn CR. Developmental origin of fat: tracking obesity to its source. Cell. 2007;131:242–256. doi: 10.1016/j.cell.2007.10.004. [DOI] [PubMed] [Google Scholar]
- Hosono T, Mizuguchi H, Katayama K, Koizumi N, Kawabata K, Yamaguchi T, Nakagawa S, Watanabe Y, Mayumi T, Hayakawa T. RNA interference of PPARgamma using fiber-modified adenovirus vector efficiently suppresses preadipocyte-to-adipocyte differentiation in 3T3-L1 cells. Gene. 2005;348:157–165. doi: 10.1016/j.gene.2005.01.005. [DOI] [PubMed] [Google Scholar]
- Iyer A, Fairlie DP, Prins JB, Hammock BD, Brown L. Inflammatory lipid mediators in adipocyte function and obesity. Nat Rev Endocrinol. 2010;6:71–82. doi: 10.1038/nrendo.2009.264. [DOI] [PubMed] [Google Scholar]
- Kim DH, Vanella L, Inoue K, Burgess A, Gotlinger K, Manthati VL, Koduru SR, Zeldin DC, Falck JR, Schwartzman ML, Abraham NG. EET-Agonist Regulates Human Mesenchymal Stem Cells-Derived Adipocytes Through Activation of HO-1-pAKT Signaling and a decrease in PPARgamma. Stem Cells Dev. 2010 doi: 10.1089/scd.2010.0098. [DOI] [PMC free article] [PubMed] [Google Scholar]
- Kim JR, Ryu HH, Chung HJ, Lee JH, Kim SW, Kwun WH, Baek SH, Kim JH. Association of anti-obesity activity of N-acetylcysteine with metallothionein-II down-regulation. Exp Mol Med. 2006;38:162–172. doi: 10.1038/emm.2006.20. [DOI] [PubMed] [Google Scholar]
- Kloting N, Schleinitz D, Ruschke K, Berndt J, Fasshauer M, Tonjes A, Schon MR, Kovacs P, Stumvoll M, Bluher M. Inverse relationship between obesity and FTO gene expression in visceral adipose tissue in humans. Diabetologia. 2008;51:641–647. doi: 10.1007/s00125-008-0928-9. [DOI] [PubMed] [Google Scholar]
- Laniado-Schwartzman M, Abraham NG, Sacerdoti D, Escalante B, McGiff JC. Effect of acute and chronic treatment of tin on blood pressure in spontaneously hypertensive rats. Tohoku J Exp Med. 1992;166:85–91. doi: 10.1620/tjem.166.85. [DOI] [PubMed] [Google Scholar]
- Li M, Kim DH, Tsenovoy PL, Peterson SJ, Rezzani R, Rodella LF, Aronow WS, Ikehara S, Abraham NG. Treatment of obese diabetic mice with a heme oxygenase inducer reduces visceral and subcutaneous adiposity, increases adiponectin levels, and improves insulin sensitivity and glucose tolerance. Diabetes. 2008;57:1526–1535. doi: 10.2337/db07-1764. [DOI] [PubMed] [Google Scholar]
- MacDougald OA, Lane MD. Transcriptional regulation of gene expression during adipocyte differentiation. Annu Rev Biochem. 1995;64:345–373. doi: 10.1146/annurev.bi.64.070195.002021. [DOI] [PubMed] [Google Scholar]
- Marchesi C, Ebrahimian T, Angulo O, Paradis P, Schiffrin EL. Endothelial nitric oxide synthase uncoupling and perivascular adipose oxidative stress and inflammation contribute to vascular dysfunction in a rodent model of metabolic syndrome. Hypertension. 2009;54:1384–1392. doi: 10.1161/HYPERTENSIONAHA.109.138305. [DOI] [PubMed] [Google Scholar]
- Nath KA, Grande JP, Croatt AJ, Likely S, Hebbel RP, Enright H. Intracellular targets in heme protein-induced renal injury. Kidney Int. 1998;53:100–111. doi: 10.1046/j.1523-1755.1998.00731.x. [DOI] [PubMed] [Google Scholar]
- Nicolai A, Li M, Kim DH, Peterson SJ, Vanella L, Positano V, Gastaldelli A, Rezzani R, Rodella LF, Drummond G, Kusmic C, L'Abbate A, Kappas A, Abraham NG. Heme Oxygenase-1 Induction Remodels Adipose Tissue and Improves Insulin Sensitivity in Obesity-Induced Diabetic Rats. Hypertension. 2009;53:508–515. doi: 10.1161/HYPERTENSIONAHA.108.124701. [DOI] [PMC free article] [PubMed] [Google Scholar]
- Pausova Z. From big fat cells to high blood pressure: a pathway to obesity-associated hypertension. Curr Opin Nephrol Hypertens. 2006;15:173–178. doi: 10.1097/01.mnh.0000214775.42103.a5. [DOI] [PubMed] [Google Scholar]
- Peterson SJ, Drummond G, Kim DH, Li M, Kruger AL, Ikehara S, Abraham NG. L-4F treatment reduces adiposity, increases adiponectin levels and improves insulin sensitivity in obese mice. J Lipid Res. 2008;49:1658–1669. doi: 10.1194/jlr.M800046-JLR200. [DOI] [PMC free article] [PubMed] [Google Scholar]
- Picard F, Kurtev M, Chung N, Topark-Ngarm A, Senawong T, hado De OR, Leid M, McBurney MW, Guarente L. Sirt1 promotes fat mobilization in white adipocytes by repressing PPAR-gamma. Nature. 2004;429:771–776. doi: 10.1038/nature02583. [DOI] [PMC free article] [PubMed] [Google Scholar]
- Ponka P. Cell biology of heme. Am J Med Sci. 1999;318:241–256. doi: 10.1097/00000441-199910000-00004. [DOI] [PubMed] [Google Scholar]
- Rosen ED, Hsu CH, Wang X, Sakai S, Freeman MW, Gonzalez FJ, Spiegelman BM. C/EBPalpha induces adipogenesis through PPARgamma: a unified pathway. Genes Dev. 2002;16:22–26. doi: 10.1101/gad.948702. [DOI] [PMC free article] [PubMed] [Google Scholar]
- Rosen ED, MacDougald OA. Adipocyte differentiation from the inside out. Nat Rev Mol Cell Biol. 2006;7:885–896. doi: 10.1038/nrm2066. [DOI] [PubMed] [Google Scholar]
- Rosen ED, Sarraf P, Troy AE, Bradwin G, Moore K, Milstone DS, Spiegelman BM, Mortensen RM. PPAR gamma is required for the differentiation of adipose tissue in vivo and in vitro. Mol Cell. 1999;4:611–617. doi: 10.1016/s1097-2765(00)80211-7. [DOI] [PubMed] [Google Scholar]
- Singh NP, Tice RR, Stephens RE, Schneider EL. A microgel electrophoresis technique for the direct quantitation of DNA damage and repair in individual fibroblasts cultured on microscope slides. Mutat Res. 1991;252:289–296. doi: 10.1016/0165-1161(91)90008-v. [DOI] [PubMed] [Google Scholar]
- Skurk T, berti-Huber C, Herder C, Hauner H. Relationship between adipocyte size and adipokine expression and secretion. J Clin Endocrinol Metab. 2007;92:1023–1033. doi: 10.1210/jc.2006-1055. [DOI] [PubMed] [Google Scholar]
- Spalding KL, Arner E, Westermark PO, Bernard S, Buchholz BA, Bergmann O, Blomqvist L, Hoffstedt J, Naslund E, Britton T, Concha H, Hassan M, Ryden M, Frisen J, Arner P. Dynamics of fat cell turnover in humans. Nature. 2008;453:783–787. doi: 10.1038/nature06902. [DOI] [PubMed] [Google Scholar]
- Tracz MJ, Alam J, Nath KA. Physiology and pathophysiology of heme: implications for kidney disease. J Am Soc Nephrol. 2007;18:414–420. doi: 10.1681/ASN.2006080894. [DOI] [PubMed] [Google Scholar]
- Tsiftsoglou AS, Tsamadou AI, Papadopoulou LC. Heme as key regulator of major mammalian cellular functions: molecular, cellular, and pharmacological aspects. Pharmacol Ther. 2006;111:327–345. doi: 10.1016/j.pharmthera.2005.10.017. [DOI] [PubMed] [Google Scholar]
- Vanella L, Kim DH, Sodhi K, Barbagallo I, Burgess AP, Falck JR, Schwartzman ML, Abraham NG. Crosstalk between EET and HO-1 downregulates Bach1 and adipogenic marker expression in mesenchymal stem cell derived adipocytes. Prostaglandins Other Lipid Mediat. 2011;96:54–62. doi: 10.1016/j.prostaglandins.2011.07.005. [DOI] [PMC free article] [PubMed] [Google Scholar]


