

Abstract
The medium spiny neurons (MSNs), which comprise the direct and indirect output pathways from the striatum, use γ-aminobutyric acid (GABA) as their major fact-acting neurotransmitter. We generated mice carrying a conditional allele of the Gad1 gene, which encodes GAD67, one of two enzymes responsible for GABA biosynthesis, and bred them to mice expressing Cre recombinase at the dopamine D1 receptor locus (Drd1a) to selectively reduce GABA synthesis in the direct output pathway from the striatum. We show that these mice are deficient in some types of motor skills, but normal for others, suggesting a differential role for GABA release from D1 receptor-containing neurons.
Keywords: dopamine, GABA, striatum, behavior, Cre-lox recombination
Introduction
Medium spiny neurons (MSNs) are GABA-ergic projection neurons that make up more than 90% of striatal cells (Wilson and Groves, 1980). These cells are divided into two classes, the “direct” and “indirect” pathways. The direct pathway has projections to the substantia nigra pars reticulata, and is also referred to as the striatonigral pathway. By contrast, the indirect pathway ultimately provides input to the substantia nigra pars reticulata, but projects first to the external segment of the globus pallidus, and is thus referred to as the striatopallidal pathway (Gerfen, 1992; Graybiel, 2000). Both classes of MSNs contain receptors for many different neurotransmitters, including glutamate, dopamine, opioids and adenosine (Fink et al., 1992; Kemp and Powell, 1970; Wang et al., 1997). Dopamine D1 receptors (D1R) and D2 receptors (D2R) are generally thought to reside on distinct populations of MSNs, with D1R located on the cells of the direct pathway and D2R located on the cells of the indirect pathway (Gerfen, 1992) although there is also evidence for overlapping expression of D1R and D2R in on MSNs, especially in the ventral striatum (Surmeier et al., 1992). Regardless of the degree of overlap, activation of dopamine receptors located on MSNs regulates the activity of these neurons and consequently the release of GABA, as well as neuropeptides including substance P, dynorphin and enkephalin, in the projection fields (Gerfen et al., 1990). Degeneration of both populations of MSNs, as seen in Huntington’s disease, leads to uncontrolled movement and dystonia, suggesting that these neurons are critical for control of movement (Menalled and Chesselet, 2002). Recent data show that genetic ablation of D1R-containing neurons leads to many behavioral abnormalities (Gantois et al., 2007), however it is unknown whether it is the death of these cells, or simply the lack of released neurotransmitters that is critical for control of movement.
To determine the effect of decreasing GABA production in MSNs, we generated two lines of mice. One line contains the bacterial Cre recombinase gene targeted to the D1R locus (Drd1aCre), allowing for cell-type specific expression of Cre recombinase. The other line contains a conditional glutamic acid decarboxylase-1 gene with loxP sites flanking exon 2 (floxed Gad1). A cross between these two lines of mice was predicted to generate mice with compromised GABA biosynthesis in all MSNs that express D1R. We expected a severe deficit in coordinated movement and general locomotor activity in these mice. However, the observed motor deficits were relatively mild.
Results
Generation of mutant mice
We constructed a targeting vector in which part of the coding sequence of the Drd1a gene was replaced with Cre recombinase (Figure 1a). Homologous recombination of this vector in embryonic stem cells resulted in the replacement of one Drd1a allele such that expression of Cre recombinase is under control of regulatory elements from the Drd1a locus (Drd1aCre/+ or D1R-Cre). Mice were generated from correctly targeted ES cells and bred with Rosa26 reporter line of mice (Soriano, 1999), which revealed extensive expression of β-galactosidase in brain regions known to express D1R, including the striatum, cortex, and hippocampus (see Supplemental Figure 1), and agrees with previously published work (Gong et al., 2003; Lemberger et al., 2007). Drd1aCre/+ mice were phenotypically normal, while Drd1aCre/Cre mice were small and behaved like Drd1a-null mice described previously (Drago et al., 1994).
Figure 1.
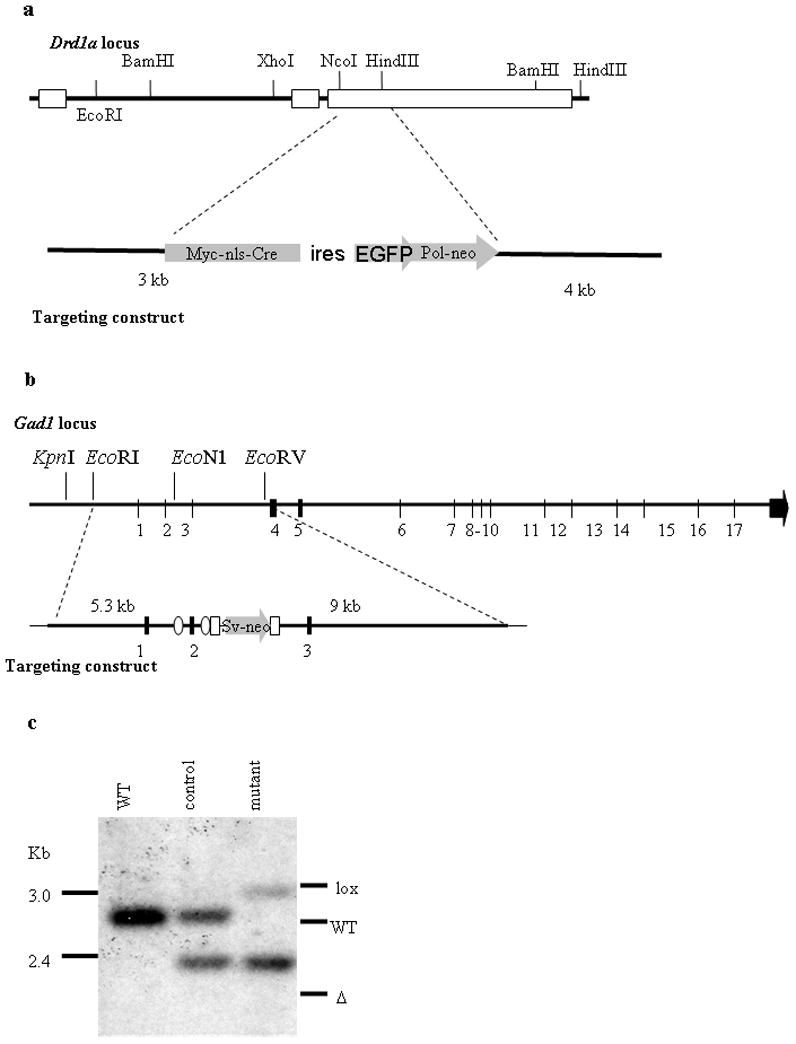
Generation of D1R-Cre and floxed Gad1 mice. a. Targeting strategy for D1R-Cre mice showing endogenous Drd1a locus (top) targeting vector containing Cre recombinase (bottom). b. Targeting strategy for floxed Gad1 mice showing endogenous Gad1 locus (top) targeting vector containing loxP sites (ovals) (bottom). c. Southern blot from striatal tissue showing endogenous Gad1 allele, recombined Gad1 allele and Gad1 allele containing loxP sites.
A second mouse line was generated in which exon 2 of the Gad1 gene was flanked by loxP sites (Figure 1b). Gad1 encodes the GAD67 protein, one of two enzymes responsible for GABA biosynthesis in the brain (Asada et al., 1997). Action of Cre recombinase on this gene leads to deletion of exon 2, and thus causes the mRNA to be out of frame for translation. Mice were bred with Mox2Cre mice (Tallquist and Soriano, 2000) to delete exon 2 in the germline. We designated these animals as Gad1Δ/+. Gad1Δ/+ mice were bred with each other, but no mice in which both Gad1 alleles were deleted survived beyond the perinatal period, as was observed for with Gad1-null mice previously described (Condie et al., 1997).
For the experiments described here, we bred Drd1aCre/+: Gad1Δ/+ mice with Drd1a+/+ : Gad1lox/+ mice. Of the 8 possible offspring genotypes, we identified and studied the two genotypes that were Drd1aCre/+ : Gad1Δ/lox: (which we designate as “mutant”) and Drd1aCre/+ : Gad1Δ/+(which we designate as “control”). We chose this breeding strategy to avoid the possibility of recombination at the Gad1 locus by action of Cre recombinase during germ cell development. Note that the only difference in the genotype between mutant and control animals is that control animals contain a wild-type Gad1 allele, while the same allele in the mutant mice contains loxP sites. Thus cell types with no expression of Cre recombinase should be the same between mutant and control animals, while cell types that express Cre recombinase will have one Gad1 allele in control animals and none in mutant animals. Also, note that all mice in this study were heterozygous at the Drd1a locus. Previous studies with mice heterozygous for Drd1a suggest that they are indistinguishable from wild-type mice in all behaviors tested (Drago et al., 1994; Miner et al., 1995).
Molecular characterization of mutant and controlmice
To confirm that recombination was occurring, DNA was isolated from striatal tissue of wild-type, control, and mutant mice, digested with Xmn1 and examined by Southern blot using a probe that would detect the difference in size of Gad1+, Gad1lox and Gad1Δ alleles. Southern blot analysis revealed one band in the wild-type mouse, corresponding to the endogenous Gad1 gene, and two bands of equal intensity in the control mice corresponding to the wild-type and deleted alleles. The DNA sample from striatum of mutant mice has one band that is slightly larger than the wild-type allele (due to presence of loxP sites) and a more intense deleted allele (Figure 1c). The ratio of the intensity of the two alleles reflects the extent of recombination. As half of the MSNs are estimated to express D1R, and all striatal cells should contain one deleted allele, we would expect the intensity of the deleted band to be about 3 times as intense as the intensity of the Gadlox allele. However, interneurons, glia and endothelial cells also contribute to the DNA sample, and there could be contamination from adjacent brain regions, making an absolute quantification of signal intensity difficult. As a control, we also examined recombination other genotypes not used for subsequent behavioral experiments and cerebellar tissue, where we did not expect D1R expression based on β-galactosidase staining. (Supplemental Figure 2).
We measured GABA levels in striatal punches from wild-type, control, and mutant mice by High Performance Liquid Chromatography (HPLC). We detected only small differences between genotypes (wild-type = 26.11 ± 5.80 pmol/μg; control = 24.37 ± 2.77 and mutant = 18.16 ± 8.92; n= 2 for wild-type and 4 each for control and mutant). These results suggest that heterozygosity for Gad1 does not compromise steady-state GABA levels. We expected to observe at least a small decrease in GABA levels of mutant mice compared to wild-type and control mice due to loss of GAD67 in D1R-containing neurons, but could not detect differences by HPLC. Wild-type, control, and mutant striatal punches were therefore analyzed for GAD67 expression by western blot analysis. As shown in Figure 2a, the GAD67 signal is less intense in striatal tissue taken from mutant mice, as compared to wild-type tissue, with the control mice displaying an intermediate intensity compared to the other two genotypes. Signals were normalized to α-tubulin expression, and pixel intensity quantified. Mutant mice express ~ 54% of wild-type GAD67, while control mice express 75% of wild-type GAD67 levels.
Figure 2.
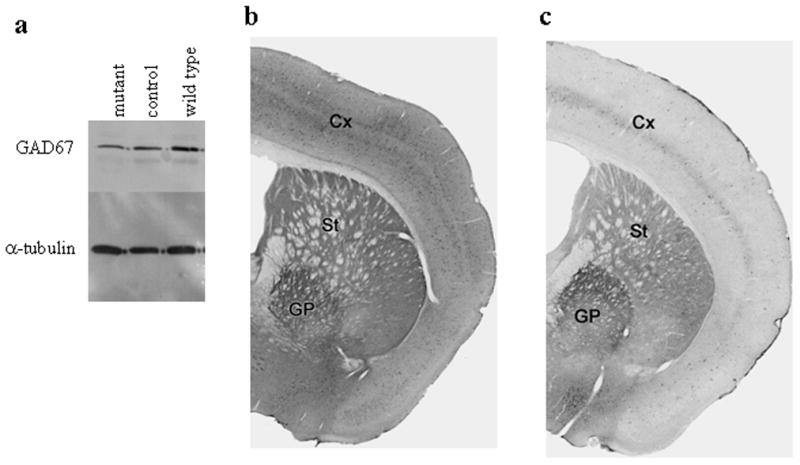
Expression of GAD67. a. Western blot for GAD67 in mutant, control, and wild-type striatal punches. Signals were normalized against α-tubulin. b and c. Immunohistochemistry for GAD67 in coronal sections of control (b) and mutant (c) brains, showing cortex (Cx), striatum (St) and globus pallidus (GP).
Additionally, we performed immunohistochemistry for GAD67 in brains from control and mutant mice. In coronal sections, it is possible to see changes in expression between control and mutant mice in both the cortex and striatum (Figures 2b, c). Both brain regions show an overall decrease in GAD67 labeling in mutant mice. In the cortex, there is a clear decrease in the number of cell bodies that are labeled for GAD67 (Figure 2; Supplemental Figure 3a). In the striatum, a decrease in number of GAD67-labeled cell bodies in the mutant mice is less evident, even though the labeling in the striatum is clearly decreased (Supplemental Figure 3b). We believe that this is due to the majority of GAD67 protein being found in terminal fields and a related lack of distinct labeling in many cell bodies in both wild-type and mutant mice. The number of GAD67-containing cell bodies in the striatum is also difficult to determine accurately because of the normal variability in staining among striatal neurons, and the small amounts of cytoplasm in the medium-spiny neurons. While there is a clear difference in labeling intensity between mutant and wild-type mice in the striatum, the decrease in GAD67 labeling in the mutant mice is likely to reflect differences in GAD67 in both terminal fields and cell bodies. This is not due to an overall decrease in staining of mutant brains compared to control brains, as staining in the globus pallidus is equivalent between the two genotypes.
Clasping behavior
One hallmark of both striatal neurodegeneration and general motor dysfunction is the clasping of hindlimbs when mice are suspended by the tail (Cyr et al., 2003; Gantois et al., 2007; Yamamoto et al., 2000). To test for this, 12 mutant mice and 14 control mice (12–20 weeks old) were suspended by their tails for 15 sec on each of five days. Five out of 12 mutant mice displayed clasping behavior on at least one of the days, and 4 of the 5 displayed clasping behaviors on 2 or more days (Figure 3a). None of the control mice ever displayed clasping behavior (Figure 3b).
Figure 3.
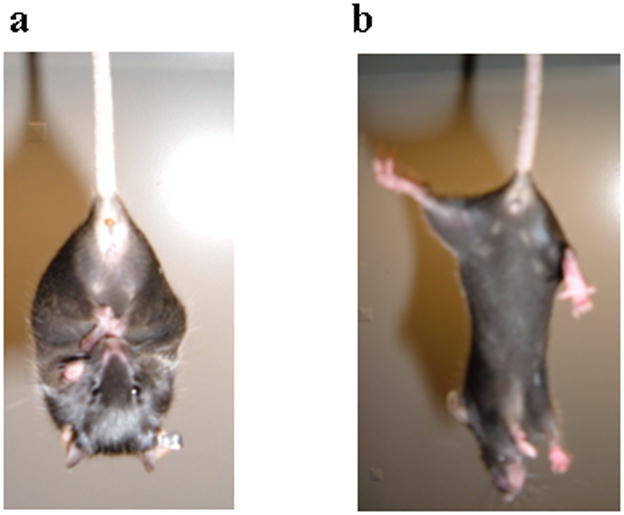
Clasping behavior in mutant mice. a. Clasping phenotype seen in mutant mice when suspended by their tails. b. Splayed limbs seen in controlmice when held by their tails.
Hanging wire grip and negative geotaxis tests
To assess muscle strength, we used the hanging wire grip test, with slight modification (Sango et al., 1996). Mice were placed on an inverted wire-mesh grid and the latency to fall was recorded. While there was no difference between genotypes on the first trial, the control mice did significantly better on the second trial. There was no statistical difference on the third trial, although 10 out of 14 control mice reached the 120 sec maximum, compared to only 5 out of 12 mutant mice (Figure 4a), suggesting a deficiency in the mutant mice.
Figure 4.
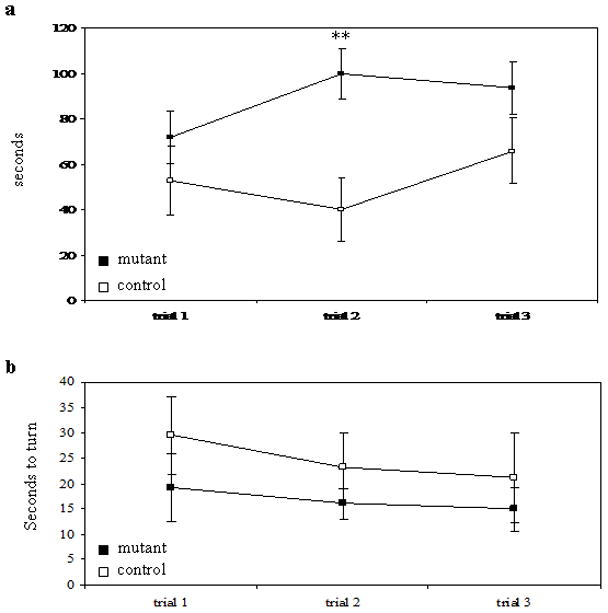
Behavioral tests for motor skills. a. Latency to fall in hanging wire grip test. b. Time to turn in negative geotaxis test. mutant n= 12; control n=14 ** p< 0.01 paired t-test.
In another measure of muscle strength, as well as motor coordination, we used the negative geotaxis test (modified from (Cemal et al., 2002)). In this test, mice were placed face-down on a vertical wire-mesh grid and the time to turn to a face-up position was recorded. In all three trials, mutant mice took longer to turn than control mice, although there was no significant difference between genotypes in any trial (Figure 4b). Only one mouse (from the mutant group) failed to turn in the allotted 120 sec.
Rotarod performance
To determine whether mutant mice showed deficiencies in motor coordination and balance, we used the rotarod task. In this test, mice were placed on a rotating horizontal rod; the rate of rotation gradually increased over 5 min, making the task more difficult. Both mutant and control mice were given 5 trials in a single day. In all five trials, control mice performed significantly better than mutant mice (Figure 5). Control mice also spent significantly more time on the rod during trial 4 than they did during the first trial. Additionally, 5 out of 13 control mice stayed on the rod for 200 sec or more, with one reaching the 300 sec maximum, whereas the longest time spent on the rod by any of the 12 mutant mice was 163 sec.
Figure 5.
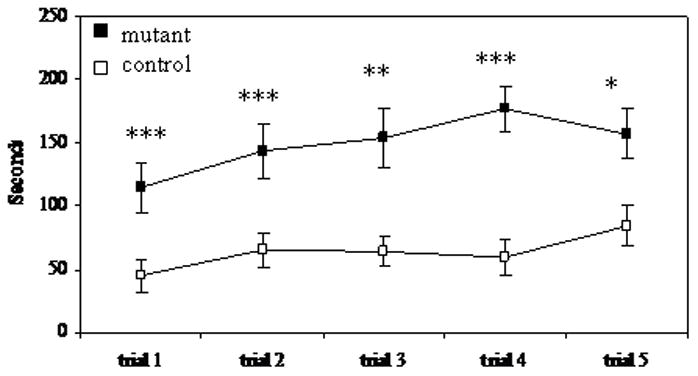
Time spent on rotarod mutant n= 12; control n=14 * p< 0.05, ** p< 0.01, *** p<0.005 paired t-test.
Gait analysis
We examined the pattern of foot movements because differences were found in other models that display motor deficits (Cyr et al., 2003). We measured 5 different parameters – forward stride length, rear stride length, forward base width, rear base width and forward-rear overlap. There was no significant differences between mutant and control mice in any of the parameters measured (Table 1).
Table 1.
Gait Analysis
| Rear stride
|
Forward stride
|
Rear base
|
Forward base
|
Overlap
|
||||||
|---|---|---|---|---|---|---|---|---|---|---|
| Right | Left | Right | Left | Right | Left | Right | Left | Right | Left | |
| Mutant | 56.2 ± 2.6 | 57.9 ± 2.3 | 55.8 ± 2.9 | 55.7 ± 2.8 | 27.0 ± 0.8 | 27.6 ± 0.7 | 17.8 ± 0.9 | 17.8 ± 0.8 | 10.2 ± 1.0 | 10.1 ± 1.0 |
| Control | 51.2 ± 2.1 | 52.9 ± 2.1 | 50.2 ± 2.6 | 53.5 ± 2.0 | 28.4 ± 1.0 | 28.8 ± 1.1 | 17.2 ± 0.5 | 17.1 ± 0.5 | 9.8 ± 0.6 | 10.5 ± 0.8 |
Measurements in gait analysis (in cm, ± SEM) for both right and left sides; n = 11 for mutant mice; n = 14 for control mice.
Locomotor activity
We measured basal locomotor activity in response to a novel environment and over a 2-day period. When placed in a novel environment for 3 hr, both control and mutant mice displayed exploratory behavior that gradually decreased over the course of the experiment (Figure 6a), with no significant difference between genotypes during any interval. When mice were housed in the activity chambers for 2 days, both control and mutant mice showed increased activity during the night as compared to the day. There was no difference in the number of ambulations between genotypes during either night or day for either of the 2 days (Figure 6b).
Figure 6.

Locomotor activity a. Locomotor activity in response to a novel enviornment. b. Locomotor response over a 2 day time period. c. Locomotor response to SKF81297, cocaine and amphetamine for 3h post-treatment. Mutant n= 8; control n=8
To determine if there was a difference in locomotion in response to pharmacological activation of MSNs, we tested mice in response to the D1R agonist SKF81297 (7.5 mg/kg) as well as the psychostimulants cocaine (20 mg/kg) and amphetamine (5 mg/kg). Previous work in the lab has shown that animals with intact, but dysfunctional dopamine signaling, the response to these drugs is abnormal (Heusner et al., 2003; Kim et al., 2000; Szczypka et al., 1999). We expected that if loss of GAD67 in D1R-containing MSNs caused dysfunction of these neurons, we would see a decreased locomotor response to these drugs. While all three drugs elicited a locomotor response that was greater than the response to vehicle alone, there was no difference between the genotypes for any of the treatments (Figure 6c).
Discussion
Mouse models of striatal neurodegeneration display behavioral abnormalities, including clasping, tremor, hypoactivity and hyperkinesia (Cyr et al., 2003; Menalled and Chesselet, 2002). These phenotypes are similar to those observed in mice in which D1R-containing cells have been ablated by expression of the catalytic subunit of diphtheria toxin under the D1R promoter (Drago et al., 1998) and mice that lack both the cAMP-response-element modulatory (CREM) and the cAMP-response-element binding (CREB) transcription factors specifically in striatal cells (Mantamadiotis et al., 2002). As GABA is the major neurotransmitter released from the D1R-expressing cells, we wanted to test to what extent altering GABA signaling in D1R-containing neurons contributes to motor behaviors.
Because there are two different populations of MSNs (striatopallidal and striatonigral) and co-release of other neuromodulators, such as substance P, dynorphin and enkephalin, from MSNs, it is difficult to tease apart the role of GABA release from a subset of MSNs. We addressed part of the question by inactivation of the Gad1 gene in cells that express D1R. There are two glutamate decarboxylase genes, Gad1 and Gad2. Whereas Gad1-null mice die at birth, Gad2 mice are viable but they are prone to seizures (Asada et al., 1996; Asada et al., 1997; Condie et al., 1997; Kash et al., 1997). GAD67, encoded by Gad1, is thought to be catalyze the majority of GABA synthesis under normal, resting conditions, while GAD65 plays the major role in producing activity-dependent GABA (Patel et al., 2006; Sheikh and Martin, 1998), perhaps explaining why Gad2-null mice display a seizure phenotype. Because of the presence of GAD65 in cells in which we have deleted GAD67, it is possible that GABA levels in these cells are approaching normal during some of the behavioral tasks, masking behavioral differences. However, western blot analysis of GAD65 does not show a compensatory increase in total GAD65 levels in mutant compared to control or wild-type mice (data not shown) so any compensation would be due to activity of GAD65 rather than an overall increase in protein levels. Another possibility is that GABA released by other nearby cells may be recycled into MSNs by the action of the reuptake transporter (Dodd et al., 1989). Despite these possibilities for regulating GABA levels in the absence of GAD67 in D1R-containing cells, we observed some behavioral phenotypes, including clasping behavior and decreased motor coordination, as measured by the hanging wire grip and rotarod tests. However, other behaviors, including gait analysis, basal locomotor activity, and locomotor response to a D1R agonist or psychostimulants were normal. We have not observed any striatal cell loss or any other brain abnormalities in mice up to 8 months of age indicating that Gad1 function is not required for survival of MSNs. These data suggest that changes in GABA neurotransmission contribute to some of the behavioral phenotypes, but there is compensation by other cells, enzymes and/or neuromodulators typically released with GABA that function to keep other behaviors normal.
Early studies concluded that there are two distinct populations of MSNs, with the striatonigral neurons containing D1R and co-releasing substance P and dynorphin, and the striatopallidal neurons expressing D2R and co-releasing enkephalin (Gerfen et al., 1990). This conclusion is supported by the ablation of DIR-expressing cells with diphtheria toxin, which left D2R expression intact (Drago et al., 1998), functional studies suggesting separate populations of D1R and D2R-expressing cells (Lee et al., 2006; Lobo et al., 2006), and a recent report describing the generation of a BAC transgenic mouse line in which D1R-containing cells are marked by a red fluorophore and D2R-containing cells are marked with a green fluorophore (Shuen et al., 2008). However, other evidence suggests that D1R and D2R can be co-expressed by MSNs (Aizman et al., 2000; Surmeier et al., 1992). We expected that quantification of a decrease in the number of striatal GAD67-positive cells would indicate what percentage of MSNs in our mice express D1R; however, we were unable to draw such conclusions. Our inability to quantify the number of GAD67-containing neurons was due to the majority of staining in the striatum being found in terminal fields. While the approximately 50% decrease in striatal GAD67 levels detected by western blot in mutant compared to wild-type mice suggest that nearly half of the MSNs lack GAD67, it was not possible to co-stain with other markers of MSNs to show this definitively. Thus, the possibility of co-expression of D1R and D2R make it difficult to interpret the data presented here in terms of reduced GABA signaling in the direct versus indirect pathway.
The behavioral abnormalities we observed may be due, at least in part, to loss of GABA signaling by neurons outside of the striatum. We focused on the striatum because it is the brain region in which dopamine receptors are the most abundant, but dopamine receptors are also found in other brain regions, including the cortex. Anatomical studies have shown that both D1R and D2R are found on pyramidal cells, including cortico-striatal excitatory cells (Bergson et al., 1995; Khan et al., 1998; Mrzljak et al., 1996). Interestingly, dopamine receptors were also shown to be present on GABA-ergic interneurons, with parvalbumin-expressing neurons co-expressing both D1R and D2R, and calbindin-expressing neurons only expressing D1 receptors. (Le Moine and Gaspar, 1998). Although cortical GABA-ergic interneurons are reported to represent only 15–20% of total cortical neurons (Beaulieu, 1993; Markram et al., 2004), the extensive axonal arborizations provide input throughout the cortex. As our immunohistochemistry data indicates a noticeable difference in GAD67 in the cortex between mutant and control brains, it may be necessary consider the contribution of these neurons to the phenotypes described. While we are attempted to focus on behaviors believed to require intact striatal neurotransmission, it is conceivable that a more comprehensive behavioral or electrophysiological examination would reveal difference due to changes in GABA signaling in cortical interneurons.
Striatal MSNs are clearly involved in motor behaviors, as evidenced by Huntington’s disease models as well as other animal models that lead to mutations in striatal cells. Additionally, recently described mouse lines with drastic cell loss in the striatum display some of the phenotypes described here (Cyr et al., 2003; Gantois et al., 2007). While our mutation was much less severe, it is notable that we were able to recapitulate phenotypic abnormalities such as clasping behavior and rotarod deficiency. This speaks to the importance of GABA signaling, as even an incomplete loss of GAD67 in a subset of neurons can lead to measurable behavioral differences. Further studies of the cell types and circuitry being affected will help us to gain an understanding of the role of GABA in striatal signaling.
Materials and Methods
Generation of Drd1aCre mutant mice
The targeting construct contained 7.0 kb of 129/Sv-derived Drd1a receptor genomic sequence. The NcoI site that contained the initiation codon of the Drd1a locus was converted to a BglII site, effectively destroying the initiation codon. Cre recombinase containing a myc nuclear localization signal was cloned between this BglII site and a downstream HindIII site, replacing approximately 130 bp of the endogenous Drd1a gene. The resulting targeting construct had ~ 3 kb of genomic Drd1a DNA 5′ and ~ 4 kb of Drd1a DNA 3′ to the Cre recombinase. Immediately downstream of the Cre recombinase gene, we inserted an internal ribosome entry site (ires) followed by an EGFP gene. A pol-Neo cassette was inserted immediately after the EGFP to allow for selection in embryonic stem cells.
The linearized targeting vector was electroporated into AK 18.1 embryonic stem cells derived from a 129/Sv mouse line. G418-resistant clones were expanded and screened by Southern blotting. For Southern blots, genomic DNA was digested with HindIII and probed with a 300-bp fragment of DNA from the Drd1a receptor locus immediately 5′ to the targeting vector. Homologous recombination resulted in a product that was ~ 4 kb larger than the wild-type product. Of 180 clones screened, 9 were correctly targeted, and 1 gave germline transmission. Progeny carrying the mutant allele were genotyped by PCR to detect the presence or absence of the neomycin gene and confirmed by Southern blot. Further genotyping was carried out using primers flanking the inserted sequence and a primer from the Cre recombinase gene. The mice containing the targeted mutation – Drd1a Cre (designated D1R-Cre mice) were maintained on a mixed C57Bl/6 × 129/Sv background.
Generation of floxed Gad1 mice
Conditional Gad1 mice (floxed Gad1) were made as previously described (Chattopadhyaya et al., 2007). Briefly, the targeting vector contained the endogenous Gad1 gene with loxP sites inserted in the introns flanking exon 2, as well as an Sv-NeoR gene flanked by Flp recombinase sites (Figure 1b). After removing the Sv-NeoR selectable gene by the action of FLP recombinase, the resulting Gad1lox/+ mice were bred with each other to generate Gad1lox/lox mice, which were phenotypically normal.
Southern blot analysis to examine recombination
DNA from striatum or cerebellum was digested with Xmn1, electropohoresed on 1.0 agarose gels, transferred to nylon membranes (Zetaprobe, Bio-Rad) and hybridized with a unique probe that would distinguish the Gad1+, Gad1lox and Gad1Δ alleles.
Maintenance and care of animals
Mice were housed in a modified specific-pathogen-free facility under a 12:12 light:dark cycle. Food (Purina 5053) and water were available ad libitum. During the 2-day locomotor experiment, food and water were available ad libitum; however, during all other experimental procedures food and water were not available for the length of the test. All procedures were conducted in accordance with guidelines established by the National Institutes of Health and the University of Washington Animal Care Committee. All mice were tested between 2 and 6 months of age.
Western blot analysis
Striatal punches were taken from adult mice and quickly frozen on dry ice. Tissue was lysed in modified RIPA buffer (50 mM Tris-HCl pH 7.4, 1% NP-40, 1% sodium deoxycholate; 150 mM NaCl, 1mM EDTA and protease inhibitors), and insoluble material was spun down at top speed for 15 min. The remaining soluble protein was measured by Bradford assay. 20 μg of total protein was separated on a 10% SDS-PAGE, and transferred to PVDF membrane. The membrane was blocked in 5% milk in TBS-Tween, incubated overnight at 4°C with a mouse monoclonal GAD67 antibody (1:5000, Millipore, MAB5406), or GAD65 (1:1000, Development Studies Hybridoma Bank, University of Iowa, clone GAD-6) and then with an anti-mouse secondary antibody (1:3000, Cell Signaling, 7076) for 2 hr at room temperature and developed with ECL Plus (GE Healthcare). The membrane was subsequently stripped and re-probed with a monoclonal antibody to α-tubulin (1:10,000, Sigma).
Immunohistochemistry
Coronal sections of the forebrain were prepared for immunohistochemistry as described previously (Esclapez and Houser, 1999), and free-floating sections were processed for GAD67 immunolabeling with avidin-biotin peroxidase methods (Peng and Houser, 2005). Sections were incubated in mouse GAD67 primary antibody (1:2000; Millipore MAB5406) overnight at room temperature. Sections were rinsed and then incubated in biotinylated secondary antiserum (horse anti-mouse IgG, 1:200; Vector Laboratories, Burlingame, CA) for 1 hr, followed by a 1 hr incubationin avidin-biotin peroxidase complex (1:100; Vectastain EliteABC; Vector Laboratories). To visualize the peroxidaselabeling, sections were processed with 0.06% diaminobenzidinetetrahydrochloride (DAB) and 0.006% H2O2 diluted in 0.075 MPBS for 12 min, and immunolabeling was enhanced by incubationin 0.003% osmium tetroxide in PBS for 30 sec. Sections were analyzed and digital images obtained with a Zeiss (Thornwood, NY) Axioplan 2 microscope equipped with an AxioCam digital camera system and AxioVision 4.6 software.
X-gal staining
Histological sections (40 μm) were prepared as previously described (Heusner et al., 2003). Sections were washed in 100 mM sodium phosphaste buffer containing 2mM magnesium chloride, 0.1% sodium deoxycholate and 0.2% NP-40 three times for 30 min each. Incubation in 1 mg/ml X-gal solution containing 1.65mg/ml potassium ferricyanide and 1.84 mg/ml potassium ferrocyanide occurred overnight, with tissue protected from light. Sections were mounted on slides, and counter-stained with nuclear fast red (Sigma, 0.1% in 5% aluminum sulfate).
Behavioral analysis
Clasping behavior analysis
Mice were held suspended by the tail for 15 sec once a day for 5 days. If the animal brought its hindlimbs together within the 15-sec time-period, a hindlimb grasp was scored.
Hanging wire grip test
Mice were placed atop a wire grid (15.5-cm square section of 0.5-cm grid) which was gently raised and lowered 3 times to encourage the animal to grip. The grid was inverted and secured 42 cm above a padded surface. The latency to fall from the grid was recorded, with a maximum time of 120 sec. Mice were subjected to 3 trials, with a 20 min inter-trial interval.
Negative geotaxis test
Mice were placed in the middle of a vertical wire grid (15.5 cm-square section of 0.5-cm grid, secured 23 cm above a padded surface) with their head facing down. Latency to orient in a heads-up position was scored, with a maximum of 120 sec. Mice were subjected to 3 trials, with a 20 min inter-trial interval.
Rotarod
Rotarod testing was performed on an apparatus (Ugo Basile, Varese, Italy) that gradually increased speed (from 5 to 35 rpm) over a period of 5 min. Mice were placed on the apparatus, and rotation was initiated. Latency to fall was recorded. Mice were subjected to 5 trials, with a 20 min inter-trial interval.
Gait analysis
Footprint analysis for gait abnormalities was performed as described previously (Carter et al., 1999; Perez and Palmiter, 2005). Mice were subjected to one trial a day for 3 days. 5 parameters were measured – forward stride length, rear stride length, forward base width, rear base width and forward-rear overlap. For each parameter, the average score of five data points was used for each mouse.
Locomotor behavior
Locomotor activity was measured in transparent Plexiglas cages (40 × 20 × 20 cm) set in activity chambers equipped with 4 infrared beams set 8.8 cm apart (San Diego Instruments, San Diego CA). The number of consecutive beam breaks is reported as ambulations.
Response to drugs
SKF81297 (7.5 mg/kg body weight), amphetamine (5 mg/kg body weight) and cocaine (20 mg/kg body weight) were all obtained from Sigma, St. Louis, MO. Drugs were dissolved in PBS (10 mM phosphate, 150 mM NaCl, pH 7.0). Vehicle treatment was PBS alone. All treatments were by intraperitoneal injection at 10 μl/g body weight. Animals were allowed to acclimate to the testing chambers for 3 h, after which they received an injection of either vehicle or drug. Locomotor activity in response to treatment was then recorded for an additional 3 h. Animals were then removed from the testing chambers and returned to their home cages.
Data analysis
Hanging wire grip, negative geotaxis and rotarod analysis was performed with paired t-tests between the genotypes at each trial. Additionally, two-way ANOVA (genotype x trial) was performed on rotarod data to determine significant differences between trials.
Supplementary Material
β-Galactosidase histochemistry of mice generated by crossing D1R-Cre mice with ROSA26 reporter mice. a. Expression in cortex (arrow) and striatum (asterix). b. Expression in cortex (arrow) and hippocampus (arrowhead).
Southern blot of additional genotypes. In addition to the Southern blot analysis shown in Figure 1c, we also included samples from genotypes not used for behavioral analysis. The Drd1aCre/+ : Gad1lox/+ sample has three bands; the upper and lower bands represent Gad1lox allele before and after recombination, respectively, while the middle band is the wild-type allele. We also examined recombination in the cerebellum, where D1R is not expressed in these mice.
Magnified sections of GAD67 immunohistochemistry. a. Magnified images of cortical staining in control and mutant mice. b. Magnified images of striatal staining in control and mutant animals.
Acknowledgments
The authors thank Christine Huang and Yilana Cetina for tissue preparation and immunohistochemical labeling for GAD67, Bethany Sotak for tissue preparation and Glenda Froelick for help with tissue processing and staining. This work was supported by Veterans Affairs Medical Research Funds (C.R.H.), and National Institutes of Health Grant (C.R.H.).
References
- Aizman O, Brismar H, Uhlen P, Zettergren E, Levey AI, Forssberg H, Greengard P, Aperia A. Anatomical and physiological evidence for D1 and D2 dopamine receptor colocalization in neostriatal neurons. Nat Neurosci. 2000;3:226–230. doi: 10.1038/72929. [DOI] [PubMed] [Google Scholar]
- Asada H, Kawamura Y, Maruyama K, Kume H, Ding R, Ji FY, Kanbara N, Kuzume H, Sanbo M, Yagi T, Obata K. Mice lacking the 65 kDa isoform of glutamic acid decarboxylase (GAD65) maintain normal levels of GAD67 and GABA in their brains but are susceptible to seizures. Biochem Biophys Res Commun. 1996;229:891–895. doi: 10.1006/bbrc.1996.1898. [DOI] [PubMed] [Google Scholar]
- Asada H, Kawamura Y, Maruyama K, Kume H, Ding RG, Kanbara N, Kuzume H, Sanbo M, Yagi T, Obata K. Cleft palate and decreased brain gamma-aminobutyric acid in mice lacking the 67-kDa isoform of glutamic acid decarboxylase. Proc Natl Acad Sci U S A. 1997;94:6496–6499. doi: 10.1073/pnas.94.12.6496. [DOI] [PMC free article] [PubMed] [Google Scholar]
- Beaulieu C. Numerical data on neocortical neurons in adult rat, with special reference to the GABA population. Brain Res. 1993;609:284–292. doi: 10.1016/0006-8993(93)90884-p. [DOI] [PubMed] [Google Scholar]
- Bergson C, Mrzljak L, Smiley JF, Pappy M, Levenson R, Goldman-Rakic PS. Regional, cellular, and subcellular variations in the distribution of D1 and D5 dopamine receptors in primate brain. J Neurosci. 1995;15:7821–7836. doi: 10.1523/JNEUROSCI.15-12-07821.1995. [DOI] [PMC free article] [PubMed] [Google Scholar]
- Carter RJ, Lione LA, Humby T, Mangiarini L, Mahal A, Bates GP, Dunnett SB, Morton AJ. Characterization of progressive motor deficits in mice transgenic for the human Huntington’s disease mutation. J Neurosci. 1999;19:3248–3257. doi: 10.1523/JNEUROSCI.19-08-03248.1999. [DOI] [PMC free article] [PubMed] [Google Scholar]
- Cemal CK, Carroll CJ, Lawrence L, Lowrie MB, Ruddle P, Al-Mahdawi S, King RH, Pook MA, Huxley C, Chamberlain S. YAC transgenic mice carrying pathological alleles of the MJD1 locus exhibit a mild and slowly progressive cerebellar deficit. Hum Mol Genet. 2002;11:1075–1094. doi: 10.1093/hmg/11.9.1075. [DOI] [PubMed] [Google Scholar]
- Chattopadhyaya B, Di Cristo G, Wu CZ, Knott G, Kuhlman S, Fu Y, Palmiter RD, Huang ZJ. GAD67-mediated GABA synthesis and signaling regulate inhibitory synaptic innervation in the visual cortex. Neuron. 2007;54:889–903. doi: 10.1016/j.neuron.2007.05.015. [DOI] [PMC free article] [PubMed] [Google Scholar]
- Condie BG, Bain G, Gottlieb DI, Capecchi MR. Cleft palate in mice with a targeted mutation in the gamma-aminobutyric acid-producing enzyme glutamic acid decarboxylase 67. Proc Natl Acad Sci U S A. 1997;94:11451–11455. doi: 10.1073/pnas.94.21.11451. [DOI] [PMC free article] [PubMed] [Google Scholar]
- Cyr M, Beaulieu JM, Laakso A, Sotnikova TD, Yao WD, Bohn LM, Gainetdinov RR, Caron MG. Sustained elevation of extracellular dopamine causes motor dysfunction and selective degeneration of striatal GABAergic neurons. Proc Natl Acad Sci U S A. 2003;100:11035–11040. doi: 10.1073/pnas.1831768100. [DOI] [PMC free article] [PubMed] [Google Scholar]
- Dodd PR, Watson WE, Morrison MM, Johnston GA, Bird ED, Cowburn RF, Hardy JA. Uptake of gamma-aminobutyric acid and L-glutamic acid by synaptosomes from postmortem human cerebral cortex: multiple sites, sodium dependence and effect of tissue preparation. Brain Res. 1989;490:320–331. doi: 10.1016/0006-8993(89)90249-7. [DOI] [PubMed] [Google Scholar]
- Drago J, Gerfen CR, Lachowicz JE, Steiner H, Hollon TR, Love PE, Ooi GT, Grinberg A, Lee EJ, Huang SP, et al. Altered striatal function in a mutant mouse lacking D1A dopamine receptors. Proc Natl Acad Sci U S A. 1994;91:12564–12568. doi: 10.1073/pnas.91.26.12564. [DOI] [PMC free article] [PubMed] [Google Scholar]
- Drago J, Padungchaichot P, Wong JY, Lawrence AJ, McManus JF, Sumarsono SH, Natoli AL, Lakso M, Wreford N, Westphal H, Kola I, Finkelstein DI. Targeted expression of a toxin gene to D1 dopamine receptor neurons by cre-mediated site-specific recombination. J Neurosci. 1998;18:9845–9857. doi: 10.1523/JNEUROSCI.18-23-09845.1998. [DOI] [PMC free article] [PubMed] [Google Scholar]
- Esclapez M, Houser CR. Up-regulation of GAD65 and GAD67 in remaining hippocampal GABA neurons in a model of temporal lobe epilepsy. J Comp Neurol. 1999;412:488–505. [PubMed] [Google Scholar]
- Fink JS, Weaver DR, Rivkees SA, Peterfreund RA, Pollack AE, Adler EM, Reppert SM. Molecular cloning of the rat A2 adenosine receptor: selective co-expression with D2 dopamine receptors in rat striatum. Brain Res Mol Brain Res. 1992;14:186–195. doi: 10.1016/0169-328x(92)90173-9. [DOI] [PubMed] [Google Scholar]
- Gantois I, Fang K, Jiang L, Babovic D, Lawrence AJ, Ferreri V, Teper Y, Jupp B, Ziebell J, Morganti-Kossmann CM, O’Brien TJ, Nally R, Schutz G, Waddington J, Egan GF, Drago J. Ablation of D1 dopamine receptor-expressing cells generates mice with seizures, dystonia, hyperactivity, and impaired oral behavior. Proc Natl Acad Sci U S A. 2007;104:4182–4187. doi: 10.1073/pnas.0611625104. [DOI] [PMC free article] [PubMed] [Google Scholar]
- Gerfen CR. The neostriatal mosaic: multiple levels of compartmental organization. Trends Neurosci. 1992;15:133–139. doi: 10.1016/0166-2236(92)90355-c. [DOI] [PubMed] [Google Scholar]
- Gerfen CR, Engber TM, Mahan LC, Susel Z, Chase TN, Monsma FJ, Jr, Sibley DR. D1 and D2 dopamine receptor-regulated gene expression of striatonigral and striatopallidal neurons. Science. 1990;250:1429–1432. doi: 10.1126/science.2147780. [DOI] [PubMed] [Google Scholar]
- Gong S, Zheng C, Doughty ML, Losos K, Didkovsky N, Schambra UB, Nowak NJ, Joyner A, Leblanc G, Hatten ME, Heintz N. A gene expression atlas of the central nervous system based on bacterial artificial chromosomes. Nature. 2003;425:917–925. doi: 10.1038/nature02033. [DOI] [PubMed] [Google Scholar]
- Graybiel AM. The basal ganglia. Curr Biol. 2000;10:R509–511. doi: 10.1016/s0960-9822(00)00593-5. [DOI] [PubMed] [Google Scholar]
- Heusner CL, Hnasko TS, Szczypka MS, Liu Y, During MJ, Palmiter RD. Viral restoration of dopamine to the nucleus accumbens is sufficient to induce a locomotor response to amphetamine. Brain Res. 2003;980:266–274. doi: 10.1016/s0006-8993(03)02986-x. [DOI] [PubMed] [Google Scholar]
- Kash SF, Johnson RS, Tecott LH, Noebels JL, Mayfield RD, Hanahan D, Baekkeskov S. Epilepsy in mice deficient in the 65-kDa isoform of glutamic acid decarboxylase. Proc Natl Acad Sci U S A. 1997;94:14060–14065. doi: 10.1073/pnas.94.25.14060. [DOI] [PMC free article] [PubMed] [Google Scholar]
- Kemp JM, Powell TP. The cortico-striate projection in the monkey. Brain. 1970;93:525–546. doi: 10.1093/brain/93.3.525. [DOI] [PubMed] [Google Scholar]
- Khan ZU, Gutierrez A, Martin R, Penafiel A, Rivera A, De La Calle A. Differential regional and cellular distribution of dopamine D2-like receptors: an immunocytochemical study of subtype-specific antibodies in rat and human brain. J Comp Neurol. 1998;402:353–371. doi: 10.1002/(sici)1096-9861(19981221)402:3<353::aid-cne5>3.0.co;2-4. [DOI] [PubMed] [Google Scholar]
- Kim DS, Szczypka MS, Palmiter RD. Dopamine-deficient mice are hypersensitive to dopamine receptor agonists. J Neurosci. 2000;20:4405–4413. doi: 10.1523/JNEUROSCI.20-12-04405.2000. [DOI] [PMC free article] [PubMed] [Google Scholar]
- Le Moine C, Gaspar P. Subpopulations of cortical GABAergic interneurons differ by their expression of D1 and D2 dopamine receptor subtypes. Brain Res Mol Brain Res. 1998;58:231–236. doi: 10.1016/s0169-328x(98)00118-1. [DOI] [PubMed] [Google Scholar]
- Lee KW, Kim Y, Kim AM, Helmin K, Nairn AC, Greengard P. Cocaine-induced dendritic spine formation in D1 and D2 dopamine receptor-containing medium spiny neurons in nucleus accumbens. Proc Natl Acad Sci U S A. 2006;103:3399–3404. doi: 10.1073/pnas.0511244103. [DOI] [PMC free article] [PubMed] [Google Scholar]
- Lemberger T, Parlato R, Dassesse D, Westphal M, Casanova E, Turiault M, Tronche F, Schiffmann SN, Schutz G. Expression of Cre recombinase in dopaminoceptive neurons. BMC Neurosci. 2007;8:4. doi: 10.1186/1471-2202-8-4. [DOI] [PMC free article] [PubMed] [Google Scholar]
- Lobo MK, Karsten SL, Gray M, Geschwind DH, Yang XW. FACS-array profiling of striatal projection neuron subtypes in juvenile and adult mouse brains. Nat Neurosci. 2006;9:443–452. doi: 10.1038/nn1654. [DOI] [PubMed] [Google Scholar]
- Mantamadiotis T, Lemberger T, Bleckmann SC, Kern H, Kretz O, Martin Villalba A, Tronche F, Kellendonk C, Gau D, Kapfhammer J, Otto C, Schmid W, Schutz G. Disruption of CREB function in brain leads to neurodegeneration. Nat Genet. 2002;31:47–54. doi: 10.1038/ng882. [DOI] [PubMed] [Google Scholar]
- Markram H, Toledo-Rodriguez M, Wang Y, Gupta A, Silberberg G, Wu C. Interneurons of the neocortical inhibitory system. Nat Rev Neurosci. 2004;5:793–807. doi: 10.1038/nrn1519. [DOI] [PubMed] [Google Scholar]
- Menalled LB, Chesselet MF. Mouse models of Huntington’s disease. Trends Pharmacol Sci. 2002;23:32–39. doi: 10.1016/s0165-6147(00)01884-8. [DOI] [PubMed] [Google Scholar]
- Miner LL, Drago J, Chamberlain PM, Donovan D, Uhl GR. Retained cocaine conditioned place preference in D1 receptor deficient mice. Neuroreport. 1995;6:2314–2316. doi: 10.1097/00001756-199511270-00011. [DOI] [PubMed] [Google Scholar]
- Mrzljak L, Bergson C, Pappy M, Huff R, Levenson R, Goldman-Rakic PS. Localization of dopamine D4 receptors in GABAergic neurons of the primate brain. Nature. 1996;381:245–248. doi: 10.1038/381245a0. [DOI] [PubMed] [Google Scholar]
- Patel AB, de Graaf RA, Martin DL, Battaglioli G, Behar KL. Evidence that GAD65 mediates increased GABA synthesis during intense neuronal activity in vivo. J Neurochem. 2006;97:385–396. doi: 10.1111/j.1471-4159.2006.03741.x. [DOI] [PubMed] [Google Scholar]
- Peng Z, Houser CR. Temporal patterns of fos expression in the dentate gyrus after spontaneous seizures in a mouse model of temporal lobe epilepsy. J Neurosci. 2005;25:7210–7220. doi: 10.1523/JNEUROSCI.0838-05.2005. [DOI] [PMC free article] [PubMed] [Google Scholar]
- Perez FA, Palmiter RD. Parkin-deficient mice are not a robust model of parkinsonism. Proc Natl Acad Sci U S A. 2005;102:2174–2179. doi: 10.1073/pnas.0409598102. [DOI] [PMC free article] [PubMed] [Google Scholar]
- Sango K, McDonald MP, Crawley JN, Mack ML, Tifft CJ, Skop E, Starr CM, Hoffmann A, Sandhoff K, Suzuki K, Proia RL. Mice lacking both subunits of lysosomal beta-hexosaminidase display gangliosidosis and mucopolysaccharidosis. Nat Genet. 1996;14:348–352. doi: 10.1038/ng1196-348. [DOI] [PubMed] [Google Scholar]
- Sheikh SN, Martin DL. Elevation of brain GABA levels with vigabatrin (gamma-vinylGABA) differentially affects GAD65 and GAD67 expression in various regions of rat brain. J Neurosci Res. 1998;52:736–741. doi: 10.1002/(SICI)1097-4547(19980615)52:6<736::AID-JNR12>3.0.CO;2-X. [DOI] [PubMed] [Google Scholar]
- Shuen JA, Chen M, Gloss B, Calakos N. Drd1a-tdTomato BAC transgenic mice for simultaneous visualization of medium spiny neurons in the direct and indirect pathways of the basal ganglia. J Neurosci. 2008;28:2681–2685. doi: 10.1523/JNEUROSCI.5492-07.2008. [DOI] [PMC free article] [PubMed] [Google Scholar]
- Soriano P. Generalized lacZ expression with the ROSA26 Cre reporter strain. Nat Genet. 1999;21:70–71. doi: 10.1038/5007. [DOI] [PubMed] [Google Scholar]
- Surmeier DJ, Eberwine J, Wilson CJ, Cao Y, Stefani A, Kitai ST. Dopamine receptor subtypes colocalize in rat striatonigral neurons. Proc Natl Acad Sci U S A. 1992;89:10178–10182. doi: 10.1073/pnas.89.21.10178. [DOI] [PMC free article] [PubMed] [Google Scholar]
- Szczypka MS, Rainey MA, Kim DS, Alaynick WA, Marck BT, Matsumoto AM, Palmiter RD. Feeding behavior in dopamine-deficient mice. Proc Natl Acad Sci U S A. 1999;96:12138–12143. doi: 10.1073/pnas.96.21.12138. [DOI] [PMC free article] [PubMed] [Google Scholar]
- Tallquist MD, Soriano P. Epiblast-restricted Cre expression in MORE mice: a tool to distinguish embryonic vs. extra-embryonic gene function. Genesis. 2000;26:113–115. doi: 10.1002/(sici)1526-968x(200002)26:2<113::aid-gene3>3.0.co;2-2. [DOI] [PubMed] [Google Scholar]
- Wang H, Moriwaki A, Wang JB, Uhl GR, Pickel VM. Ultrastructural immunocytochemical localization of mu-opioid receptors in dendritic targets of dopaminergic terminals in the rat caudate-putamen nucleus. Neuroscience. 1997;81:757–771. doi: 10.1016/s0306-4522(97)00253-4. [DOI] [PubMed] [Google Scholar]
- Wilson CJ, Groves PM. Fine structure and synaptic connections of the common spiny neuron of the rat neostriatum: a study employing intracellular inject of horseradish peroxidase. J Comp Neurol. 1980;194:599–615. doi: 10.1002/cne.901940308. [DOI] [PubMed] [Google Scholar]
- Yamamoto A, Lucas JJ, Hen R. Reversal of neuropathology and motor dysfunction in a conditional model of Huntington’s disease. Cell. 2000;101:57–66. doi: 10.1016/S0092-8674(00)80623-6. [DOI] [PubMed] [Google Scholar]
Associated Data
This section collects any data citations, data availability statements, or supplementary materials included in this article.
Supplementary Materials
β-Galactosidase histochemistry of mice generated by crossing D1R-Cre mice with ROSA26 reporter mice. a. Expression in cortex (arrow) and striatum (asterix). b. Expression in cortex (arrow) and hippocampus (arrowhead).
Southern blot of additional genotypes. In addition to the Southern blot analysis shown in Figure 1c, we also included samples from genotypes not used for behavioral analysis. The Drd1aCre/+ : Gad1lox/+ sample has three bands; the upper and lower bands represent Gad1lox allele before and after recombination, respectively, while the middle band is the wild-type allele. We also examined recombination in the cerebellum, where D1R is not expressed in these mice.
Magnified sections of GAD67 immunohistochemistry. a. Magnified images of cortical staining in control and mutant mice. b. Magnified images of striatal staining in control and mutant animals.