

Abstract
Recent computational studies indicate that the molecular noise of a cellular process may be a rich source of information about process dynamics and parameters. However, accessing this source requires stochastic models that are usually difficult to analyze. Therefore, parameter estimation for stochastic systems using distribution measurements, as provided for instance by flow cytometry, currently remains limited to very small and simple systems. Here we propose a new method that makes use of low-order moments of the measured distribution and thereby keeps the essential parts of the provided information, while still staying applicable to systems of realistic size. We demonstrate how cell-to-cell variability can be incorporated into the analysis obviating the need for the ubiquitous assumption that the measurements stem from a homogeneous cell population. We demonstrate the method for a simple example of gene expression using synthetic data generated by stochastic simulation. Subsequently, we use time-lapsed flow cytometry data for the osmo-stress induced transcriptional response in budding yeast to calibrate a stochastic model, which is then used as a basis for predictions. Our results show that measurements of the mean and the variance can be enough to determine the model parameters, even if the measured distributions are not well-characterized by low-order moments only—e.g., if they are bimodal.
Keywords: extrinsic variability, high-osmolarity glycerol pathway, moment dynamics, parameter inference, stochastic kinetic models
Building predictive computational models of intracellular reaction kinetics is still a dauntingly ill-posed task (1), characterized by low-dimensional experimental readouts of the hypothesized high-dimensional process. Single-cell technologies hold promise to partly alleviate this ill-posedness by exploiting the observed variability for the calibration of stochastic kinetic models (2, 3). The same technologies, however, also reveal that isogenic cells in a single population exhibit large cell-to-cell variability (4, 5). The variation can be shown to be a convolution of two sources, namely the intrinsic molecular noise and extrinsic factors that render single cells different even in the absence of molecular noise; in many cases, the latter was reported to dominate the former (4, 5). Extrinsic factors comprise difference in cell size, cell-cycle stage, expression capacity, local growth conditions—to name but a few (6, 7). Thus, although single-cell technology offers a way out of the predicament of ill-posedness, it requires new methods to deal properly with intrinsic and extrinsic variability. The effect of extrinsic variability on the dynamics of stochastic models is studied in refs. 7 and 8, whereas first attempts have been made to address the inverse problem of quantifying the extrinsic (9) and any additional intrinsic (10) components from measurements. Because the latter is based on path sampling, its applicability remains limited to small systems. Naturally, extrinsic variability is bypassed when calibrating a stochastic model to one single cell (3, 11), for instance through live-cell imaging data. However, the extent to which such a single path observation of the hypothesized stochastic process—given the notoriously sparse acquisition times—can sufficiently confine unknown process parameters remains questionable.
Stochastic kinetic models, able to capture the intrinsic noise, were proposed for modeling single-cell data and its variability (2, 12, 13). Models that track probabilities over the integer-valued state-space of molecule-counts suffer from the curse of dimensionality and are computationally prohibitive for all but the simplest systems. Similar limitations apply to approximations thereof that retain the discreteness of the state-space (14, 15). While extracting sample paths of such processes is straightforward (16), acquiring their statistics—often necessary for calibration—is hampered by the slow convergence of empirical estimates for high-dimensional models (17). This is particularly challenging because most calibration or inference methods rely on iterative schemes, making it necessary to recompute statistics. Alternative methods set out to reduce the computational burden by tracking only low-order moments instead of the whole probability distribution. A standard scheme in this class is moment closure, which provides a means to capture the stochasticity of reactions while leveraging the scalability of ordinary differential equation models (18–20).
Here we introduce a moment-based inference scheme for calibrating stochastic models with heterogeneous single-cell measurements. We show how by extending the method of moment closure by conditional moment equations one can properly account for extrinsic factors. The proposed method requires no Monte Carlo simulations over extrinsic factors, making this approach very scalable. Moreover, besides parameter estimates and their confidence bounds, the method allows one to quantitatively characterize the cell-to-cell variability, ultimately dissecting the unspecific conglomerate of extrinsic factors (6). Every additionally accounted moment of the stochastic process can make the calibration less ill-posed; in the same way as the mean of the process contains information, so does its variance. Importantly, we show that this also holds true if the process is poorly captured by the accounted moments, for instance, if we just consider first and second order moments of a multimodal process distribution.
We instantiate this computational framework by addressing a widely discussed—and we believe ubiquitous—process motif, namely the transiently induced gene expression (21, 22). Often signaling pathways are activated for a short time window, in which the activated signaling output—such as a mitogen-activated protein kinase (MAPK)—needs to initiate transcription by translocation and interaction with possibly several intermediates. If many intermediates need to be in place, some cells do not manage to transcribe at all, ultimately giving rise to bimodal protein expression profiles. The particular case study we consider is the high-osmolarity glycerol (HOG) pathway in budding yeast (23), where for intermediate induction levels a bimodality in the induced stress proteins was observed (21). We perform time-lapsed flow cytometry measurements to calibrate a stochastic kinetic model and derive population statistics using the proposed framework. This allows us to perform an in silico homogenization of the cell population and to start quantifying and dissecting the different sources of variability.
Results
Population Dynamics and Extrinsic Variability.
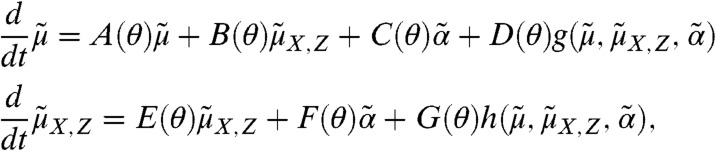
The probability distribution of stochastic models is governed by the chemical master equation (CME) whose moments can be approximated using moment closure techniques (see Materials and Methods). When considering a heterogeneous cell population, the state of each cell follows an individual CME that depends on a certain extrinsic condition. Consequently, a single cell’s dynamics can be described by a vector of approximate conditional moments  up to some order n with z as a realization of some extrinsic variable Z, i.e.,
 |
[1] |
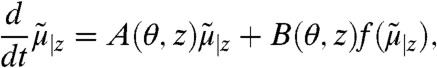
where θ denotes the set of intrinsic parameters that are shared among cells, matrices A(θ,z) and B(θ,z) are determined by the model structure and function f is obtained by moment closure. In this work we assume a constant extrinsic condition or that it varies on time-scales much larger than the duration of the experiment. Accordingly, Z is modeled as a random vector, governed by a multidimensional probability distribution PZ, which is in turn described by a set of parameters α that we refer to as the extrinsic statistics. For instance, one could assume α to be the moments or a parametrization of PZ. This gives rise to a hierarchical Bayesian model (24), as illustrated in Fig. 1A.
Fig. 1.

Hierarchical Bayesian models for the single cell (left) and population moments (right). (A) The approximate moment dynamics of a single cell  depend on the intrinsic parameters as well as the extrinsic condition z. We assume the extrinsic variable Z to be time-invariant and to stem from a distribution described by a set of extrinsic statistics α. (B) Marginalization with respect to the extrinsic condition gives rise to the graphical model of the approximate population dynamics
  , depending on the intrinsic parameters θ and the moments of Z of order up to n, which are denoted
  .
.
Single-cell population data is characterized by a convolution of intrinsic and extrinsic variability. Determining the moments of a heterogeneous population requires computing the expectation of  with respect to PZ (see Fig. 1B). One way to achieve this is to sample values z from PZ, solve system Eq. 1 and then average over the obtained solutions, which naturally comes with a large computational effort. However, our analysis in SI Appendix, section S.1 shows that it is also possible to directly derive a population-based system of moment equations. The resulting approximate population moments can be written as
 |
[2] |
where  contains the cross moments of the species and the extrinsic variable of order up to n, matrices A(θ), B(θ), C(θ), D(θ), E(θ), F(θ), and G(θ) are determined by the model structure and functions g and h are obtained by moment closure. Note that Eq. 2 only depends on lower-order moments of PZ, denoted here by
  . In order to compute approximations of the population moments, Eq. 2 is solved with
  as the extrinsic statistics—and θ as the intrinsic parameters.
Moment-Based Inference.
In practical scenarios, both the intrinsic parameters as well as the extrinsic statistics have to be inferred from the measurements. Although an extension to the general case is straightforward, we assume—for the sake of clarity—that only a single species is measured from a cell population at time points tl,l∈{1,…,L}. We define 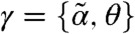 and denote the approximate time evolution of the measured species’ k-th order moment, computed from Eq. 2, as
  , k∈{1,…,n}. With the k-th order experimental moments
  and their corresponding estimated variances
  with k∈{1,…,n}, the posterior distribution over γ is given by
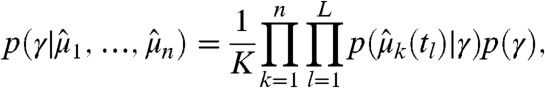 |
[3] |
with p(γ) as the parameter prior and K as a normalizing constant independent of γ. For the large-sample case encountered in flow cytometry we can make use of the central limit theorem and assume that  (for more details see Materials and Methods and SI Appendix, sections S.3.2 and S.4.5). A common strategy to obtain Bayesian point estimates is to maximize Eq. 3 with respect to the parameter γ (24) (see also Materials and Methods).
Whether the moments of the measured distributions carry enough information to jointly determine the intrinsic parameters and the extrinsic statistics, in general has to be answered by performing an identifiability analysis of the closed moment system (1, 25). Using a simple birth-death process, we analytically demonstrate that, in principle, this is possible (see SI Appendix, section S.2).
A Simple Model of Transient Gene Activation.
To test whether the moment-based inference scheme can identify parameters even in the case of multimodal process distributions, we studied the four-species model depicted in Fig. 2A, which can be thought of as a simple model of transiently induced gene expression. Degradation of A serves as a simplistic mechanism to model a temporal window of transcription factor activity. During this temporal window, the gene B manages to switch into a state, where protein C is produced only in a fraction of the cells (parameter configuration and initial conditions are given in SI Appendix, Table S.1 and section S.3.2). To generate protein distributions at 10 different time points, we used Gillespie’s stochastic simulation algorithm (16). We then computed empirical means and variances of these distributions, treated them as experimental measurements, and performed a parameter search to maximize the parameter posterior using a Metropolis–Hastings (M–H) Markov chain Monte Carlo (MCMC) (26) sampler (see Materials and Methods). The inferred moments are depicted in Fig. 2C. Even though in this case, mean and variance do not paint a full picture of the underlying multimodal protein distribution, all parameters—and thus the protein distributions—were estimated accurately up to a small approximation error (see Fig. 2B and SI Appendix, section S.3.2).
Fig. 2.

Moment-based inference using synthetic data. (A) A simple model of transient gene activation: The binding of A to the target gene B aggregates all necessary steps involved in gene activation such as the binding of additional transcription factors, polymerase binding, or chromatin remodeling. Also protein synthesis is reduced to the simplest possible model—i.e., a first order production, abstracting messenger RNA (mRNA) transcription and degradation, translation, and protein folding. (B) The protein distributions predicted by the calibrated model (red) compared to the distributions generated from the reference model (black) at four representative time points (see SI Appendix, section S.3.2 for further time points). Estimates of the distributions were obtained by stochastic simulation (20,000 runs). (C) The time evolutions of the approximate protein mean and variance obtained from moment closure (MC) differ only little from approximations computed by stochastic simulation (SSA). Therefore, the model parameters can be inferred up to negligibly small deviations.
Hog1-Induced Gene Expression in Yeast.
The moment-based inference scheme allowed us to study gene expression, activated by the HOG signaling pathway in budding yeast (23). Upon hyper-osmotic shock yeast cells induce the MAPK Hog1 signaling cascade. The role of this kinase is twofold. In the cytoplasm, Hog1 phosphorylates its substrate to increase the internal concentration of glycerol in the cell. In parallel, a large fraction of the active Hog1 translocates to the nucleus where it triggers the activation of a transcriptional program leading to the upregulation of roughly 300 genes (27). Once the internal glycerol concentration allows to balance the external osmotic pressure, the HOG pathway is deactivated, leading to loss of active MAPK and a rapid termination of the transcriptional process.
To quantify the amount of transcription induced by this pathway a fluorescent expression reporter was generated using the promoter pSTL1 (promoter of the sugar transporter-like protein 1), a well-characterized Hog1 expression target driving the expression of a fluorescent protein construct (quadrupleVenus–qV). It was recently shown in ref. 21 that the transient activation of the MAPK Hog1 in conjunction with a slow step in the transcription activation process of the promoter results in a bimodality in the expression profiles of this fluorescent expression reporter.
Nuclear enrichment of Hog1 was measured by microscopy and the pSTL1-qV reporter abundance was quantified by flow cytometry at nine different time points for NaCl concentrations of 0 M, 0.1 M, 0.12 M, and 0.2 M.
The Model.
Components involved in activation and translocation of Hog1 are present in high abundance (e.g., around 6800 Hog1 molecules per cell) (28). Consequently, intrinsic fluctuations of active Hog1 are relatively small. Experimental results in ref. 29 and our own data support this and also that Hog1 signaling is robust against cell-to-cell variations. Motivated by this, we assume Hog1 signaling to be deterministic rather than stochastic and that the mean dynamics reflect well the signaling behavior (30, 31). Continuous-time functions of nuclear Hog1 were obtained from the experimental data by linear regression with radial basis functions (24) across different NaCl concentrations (see SI Appendix, section S.4.2).
Several transcription factors such as Sko1 or Hot1 are under control of active Hog1 once it translocates to the nucleus as shown in ref. 32. This and the experimentally observed switch-like induction of fluorescent reporter expression suggest a high cooperativity in the pSTL1 promoter dynamics. In a purely stochastic mass-action model, one way to model cooperativity is to require multiple Hog1 copies to bind to the promoter before messenger RNAs (mRNA) can be transcribed. However, the previous high copy-number considerations allow us to simplify this step into transforming the fitted Hog1 abundance curves using a Hill-function with tunable parameters (see SI Appendix, section S.4.2). The output of this function is then treated as a time-varying kinetic parameter modulating the gene activation rate. Efficient transcription of mRNA requires interaction of the active gene with chromatin remodeling complexes (generic remodeler denoted as CR) (21). Translation is modeled as a one-step linear production event, depending on the number of ribosomes. We assume that extrinsic variability enters the system in the chromatin remodeling (variability in the number of CR) (33) and the translation efficiency (variability in the number of ribosomes) (5). A graphical representation of the model is given in Fig. 3A.
Fig. 3.

MAPK Hog1 induced pSTL1-qV expression. (A) Osmotic pressure is sensed at the membrane, and results in the activation of the MAPK signaling cascade. Once active, double-phosphorylated MAPK Hog1 translocates to the nucleus, where it can bind via transcription factors to the pSTL1 promoter. Remodeling of the chromatin structure then allows for efficient transcription of mRNA, which is exported from the nucleus to yield expression of the fluorescent reporter pSTL1-qV. Blue-shaded entities denote species subject to extrinsic variability. (B) Comparison of pSTL1-qV mean and variance obtained after calibration (Cal) and validation (Val) of the model using moment closure (MC) and 20,000 stochastic simulation runs (SSA) with the experimental estimates obtained from the time-lapsed (TL) flow cytometry (FC) data (approximately 20,000 cells).
pSTL1-qV Mean and Variance Predict Transient Bimodality.
The parameters of the model from Fig. 3A were inferred from the time courses of the experimental means and variances (see Fig. 3B) using NaCl concentrations 0 M, 0.12 M, and 0.2 M. We then validated the model by comparing the distributions predicted by the model for 0.1 M NaCl with the experimental results. The pSTL1-qV expression profiles for each measurement time point and NaCl concentration were computed from the calibrated model using stochastic simulation. A comparison between the experimental and the predicted distributions is shown in Fig. 4A. Even though only means and variances were used in the inference, the bimodal distributions are accurately predicted by the model (see also SI Appendix, section S.4.5).
Fig. 4.

Population mean and variance predict bimodal pSTL1-qV response. (A) Model calibration (Cal) and validation (Val). The parameters were inferred using time-lapsed (TL) flow cytometry (FC) data of the pSTL1-qV reporter at three NaCl concentrations (i.e., 0 M, 0.12 M, and 0.2 M) and used to predict the expression profiles at a NaCl concentration of 0.1 M. (B) Model validation using flow cytometry snapshot data (SS), recorded 45 min after osmotic shock for 0 M, 0.1 M, 0.12 M, 0.135 M, 0.15 M, 0.175 M, 0.2 M, and 0.3 M of NaCl. Left: Coefficient of variation (CV) of pSTL1-qV intensity as a function of NaCl. Right: Dose-response comparison. All curves indicate a Hill-type relation. The calibrated model was homogenized (Hom), giving rise to the average cell’s CV and dose-response curves. Additionally, we studied the suppression of the chromatin remodeling in silico by reducing the amount of CR, such that the percentage of responding cells saturated around 60% (CRΔ) and compared the model predictions to the results reported in ref. 21, where the authors performed a knock-down of the transcription adapter 2 (Ada2) to demonstrate the impact of chromatin remodeling in pSTL1-qV induction (Ada2Δ).
We further validated the model using an additional snapshot dataset from ref. 21, where the pSTL1-qV reporter abundance was measured for several other NaCl concentrations between 0 M and 0.3 M, 45 min upon osmotic shock. From the model predictions and the measured distributions, we computed the coefficient of variation (CV) and a dose-response as functions of the NaCl concentration (Fig. 4B). The area around 0.1 M NaCl, where the CV is large and the dose-response curve is rising, indicates the NaCl concentration interval where the expression is in a bimodal regime. Note that also at 0.3 M NaCl, a concentration much larger than the concentrations that were used in the inference, the CV is predicted accurately.
To study the stochastic pSTL1-qV induction, we simulated the model to estimate the average number of cells that (i) never activate the pSTL1 promoter, (ii) activate the promoter at least once, and (iii) induce transcription. Our model predicts that for all NaCl concentrations except 0 M all cells manage to activate the promoter and, therefore, that the bimodality has to be caused by the subsequent—and comparably slow—chromatin remodeling step (see SI Appendix, section S.4.7). Further, we performed an in silico knock-down of CR by rescaling each cell’s amount of CR by a hand-tuned factor, such that the percentage of responding cells saturated around 60% as measured in the experiment (see Fig. 4B). We found that the transition between the non- and all-responding domain is shifted to higher NaCl values and that the slope of the transition edge is decreased.
In Silico Homogenization of the Cell Population.
After calibrating the model, we switched off extrinsic variability by setting each cell’s extrinsic condition to the inferred mean value. We then recomputed estimates of the pSTL1-qV distributions using stochastic simulation. The resulting average cell can be interpreted as a homogenized version of the measured population. Again CV and dose response were computed and plotted in Fig. 4B. Interestingly, we find that extrinsic variability does not affect the dose-response behavior in pSTL1-qV induction. In contrast, the homogenized population shows significant differences in the CV. In particular, for larger stress levels the CV is relatively small compared to the heterogeneous counterpart, indicating less variability in pSTL1-qV reporter expression. For intermediate stress levels the homogenized population still shows a bimodal response.
Cell-Gating Eliminates Only a Fraction of Extrinsic Variability.
To study the extent to which extrinsic variability can be reduced by cell-gating, we reestimated the extrinsic statistics using the time-lapsed flow cytometry dataset for gates of different size, applied on the forward scatter channel (FSC, often used as a proxy for cell volume). We found that the variability in the translation efficiency is significantly reduced for small gating diameters. In contrast, no significant trend was found in the estimated variability in CR (see Fig. 5).
Fig. 5.

Cell-gating eliminates only a fraction of extrinsic variability. To study the influence of cell-gating on cell-to-cell variability we fixed all parameters but the extrinsic statistics  to their previously inferred values. The extrinsic statistics were reestimated from the time-lapsed flow cytometry data with increasing FSC gating diameters using MCMC sampling with 100 randomly drawn initial conditions. Statistics were computed and visualized over the 10 runs that achieved the highest posterior values using boxplots with MATLAB’s (2009b, Mathworks) default settings. The CV of the translation efficiency increases with the logarithmic gating diameter (right), whereas the CV of the chromatin remodeling remains more or less constant (left).
Discussion
Studying biological systems with mathematical models requires knowledge of the kinetic rate parameters of the system reactions. These parameters are often hard to measure experimentally and have to be inferred from the measurements that are available. In the simple example of Fig. 2A, measurements of the mean dynamics alone did not provide enough information to uniquely identify the parameters (see SI Appendix, section S.3.3). This demonstrates that averaged population data may contain too little information to identify the reaction rates. Contrary to that, additionally measuring the variance in the example of Fig. 2A allows one to uniquely identify all the parameters, even though the measured distributions are bimodal. This implies that the question of whether the measured distributions are well-characterized by low-order moments only is not necessarily of importance. In ref. 2 the authors presented a method that makes use of the information provided by the whole distributions. However, for larger systems, approximation of the probability distribution becomes computationally cumbersome. Focusing the analysis on lower-order moments, as proposed in this paper, means discarding a part of the information but makes the parameter identification feasible for larger systems.
The moment-based inference scheme allowed us to estimate the parameters of a stochastic model of the osmo-stress induced transcriptional activation in budding yeast using distribution measurements of a heterogeneous cell population and thereby enabled us to explain and predict experimental data and to provide computational support for existing biological hypotheses. The inferred model characteristics and parameters agree well with state-of-the-art literature. For instance the predictions, obtained for the in silico knock-down of CR, agree well with results in ref. 21, where the authors performed knock-down experiments for different components of the SAGA complex, which is recruited during chromatin remodeling (see Fig. 4B). The pSTL1-qV half-life was estimated to be around 90 min; this value agrees well with ref. 34, where the authors report a high stability of similar fluorescent reporters. The Hill coefficient of the pSTL1 promoter dynamics was estimated to be nH ≈ 6, indicating high cooperativity in the binding of active Hog1 to the target gene. This seems to be crucial for the cell to achieve the strong switch-like behavior observed in the experimental data and agrees well with previously reported results, where Hog1 dependent transcription factors were shown to have multiple binding sites (35).
The inferred model parameters predict large cell-to-cell variations in the chromatin remodeling as well as in the translation efficiency (CVs around 0.3–0.4). This is in agreement with the experimental results from ref. 33, where the authors found that several chromatin remodeling factors show large variations—e.g., a CV around 0.3 for the transcription adapter 2 (Ada2).
According to our model, variability in the chromatin remodeling is widely independent of the FSC gating radius, indicating that extrinsic noise is suppressed only in the translation efficiency by applying gates on morphological features. In conjunction with the observation that an in silico homogenization of the cell population leads to different CVs of the pSTL1-qV distributions (Fig. 4B), this suggests that studies that solely rely on cell gating to eliminate cell-to-cell variability may lead to biased results. Explicitly including extrinsic variability may resolve a systematic mismatch and, additionally, allows to quantify effects of variability on the system. For instance the in silico homogenization of the cell population (Fig. 4B) indicates that the dose response is widely insensitive against cell-to-cell variability. This provides computational support for the hypothesis in ref. 21 that the partitioning between reporter inducing and noninducing cells is primarily caused by intrinsic stochasticity.
Materials and Methods
Flow Cytometry Measurements.
The yeast cells bearing the integrated pSTL1-quadrupleVenus (21) were cultivated in synthetic (SD) medium (using a yeast nitrogen base w/o folic acid, w/o riboflavin). An overnight saturated culture was diluted and grown in log phase for 24 h (OD600 nm kept below 0.2 by several dilutions). Hog1 driven gene expression was induced by adding 5 mL (3x) salt solution (SD medium + NaCl) to 10 mL culture containing flasks. At each time point a 0.5 mL aliquot was taken and protein translation was stopped by adding cycloheximide (final CHX concentration: 100 μg/mL). After maturation of the fluorescent reporters (about 2 h), 350 μL cells were added to 400 μL PBS, briefly sonicated and filtered. Finally the fluorescence was measured using a BD LSR II (excitation: 488 nm, emission: 525/50 nm). If not explicitly stated, we applied cell-gates of log-diameter 0.5 with respect to the forward—and log—diameter 2.5 to the side scatter channel, respectively. Each flow cytometry distribution was obtained from around 55,000 cells, leading to an effective number of cells around 20,000 after applying the gate.
Moment Closure.
Equations that describe the time evolution of all the moments of the distribution can be derived from the CME (36). Extracting the equations for the moments up to some order n leads to a finite open system that possibly depends on higher order moments. Approximating the higher order moments by some nonlinear function f of the lower-order moments (see ref. 19 and SI Appendix, sections S.3.1 and S.4.1) leads to a closed system of the form
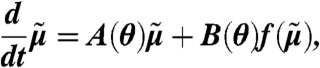 |
where  is a vector containing the moments of order up to n and A(θ) and B(θ) are determined by the model structure.
Moment Uncertainties and Data Modeling.
Asymptotically unbiased estimates for central moments of order k at time tl were computed from M samples as
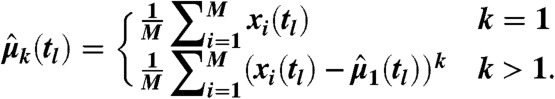 |
The central limit theorem implies that for large M (i.e., around 20,000 within our experiments) the moment estimates are approximately normally distributed—i.e., 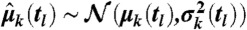 —with μk(tl) as the true k-th moment. We further validated this assumption for both case studies by comparing bootstrapped distributions of the empirical moments to normal distributions using probability-probability (P-P) and quantile-quantile (Q-Q) plots. Additionally, we used a Kolmogorov–Smirnov–Lilliefors test to assess normality (see SI Appendix, sections S.3.2 and S.4.5). For k = 1 and k = 2, the estimators variance can be estimated as
 |
respectively.
Modeling Fluorescence Intensities.
We assumed that the measured fluorescence intensity for a given cell is proportional to the number of fluorescent proteins (33)—i.e.,  with scaling parameter ϵ. Due to the nonidentifiability in the translation step (see SI Appendix, section S.4.5), only the product of the translation rate and ϵ can be determined. Furthermore, we assumed that the reporter abundance IR(tl) is corrupted by autofluorescence and measurement artifacts, modeled as an additive random variable IAF(tl), independent of the reporter abundance—i.e., ITot(tl) = IR(tl) + IAF(tl). Mean and variance of IAF(tl) were estimated from the flow cytometry data for 0 M NaCl, collected over the measurement time points. As this allows very accurate estimates (M in the order of hundreds of thousands), the uncertainty of those estimates can be well neglected. The experimental means and variances of pSTL1-qV abundance at a given measurement time point were calculated as
  for k∈{1,2}. Note that moment-based inference and analysis of the model can be carried out without any assumptions on the autofluorescence distribution. In order to compare protein distributions from the model with experimentally obtained distributions, we sampled autofluorescence values from the measured flow cytometry distribution for 0 M NaCl.
Model Calibration.
For all experiments, we assumed flat prior distributions over parameters γj∈γ (with zero probability for negative values). In the M-H MCMC scheme, for each of the J parameters in γ, we used independent log-normal proposal distributions such that  with
with  . A detailed configuration can be found in SI Appendix, sections S.3.2 and S.4.5. Proposed parameter samples are accepted with probability
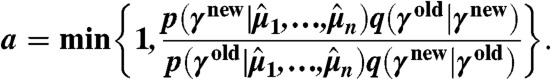 |
From the resulting Markov chain we extracted the parameter configuration which maximized the posterior density. The distance between predicted and measured protein distributions was quantified using the Kolmogorov metric (see SI Appendix, section S.4.5).
Supplementary Material
Acknowledgments.
We are grateful to J. Paulsson, A. Hilfinger, and J. Hasenauer for interesting discussions. C.Z. and H.K. acknowledge the support from the Swiss National Science Foundation, Grant PP00P2 128503. The work of J.R. and J.L. was supported in part by SystemsX.ch under the project YeastX and by the European Commission under the project MoVeS. S.P. and M.P. acknowledge the support from the European project UNICELLSYS, the European Research Council, the SystemsX.ch organization (LiverX), the Competence Centre for Systems Physiology and Metabolic Disease, the Swiss National Science Foundation, and the ETH Zurich.
Footnotes
The authors declare no conflict of interest.
This article is a PNAS Direct Submission.
This article contains supporting information online at www.pnas.org/lookup/suppl/doi:10.1073/pnas.1200161109/-/DCSupplemental.
References
- 1.Hengl S, Kreutz C, Timmer J, Maiwald T. Data-based identifiability analysis of non-linear dynamical models. Bioinformatics. 2007;23:2612–2618. doi: 10.1093/bioinformatics/btm382. [DOI] [PubMed] [Google Scholar]
- 2.Munsky B, Trinh B, Khammash M. Listening to the noise: Random fluctuations reveal gene network parameters. Mol Syst Biol. 2009;5:318. doi: 10.1038/msb.2009.75. [DOI] [PMC free article] [PubMed] [Google Scholar]
- 3.Boys RJ, Wilkinson DJ, Kirkwood TBL. Bayesian inference for a discretely observed stochastic kinetic model. Stat Comput. 2007;18:125–135. [Google Scholar]
- 4.Elowitz MB, Levine AJ, Siggia ED, Swain PS. Stochastic gene expression in a single cell. Science. 2002;297:1183–1186. doi: 10.1126/science.1070919. [DOI] [PubMed] [Google Scholar]
- 5.Colman-Lerner A, et al. Regulated cell-to-cell variation in a cell-fate decision system. Nature. 2005;437:699–706. doi: 10.1038/nature03998. [DOI] [PubMed] [Google Scholar]
- 6.Snijder B, Pelkmans L. Origins of regulated cell-to-cell variability. Nat Rev Mol Cell Biol. 2011;12:119–125. doi: 10.1038/nrm3044. [DOI] [PubMed] [Google Scholar]
- 7.Shahrezaei V, Ollivier JF, Swain PS. Colored extrinsic fluctuations and stochastic gene expression. Mol Syst Biol. 2008;4:196. doi: 10.1038/msb.2008.31. [DOI] [PMC free article] [PubMed] [Google Scholar]
- 8.Hilfinger A, Paulsson J. Separating intrinsic from extrinsic fluctuations in dynamic biological systems. Proc Natl Acad Sci USA. 2011;108:12167–12172. doi: 10.1073/pnas.1018832108. [DOI] [PMC free article] [PubMed] [Google Scholar]
- 9.Hasenauer J, et al. Identification of models of heterogeneous cell populations from population snapshot data. BMC Bioinformatics. 2011;12:125. doi: 10.1186/1471-2105-12-125. [DOI] [PMC free article] [PubMed] [Google Scholar]
- 10.Koeppl H, Zechner C, Ganguly A, Pelet S, Peter M. Accounting for extrinsic variability in the estimation of stochastic rate constants. Int J Robust Nonlin. 2012 10.1002/rnc.2804. [Google Scholar]
- 11.Golightly A, Wilkinson DJ. Bayesian inference for stochastic kinetic models using a diffusion approximation. Biometrics. 2005;61:781–788. doi: 10.1111/j.1541-0420.2005.00345.x. [DOI] [PubMed] [Google Scholar]
- 12.Mettetal JT, Muzzey D, Pedraza JM, Ozbudak EM, van Oudenaarden A. Predicting stochastic gene expression dynamics in single cells. Proc Natl Acad Sci USA. 2006;103:7304–7309. doi: 10.1073/pnas.0509874103. [DOI] [PMC free article] [PubMed] [Google Scholar]
- 13.Guido NJ, et al. A bottom-up approach to gene regulation. Nature. 2006;439:856–860. doi: 10.1038/nature04473. [DOI] [PubMed] [Google Scholar]
- 14.Munsky B, Khammash M. The finite state projection algorithm for the solution of the chemical master equation. J Chem Phys. 2006;124:044104. doi: 10.1063/1.2145882. [DOI] [PubMed] [Google Scholar]
- 15.Wolf V, Goel R, Mateescu M, Henzinger TA. Solving the chemical master equation using sliding windows. BMC Syst Biol. 2010;4:42. doi: 10.1186/1752-0509-4-42. [DOI] [PMC free article] [PubMed] [Google Scholar]
- 16.Gillespie D. A general method for numerically simulating the stochastic time evolution of coupled chemical reactions. J Comput Phys. 1976;22:403–434. [Google Scholar]
- 17.Fishman GS. Berlin: Springer; 1996. Monte Carlo: Concepts, algorithms, and applications. [Google Scholar]
- 18.Whittle P. On the use of the normal approximation in the treatment of stochastic processes. J Roy Stat Soc B Met. 1957;19:268–281. [Google Scholar]
- 19.Hespanha J. Moment closure for biochemical networks; Proceedings of the 3rd International Symposium on Communications, Control and Signal Processing (IEEE); 2008. pp. 142–147. [Google Scholar]
- 20.Ruess J, Milias-Argeitis A, Summers S, Lygeros J. Moment estimation for chemically reacting systems by extended Kalman filtering. J Chem Phys. 2011;135:165102. doi: 10.1063/1.3654135. [DOI] [PubMed] [Google Scholar]
- 21.Pelet S, et al. Transient activation of the HOG MAPK pathway regulates bimodal gene expression. Science. 2011;332:732–735. doi: 10.1126/science.1198851. [DOI] [PubMed] [Google Scholar]
- 22.Shalem O. Transient transcriptional responses to stress are generated by opposing effects of mRNA production and degradation. Mol Syst Biol. 2008;4:4. doi: 10.1038/msb.2008.59. [DOI] [PMC free article] [PubMed] [Google Scholar]
- 23.Hohmann S. Osmotic stress signaling and osmoadaptation in yeasts. Microbiol Mol Biol Rev. 2002;66:300–372. doi: 10.1128/MMBR.66.2.300-372.2002. [DOI] [PMC free article] [PubMed] [Google Scholar]
- 24.Bishop CM. Pattern Recognition and Machine Learning. New York. Springer; 2007
- 25.Bellman R, Astrom K. On structural identifiability. Math Biosci. 1970;7:329–339. [Google Scholar]
- 26.Gilks WR, Richardson S, Spiegelhalter DJ. New York: Chapman & Hall; 1996. Markov chain Monte Carlo in practice. [Google Scholar]
- 27.Gasch AP, et al. Genomic expression programs in the response of yeast cells to environmental changes. Mol Biol Cell. 2000;11:4241–4257. doi: 10.1091/mbc.11.12.4241. [DOI] [PMC free article] [PubMed] [Google Scholar]
- 28.Ghaemmaghami S, et al. Global analysis of protein expression in yeast. Nature. 2003;425:737–741. doi: 10.1038/nature02046. [DOI] [PubMed] [Google Scholar]
- 29.Muzzey D, Gómez-Uribe Ca, Mettetal JT, van Oudenaarden A. A systems-level analysis of perfect adaptation in yeast osmoregulation. Cell. 2009;138:160–171. doi: 10.1016/j.cell.2009.04.047. [DOI] [PMC free article] [PubMed] [Google Scholar]
- 30.Zi Z, Liebermeister W, Klipp E. A quantitative study of the Hog1 MAPK response to fluctuating osmotic stress in Saccharomyces cerevisiae. PloS One. 2010;5:e9522. doi: 10.1371/journal.pone.0009522. [DOI] [PMC free article] [PubMed] [Google Scholar]
- 31.Macia J, et al. Dynamic signaling in the Hog1 MAPK pathway relies on high basal signal transduction. Sci Signal. 2009;2:ra13. doi: 10.1126/scisignal.2000056. [DOI] [PubMed] [Google Scholar]
- 32.Capaldi AP, et al. Structure and function of a transcriptional network activated by the MAPK Hog1. Nat Genet. 2008;40:1300–1306. doi: 10.1038/ng.235. [DOI] [PMC free article] [PubMed] [Google Scholar]
- 33.Newman JRS, et al. Single-cell proteomic analysis of S. cerevisiae reveals the architecture of biological noise. Nature. 2006;441:840–846. doi: 10.1038/nature04785. [DOI] [PubMed] [Google Scholar]
- 34.Mateus C, Avery SV. Destabilized green fluorescent protein for monitoring dynamic changes in yeast gene expression with flow cytometry. Yeast. 2000;16:1313–1323. doi: 10.1002/1097-0061(200010)16:14<1313::AID-YEA626>3.0.CO;2-O. [DOI] [PubMed] [Google Scholar]
- 35.Proft M, Gibbons F, Copeland M, Roth F, Struhl K. Genomewide identification of Sko1 target promoters reveals a regulatory network that operates in response to osmotic stress in Saccharomyces cerevisiae. Eukaryot Cell. 2005;4:1343–1352. doi: 10.1128/EC.4.8.1343-1352.2005. [DOI] [PMC free article] [PubMed] [Google Scholar]
- 36.Hespanha J. Modeling and analysis of stochastic hybrid systems. IEE Proceedings Control Theory And Applications. 2006;153:520–535. [Google Scholar]
Associated Data
This section collects any data citations, data availability statements, or supplementary materials included in this article.