Abstract
Dielectrophoresis (DEP) has been shown to have significant potential for the characterization of cells and could become an efficient tool for rapid identification and assessment of microorganisms. The present work is focused on the trapping, characterization, and separation of two species of Cryptosporidium (C. parvum and C. muris) and Giardia lambia (G. lambia) using a microfluidic experimental setup. Cryptosporidium oocysts, which are 2-4 μm in size and nearly spherical in shape, are used for the preliminary stage of prototype development and testing. G. lambia cysts are 8–12 μm in size. In order to facilitate effective trapping, simulations were performed to study the effects of buffer conductivity and applied voltage on the flow and cell transport inside the DEP chip. Microscopic experiments were performed using the fabricated device and the real part of Clausius—Mossotti factor of the cells was estimated from critical voltages for particle trapping at the electrodes under steady fluid flow. The dielectric properties of the cell compartments (cytoplasm and membrane) were calculated based on a single shell model of the cells. The separation of C. muris and G. lambia is achieved successfully at a frequency of 10 MHz and a voltage of 3 Vpp (peak to peak voltage).
INTRODUCTION
Dielectrophoresis (DEP) is an established technique for sorting, trapping, and characterizing cells and biomolecules.1, 2, 3 DEP force acts on polarizable particles suspended in fluids and provides us with several key parameters, such as voltage, phase, and frequency of the AC current used, to control the manipulation process. It is possible to trap, characterize, and separate particles with different polarizabilities by tuning the abovementioned parameters. More recently, considerable attention has been paid to the potential of DEP as an analytical technique capable of providing information about the electrical parameters of cell compartments.2, 4, 5, 6, 7 These parameters, especially permittivity and conductivity of cytoplasm and membrane, are linked to important physiological characteristics of the cell and can be deduced from real part of the characteristic Clausius-Mossotti factor, . For that, two requisites have to be met: (1) the experimental measurements of cell motion or cell trapping voltage have to be related to values, and (2) an appropriate dielectric model of the cell that expresses in terms of electrical and geometric parameters of the cell has to be established.
Dielectrophoresis has been shown to have significant potential for the characterization of cells and could become an efficient tool for rapid identification and assessment of microorganisms. Milner et al.8 proposed a technique based on impedance measurement combined with DEP for analysis of bacteria. Suehiro et al.9 subsequently applied a similar technique for selective detection of viable Escherichia coli bacteria, collecting them by means of interdigitated electrodes and assuming the measured conductance between electrodes to be proportional to the number of collected cells. Meanwhile, a DEP technique was used by Johari et al.7 for obtaining and interpreting collection spectra of antibiotic-sensitive and antibiotic-resistant strains of Staphylococcus epidermidis. A simple experimental setup using sharp needle electrodes immersed in a static suspension was employed to interpret the number of collected cells as proportional to dielectric polarizability values. Later, Sanchis et al.10 improved on the above two methods by (1) assuming a rod shape model for E. coli bacteria and (2) using a microelectrode chamber containing interdigitated electrodes through which the cell suspension circulates and a direct cell counting method by an image analysis system. Dielectric parameters of the cell compartments of E. coli and Staphylococcusaureus bacteria were determined using the above approach.
Cryptosporidium parvum is a protozoan parasite which produces oocysts as the infective stage in its life cycle. Ingestion of very low numbers of oocysts is considered sufficient to cause diarrheal illness in humans11 which can be fatal in the immunosuppressed.12Giardia lambia is also a protozoan parasite which colonizes in the small intestine, producing Giardiasis (diarrheal infection of the small intestine). The Cryptosporidium oocysts are nearly spherical in shape13 while the Giardia cells are spheroidal. The present work is focused on the trapping and characterization of Cryptosporidium and Giardia cells using a microfluidic experimental setup. In this study, the experimental setup is based on the integration of microfluidics within a microfabricated electrode set, with potentially easy integration into lab-on-a-chip systems for clinical or research purposes. A two compartment model of the pathogen cells (consisting of inner cytoplasm and plasma membrane) is presented in order to relate the real part of Clausius—Mossotti (CM) factor to the dielectric and geometric parameters of the cell compartments. The separation of Cryptosporidium muris and Giardia lambia cells is achieved successfully corresponding to a frequency of 10 MHz, at which the two cells show opposing dielectric behavior.
THEORY
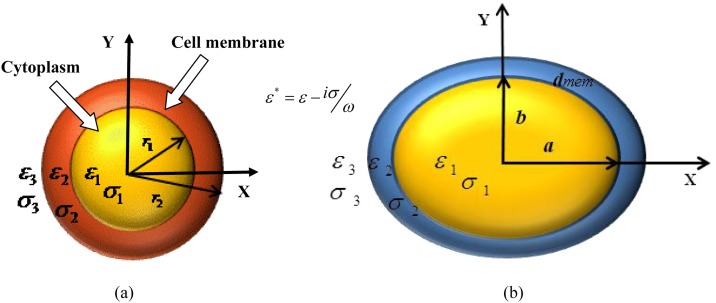
Figure 1 shows the schematic of the single shell model of the Cryptosporidium and Giardia cells. Cryptosporidium cells are represented by a single shelled sphere while the Giardia cells are represented by a spheroidal shell. The inner layer represents the cytoplasm while the outer layer represents the plasma membrane. The component permittivity and conductivity of cytoplasm and membrane are represented by and , respectively. The dielectric parameters of the external medium are represented by . The dielectrophoretic force on such a composite cell is given as14
| (1) |
where represents the dielectric permittivitty of the medium, ap represents the cell radius, and E is the applied electric field. The characteristic CM factor for the case of spherical shells cell can be expressed as
| (2) |
In the above equation, r1 and r2 represent the inner and outer radius of the spherical shell and the complex permittivity,
| (3) |
In the above expression, , is the angular frequency of the applied electric field.
Figure 1.
Schematic model of the Cryptosporidium (sphere) and Giardia (spheroid) cells.
As Eq. 1 is only applicable for spherical cells, it is essential to modify the CM factor taking into account of the spheroidal shape of the cells.15 This consideration defines the three components of this factor for the three possible axes of polarization that in the case of homogeneous ellipsoids are expressed as
| (4) |
where and represent the homogeneous cell permittivity and the medium permittivity, respectively. In Eq. 4, Ai is a component of the depolarization factor along any one of three axes of the ellipsoid (i = x, y, z). Ai is expressed as16
| (5) |
where a, b, and c represent the three minor axes of the ellipsoid and qi = a, b, c for i = x, y, z.
In the special case of a prolate spheroid, a > b = c, and the depolarization component at the direction of its major axis (symmetric axis) is given by
| (6) |
where is the eccentricity of the spheroid. In this expression, a and b refer to the semi-major and semi-minor axis lengths of the spheroidal cell (depicted in Figure 1b). However, the biological cell is not homogeneous and is represented as a shell having a cytoplasm and membrane with different dielectric properties (as depicted in Figure 1b). The DEP behavior of the transport of such a spheroidal cell along X-axis can be expressed using the directional CM factor,
| (7) |
where the cell polarization factor, Px is expressed as
| (8) |
In Eq. 7, represents the cell CM factor for X-axis of polarization (the direction of cell transport in the present study).
In the above equations, and represents the cell eccentricity factors,
In the above expressions, and represent the x-component of depolarization for the inner cytoplasm layer and the layer including the cytoplasm and cell membrane, respectively.
is expressed as
| (9) |
dmem represents the thickness of the cell membrane. As and due to rotational symmetry of the spheroidal cell, the CM factor in the Y and Z directions can be expressed according to Eqs. 7, 8 by using expressions , .
The averaged CM factor of the cell is then expressed as
| (10) |
Using Eq. 3 in Eq. 2 and expanding, the real part of the effective CM factor of a spherical cell can be written as
| (11) |
where the terms p, q, r, s, and t in Eq. 11 are expressed as
| (12) |
In the above expressions, .
Substituting p, q, r, s, and t into Eq. 11 will result in a high order polynomial expression of in terms of , , and . Through a similar procedure, though tedious, the CM factor of a spheroidal cell can be expressed in terms of the cell and medium dielectric parameters. After obtaining the distributions of the electrical field and flow field separately, the region where a cell can be trapped can be found.
The hydrodynamic force on a spherical cell near to a plane boundary is expressed as17
| (13) |
where U is the fluid velocity and μ is the dynamic viscosity of the fluid medium. The factor represents the hydrodynamic correction function to account for the near wall effects due to the presence of the plane boundary. Expression for for the case of motion of a sphere near a plane boundary is given in Ref. 17. In order for the cell to be trapped, the maximum DEP force on the cell should be greater than or equal to the hydrodynamic drag on the cell.
The correction factor for a prolate spheroidal shell is expressed as
| (14) |
where is the spheroid is shape factor and is the boundary correction factor,17
| (15) |
| (16) |
where l is the cell centre to channel wall separation distance and
| (17) |
In the case of a spheroid, .
Equating the DEP and hydrodynamic forces on a spherical cell results in an expression for the real part of CM factor
| (18) |
Similarly, the real part of CM factor for a spheroidal cell can be expressed as
| (19) |
where represents the component of the applied field in the x direction. In the case of spheroidal cell, the x direction is along the major axis of the cell. Therefore, the real part of CM factor can be calculated once the electric field distribution is calculated corresponding to the experimentally determined critical voltages of cell trapping and release at different frequencies.
The flow field velocity, U is determined by the governing Navier-Stokes equation. In the present case of flow over an electrode array, the flow field will depend on the electrothermal force arising from Joule heating at the electrodes. The corresponding governing equations for the electrical, thermal, and flow fields are given as follows:
| (20) |
| (21) |
where Φ represents the electrical potential and T is the temperature. The electrothermal force can be expressed as18
| (22) |
where is the fluid’s charge-relaxation time. The coupled field equations represented by Eqs. 20, 21 are solved using comsol multiphysics.
MATERIALS AND FABRICATION
The interdigitated electrodes (of width 30 ) of the microfluidic device are fabricated from indium tin oxide (ITO) coated glass slides. These glass slides provide high transparency and good electrical conductivity, enabling visualization of the flow of cells in the microchannel. The ITO glass slides were first cleaned by rinsing with isopropanol, acetone, and deionized water, blow-dried with compressed air, and then dehydrated on a hot plate at 100 °C for 10 min. A positive-tone photoresist AZ2001 is spun-coated at 2500 rpm for 20 s with an acceleration of 300 rpm/s, and the slide was baked at 95 °C for 90 s prior to standard photolithography. The slide was then exposed to ultraviolet light at about 80 mJ/cm2 (Karl Suss MA4 Mask Aligner, Waterbury, VT) through a film mask (IGI, Singapore). Subsequently, the slide was immersed into a solution of AZ400K developer and deionized water (1:4) for 20 s. The slide is then etched in a solution of ferric chloride (35 g), hydrochloric acid (250 ml), and deionized water (250 ml). The etching time in our experiment is about 10 min. After the etching process, the slide was rinsed with acetone and water to remove the photoresist and finally blow-dried.
PDMS replicas of microchannels were fabricated by standard lithographic patterning of channel designs on Si wafer using SU8 50 photoresist. The width and depth of the channels were 1 mm and 25 , respectively. In order to enhance the bonding between PDMS and ITO, the ITO glass plate was coated with an alkoxysilane solution DMOAP (N, N—dimethyl-N-octadecyl-3-aminopropyltrimethoxysilyl chloride) prior to bonding. The silane coating was found to enhance the bonding between ITO and PDMS and reduces cell adhesion on the electrodes. In order to coat the silane solution, the ITO substrate was cleaned with acetone and DI water followed by dipping the substrate in 1% solution of DMOAP in water. The substrate was agitated at room temperature for 5 min and subsequently rinsed with DI water and blow dried with N2. The ITO substrate was later cured at 110 °C for 1 h. The PDMS channel and coated ITO glass plate were plasma bonded (2 min) to form the microfluidic chip.
EXPERIMENT
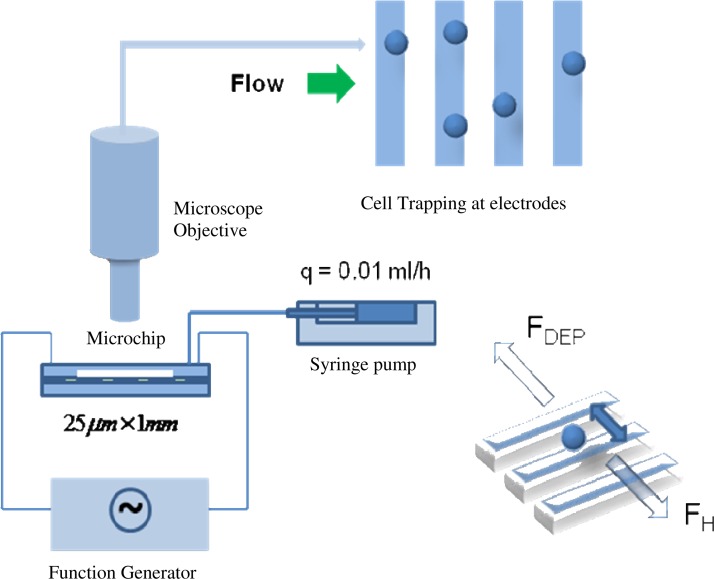
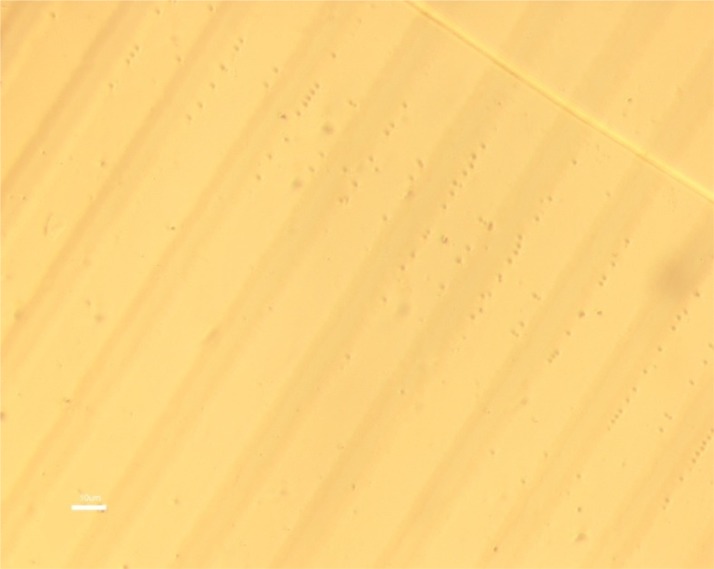
The schematic of the experimental setup is presented in Figure 2. Suspensions of Cryptosporidium and Giardia cells with a concentration of 3 × 10⁶/ml were prepared and pumped into the microfluidic device using a syringe pump. The flow rate in the present experiment was maintained at a steady rate of 0.01 ml/h, which corresponds to a flow velocity of nearly 1.7 × 10⁻⁴ m/s in the microchannel. Conductive epoxy was deposited on the electrode leads in the ITO glass plate and the leads were subsequently connected to a function generator using platinum wires. AC voltages of different amplitudes and frequency were applied to the electrodes in order to determine the optimum voltage for trapping and release of cells. Figure 3 shows the cells trapped at the edges of the electrodes. The cells are trapped by the strip electrodes when a sufficiently high voltage is applied and the maximum DEP force is greater than the hydrodynamic force from the flowing fluid. In our experiments, the cells are first trapped at the strip electrodes (with a voltage of 10 Vpp). The voltage is then lowered slowly until a critical value where the cells are just released and start to flow away. At this critical voltage, the maximum DEP force is just equal to the hydrodynamic force. The critical voltage corresponding to cell release was noted for various frequencies ranging from 10 kHz to 20 MHz. The electric field distribution corresponding to this critical voltage was obtained by numerical simulation of Laplace equation represented in Eq. 20 and the real part of CM factor was calculated according to Eqs. 18, 19.
Figure 2.
Schematic of the video microscopic experimental setup for cell trapping.
Figure 3.
Trapped Cryptosporidium cells at the electrodes. The applied voltage is 5 Vpp and frequency is 200 kHz.
RESULTS AND DISCUSSION
Microfluidic design and operating parameters
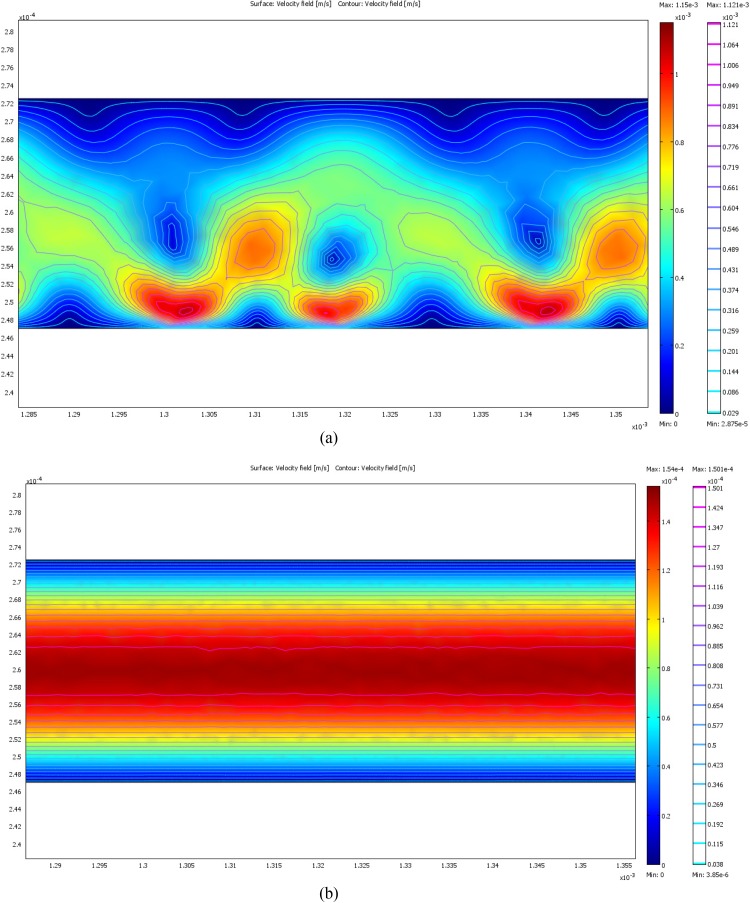
Figures 4a, 4b represent the electrothermal flow fields in the microchannel simulated using Eqs. 20, 21. For the case of S/m and V = 10 Vpp (peak to peak voltage), localized recirculation flows are noticed, with an enhancement of flow velocity in the vicinity of the electrodes. This flow behavior can be attributed to the higher conductivity of the buffer solution, as the magnitude of localized Joule heating is proportional to the buffer conductivity. The resulting electrothermal force governs the electro-hydrodynamic flow in the vicinity of the electrodes. These localized flow vortices are undesirable in the experiment, as they could affect the trapping at the electrodes, resulting in unstable trapping. In the case of lower conductivity buffer solutions ( S/m), the magnitude of electrothermal force is negligible, and the flow in the vicinity of the electrode is not affected. Therefore, deionized water ( S/m) was chosen as the buffer solution for the experiments. The applied field is important as well, as the magnitude of localized Joule heating is proportional to . In our experiments, the maximum value of applied voltage was below 10 Vpp () so that the electrothermal forces calculated using Eq. 22 were negligible and it is safe to assume that there are no local flow disturbances and thermal effects on the cells. As DEP force decays quickly within a few micrometers distance from the electrodes, the channel height becomes a significant parameter in the microfluidic trap design. The channel height of the device used in the present experiments was chosen to be 25 μm. The variation of DEP and hydrodynamic forces across a channel of height 25 μm is presented in Figure 5. For the simulations of DEP and hydrodynamic forces, the cell diameter was assumed to be 2 μm as the Cryptosporidium oocyst cells are observed to be around 2 μm in diameter during experiments, and was initially calculated from the extracted values of cell dielectric parameters (presented in Table TABLE I.) based on electrotation spectra of Cryptosporidium presented in the work of Goater et al.19 On the other hand, Giardia cells are observed to be larger, having a major axis diameter of and minor axis diameter of 4 μm, so that the magnitude of DEP forces would be stronger on these cells. It can be observed that the DEP force is strong enough to trap the cells along the entire height of the channel, when the flow rate q = 0.01 ml/h (which is used in our experiments) and V = 10 Vpp, at sample field frequencies of 2 MHz, 3 MHz, and 4 MHz.
Figure 4.
(a). Electrothermal flow field corresponding to an applied voltage of 10 Vpp and S/m. (b) Electrothermal flow field corresponding to an applied voltage of 10 Vpp and S/m.
Figure 5.
DEP and hydrodynamic forces on a Cryptosporidium oocyst cell in a microfluidic channel of height h = 25 μm.
TABLE I.
Cryptosporidium dielectric properties compared to properties of other bacterial species.
| ɛcyto | ɛmem | σcyto | σmem | |
|---|---|---|---|---|
| Present work—C. parvum | 61.35 | 9.84 | 0.047 | 1.86 × 10⁻⁷ |
| Estimation based on results from the work of Goater et al.19—C. parvum | 56.65 | 8.73 | 0.052 | 3.46 × 10⁻⁷ |
| Present work—G. lambia | 65.58 | 12.11 | 0.016 | 2.47 × 10⁻⁶ |
| Present work—C. muris | 60.46 | 4.39 | 0.052 | 0.95 × 10⁻⁷ |
| Sanchis et al.10—E. Coli | 70 ± 10 | 10 ± 0.5 | 0.07 ± 0.01 | <1.5 × 10⁻⁶ |
| Sanchis et al.10—S. aureus | 70 ± 10 | 16 ± 0.5 | 0.8 ± 0.05 | <1.5 × 10⁻⁶ |
| Suehiro et al.9—E. coli | 60 | 10 | 0.1 | 5 × 10⁻⁸ |
Frequency spectrum of the critical voltage
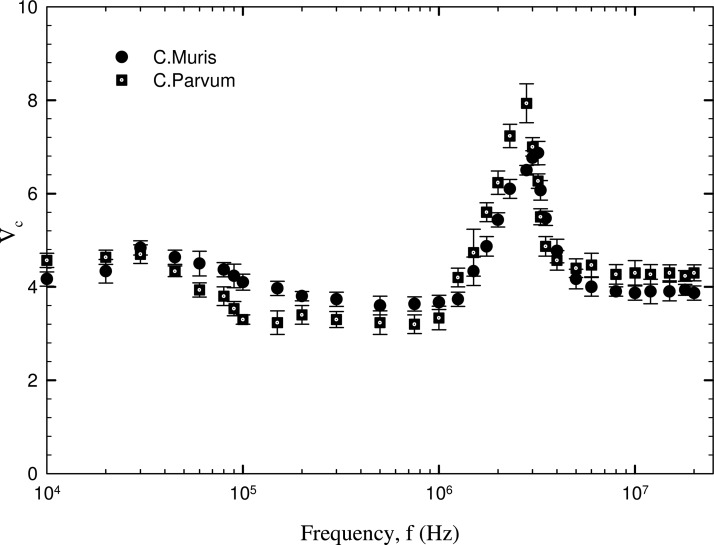
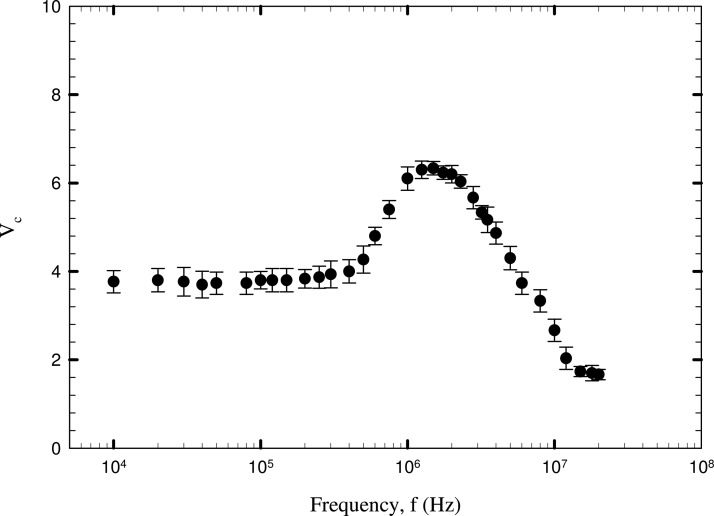
The critical voltage corresponding to the release of the two different type of cells is plotted against the electric field frequency in Figures 67. The two Cryptosporidium cell species show only a qualitative difference in the dielectric behaviour for the range of frequencies studied. For C. parvum, two peak values of critical voltages of 7.8 V (averaged) and 4.7 V occur at about 3 MHz and 30 kHz. In the case of C. muris cells, peak critical voltage of 6.8 V and 4.8 V is achieved at about 3.1 MHz and about 30 kHz. Around these values of critical frequency, both the cells show opposing dielectric behaviour as observed from the increasing and decreasing trends of critical voltage observed in a frequency range of 30 kHz < f < 5 MHz. A decreasing trend of critical voltage would mean an increase in the magnitude of DEP force and vice versa. Therefore, the trend of critical voltage can be understood by the fact that cells undergo both positive and negative DEP across a short frequency range around 30 kHz and 3 MHz. These frequencies can be referred to as the first and second critical frequencies (fc1 and fc2) at which the real part of CM factor becomes equal to 0. This behaviour can be attributed to the dielectric permittivity and conductivity of the biological cells, being much higher than that of insulating particles such as latex (which always exhibit negative DEP in water). For Cryptosporidium, the DEP force nearly remains constant in the range of 100 kHz to 1 MHz as indicated by the near constant values of critical voltage in this range. A consistent negative DEP force is experienced by Giardia cells in the frequency range of 10 kHz to 1 MHz as indicated by the higher voltages of cell release. This indicates that, at lower frequencies, the cells are experiencing negative DEP, which alters to positive DEP at a critical frequency value of 1.5 MHz (first critical frequency, fc1) and the values of fc2 is beyond 20 MHz. The frequency corresponding to the peak value of critical voltage indicates very low value of DEP force (positive or negative). For Cryptosporidium cells, the regime > 3 MHz indicates stronger negative DEP force, with the critical voltage required for particle release lowering to about 2 V. The G. lambia cells show opposite dielectric behaviour from the Cryptosporidium cells as is observed from the higher values of critical voltages at low frequencies and lower values of critical voltages at higher frequencies. In effect, this means that in the proximity of a frequency value of 3 MHz, where both Cryptosporidium and Giardia cells show weak DEP forces, separation of cells would be difficult unless high values of voltages (in order to amplify the dielectric difference) are used.
Figure 6.
Frequency spectrum of the critical Voltage of Cryptosporidium cell release.
Figure 7.
Frequency spectrum of the critical Voltage of Giardia cell release.
Real part of CM factor and cell dielectric parameters
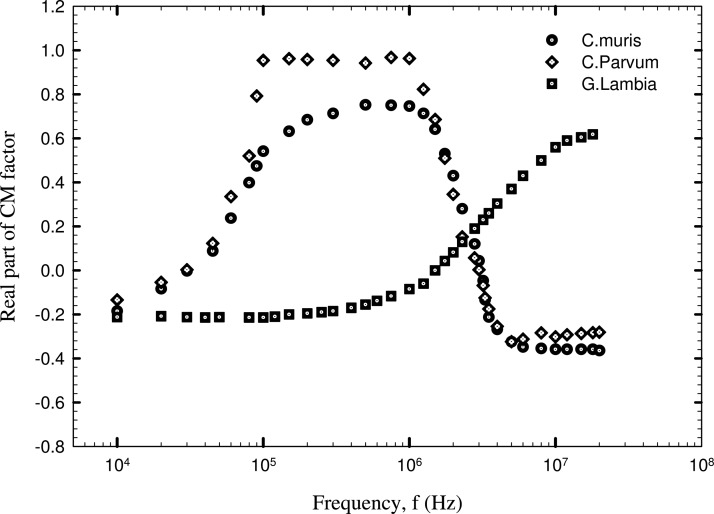
The real part of CM factor was calculated using Eqs. 18, 19. The field gradient term was obtained by numerical simulation corresponding to the critical voltage values plotted in Figures 67. The hydrodynamic correction factor , , and were computed assuming that; (1) in the case of negative DEP, the cells are trapped and positioned one cell radius away from the top channel wall and (2) the case of positive DEP, the cells are trapped at the bottom electrodes. Figure 8 depicts the real part of CM factor of the three different cells corresponding to different field frequencies. The average values of Vc corresponding to each frequency was employed for calculation of Re(fCM). From Figure 8, the cross over frequency (the frequency corresponding to Re(fCM) = 0, which represents transition from positive to negative DEP) was estimated to be 3 MHz for C. parvum and 3.1 MHz for C. muris. This information is vital in the operation of pDEP traps and field flow fractionation (FFF) devices using nDEP levitation, as the regime of strong pDEP and nDEP forces can be determined from the CM factor plot. In the present case, Cryptosporidium cells experience a maximum pDEP force in a frequency range 100 kHz < f < 1 MHz and a maximum nDEP force when f > 4 MHz. The contrary becomes true in the case of G. lambia cells, with a stronger pDEP regime when f > 3 MHz and a stronger nDEP regime when f < 1 MHz.
Figure 8.
Clausius-Mossotti factor of Cryptosporidium and Giardia cells.
Referring to Eqs. 11, 12, and are the unknowns to be calculated as the medium permittivity is a known quantity. The thickness of the Cryptosporidium cell membrane layer can be assumed to be nearly 50 nm,20 while the membrane thickness of Giardia cells are larger and assumed to be 400 nm.21 Therefore, the radius ratio of the cells can be calculated. In order to generate equations for solving the unknowns, Re(fCM) corresponding to the frequency values plotted in Figure 8 is expanded in terms of the cytoplasm and membrane dielectric parameters using Eqs. 11, 12. After some algebraic manipulation, a set of highly nonlinear equations are obtained. These equations are solved by nonlinear least squares method to obtain a best fit. In addition, using the same technique, dielectric parameters of C. parvum were extracted from results of electrotation spectra presented in the work of Goater et al.,19 after expressing for the cell electrorotational velocity in terms of the imaginary part of CM factor, . The results from the present work and results based on Goater’s work agree reasonably well. Table TABLE I. shows the dielectric parameters of the cell compartments obtained in the present study compared with the results obtained for other Gram positive (S. aureus) and Gram negative (E. coli) bacteria from Sanchis et al.10 and Johari et al.7 Gram positive bacteria such as S. aureus has a significantly higher cytoplasm conductivity compared to the Cryptosporidium, which could be explained in line with the known fact that Gram positive bacteria have a higher K+ content in their cytoplasm. As the two species have nearly the same size (1-2 cell radius), the difference in dielectric properties of the above two species may be utilized as a key parameter for separation of the two species on-chip. Conversely, the difference in dielectric permittivity and conductivity of E. coli (nearly 2 μm long rod shaped bacteria) and Cryptosporidium are relatively small, therefore, on-chip separation may not be feasible without the use of high electric fields, which in turn may damage the cells. However, the contrasting behaviour of the G. lambia and C. muris/C. parvum cells provide an interesting prospective of separating them on-chip at frequencies >5 MHz and frequencies <1 MHz. The dielectric parameters (especially, the conductivity value) obtained for the membrane layer are significantly lower compared to that of the cytoplasm layer. This can be attributed to the permeable and lipidic nature of the cell membrane and presence of metal ions in the cytoplasm. It has to be mentioned here that the present work is focused on a single shell model including a cell cytoplasm and plasma membrane. Further refinement in cell modelling will involve a double shell model, incorporating a three compartment structure: cytoplasm, plasma membrane, and cell wall. However, this will introduce additional mathematical complexity in the modelling and solving for the dielectric parameters.
On-chip separation of C. muris and G. lambia
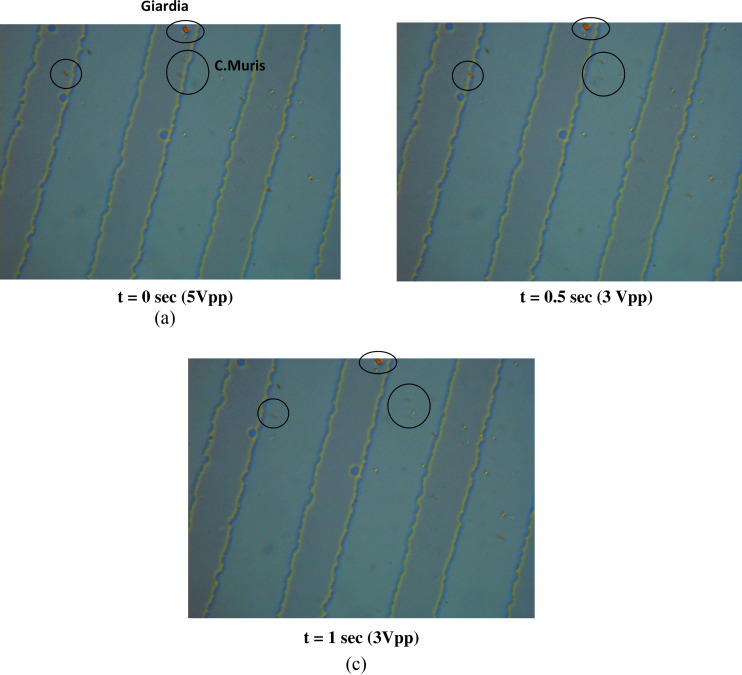
Figure 9 shows the snapshots of the separation of C. muris and G. lambia cells (circled cells) at a frequency of 10 MHz and a voltage of 3 Vpp. The Giardia cells experience positive DEP at this frequency value and are strongly trapped at the electrodes. This is depicted by the blurred C. muris cells that are present in a different plane compared to G. lambia cells as they are levitated by nDEP. At this frequency, the Cryptosporidium cells require voltages in excess of 4 Vpp to be stably trapped by nDEP. In Figure 9, frame 1 shows both C. muris and G. lambia trapped on the electrode at f = 10 MHz and 5 Vpp. Subsequently, the voltage is lowered to 3 Vpp and the remaining two snapshots at t = 0.5 s and t = 1 s shows the C. muris cells getting released from the electrode and moving while G. lambia cells remains on the electrode. At this voltage, the hydrodynamic forces on the C. muris cells overcome the nDEP force on the cells and results in the release of cells from the electrode. The pDEP force on the Giardia cells is strong enough to hold the cells on the electrode upto a voltage of 2 Vpp (as depicted in the critical voltage plot in Figure 7). On the other hand, for most of the frequency range, separation of C. parvum and C. muris cells will be a challenging task, as both these cells show only a minor quantitative difference in their dielectric properties, except for the region 200 kHz < f < 1 MHz.
Figure 9.
Snapshots of separation of G. lambia and C. muris at 10 MHz.
CONCLUSIONS
The present work shows an efficient scheme for on-chip trapping, characterization, and separation of pathogens on chip using DEP. The dielectric properties of the cytoplasm and membrane compartments of the cells were determined via the measurement of critical voltage corresponding to release of trapped cells from electrodes. The real part of CM factor was estimated from the critical voltage plot, in an effort to locate the DEP crossover frequency for the cells. Finally, the dielectric parameters of the cell compartments were estimated from the real part of CM factor. Separation of C. muris and G. lambia samples was achieved at a frequency of 10 MHz and voltage of 3 Vpp. In addition, the microdevice allows a rapid assessment of bacterial or other cell samples, with easy integration into lab-on-a chip systems for clinical or research purposes. The strong bonding between silane-coated ITO electrodes and PDMS allows repeated usage of the device for several hours of experimental duration.
ACKNOWLEDGMENTS
The authors greatly acknowledge the funding support from NRF (EWI), Singapore—Grant No. 0803-IRIS-02.
References
- Morgan H. and Green N. G., J. Electrost. 42, 279 (1997). 10.1016/S0304-3886(97)00159-9 [DOI] [Google Scholar]
- Hughes M. P., Morgan H., Rixon F. J., Biochim. Biophys. Acta 1571, 1 (2002). 10.1016/S0304-4165(02)00161-7 [DOI] [PubMed] [Google Scholar]
- Soumya K. S., Prashant R. D., Shane C. B., and R. M. Adrienne, Electrophoresis 29, 5033 (2008). 10.1002/elps.200800166 [DOI] [PubMed] [Google Scholar]
- Gimsa J., “Characterization of particles and biological cells by AC electrokinetics,” in Interfacial Electrokinetics and Electrophoresis, edited by Delgado A. V. (Marcel Dekker Inc., New York, 2001), pp. 369–400. [Google Scholar]
- Hozel R., J. Electrost. 56, 435 (2002). 10.1016/S0304-3886(02)00109-2 [DOI] [Google Scholar]
- Ratanachoo K., Gascoyne P. R. C., and Ruchirawat M., Biochim. Biophys. Acta 1564, 449 (2002). 10.1016/S0005-2736(02)00494-7 [DOI] [PMC free article] [PubMed] [Google Scholar]
- Johari J., Hubner Y., Hull J. C., Dale J. W., and Hughes M. P., Phys. Med. Biol. 48, 193 (2003). 10.1088/0031-9155/48/14/401 [DOI] [PubMed] [Google Scholar]
- Milner K. R., Brown A. P., Allsopp D. W. E., and Betts W. B., IEEE Electron Device Lett. 34, 66 (1998). [Google Scholar]
- Suehiro J., Hamada R., Noutomi D., Shutou M., and Hara M., J. Electrost. 57, 157 (2003). 10.1016/S0304-3886(02)00124-9 [DOI] [Google Scholar]
- Sanchis A., Brown A. P., Sancho M., Martinez G., Sebastian J. L., Munoz S., and Miranda J. M., Bioelectromagnetics 28, 393 (2007). 10.1002/bem.v28:5 [DOI] [PubMed] [Google Scholar]
- Dupont H. L., Chappell C. L., Sterling C. R., Okhuysen P. C., Rose J. B., and Jakubowski W., N. Engl. J. Med. 332(13), 855 (1995). 10.1056/NEJM199503303321304 [DOI] [PubMed] [Google Scholar]
- Current W. L. and Garcia L. S., Clin. Microbiol. Rev. 4(3), 325 (1991). [DOI] [PMC free article] [PubMed] [Google Scholar]
- Murugkar S., Evans C. L., Xie X. S., and Anis H., J. Microsc. 233, 244 (2008). 10.1111/j.1365-2818.2009.03114.x [DOI] [PMC free article] [PubMed] [Google Scholar]
- Wang L., Lu J., Marchenko S. A., Monuki E. S., Flanagan L. A., and Lee A. P., Electrophoresis 30, 782 (2009). 10.1002/elps.200800637 [DOI] [PubMed] [Google Scholar]
- Jones T. B., Electromechanics of Particles (Cambridge University Press, New York, 1995). [Google Scholar]
- Yang C. Y. and Lei U., J. Appl. Phys 102(094702), 1 (2007). [Google Scholar]
- Happel J. and Brenner B., Low Reynolds Number Hydrodynamics (Dordrecht, Kluwer, 1983). [Google Scholar]
- Ramos A., Morgan H., Green N. G., and Castellanos A., J. Phys. D: Appl. Phys. 31, 2338 (1998). 10.1088/0022-3727/31/18/021 [DOI] [Google Scholar]
- Goater A. D., Burt J. P. H., and Pethig R., J. Phys. D. Appl. Phys. 30(18), L65 (1997). 10.1088/0022-3727/30/18/001 [DOI] [Google Scholar]
- Smith H. V., Nichols R. A. B., and Grimason A. M., Trends Parasitol. 21(3), 133 (2005). 10.1016/j.pt.2005.01.007 [DOI] [PubMed] [Google Scholar]
- Chatterjee A. L., Carpentieri A., Ratner D. M., Bullitt E., Costello C. E., Robbins P. W., and Samuelson J., Giardia Cyst Wall Protein 1 Is a Lectin That Binds to Curled Fibrils of the GalNAc Homopolymer. 6(8), 1 (2010). [DOI] [PMC free article] [PubMed] [Google Scholar]


