

Abstract
Proper histone levels are critical for transcription, chromosome segregation, and other chromatin-mediated processes1-7. In Saccharomyces cerevisiae, the histones H2A and H2B are encoded by two gene pairs, named HTA1-HTB1 and HTA2-HTB2 (ref. 8). Previous studies have demonstrated that when HTA2-HTB2 is deleted, HTA1-HTB1 dosage compensates at the transcriptional level4,9. Here we show that a different mechanism of dosage compensation, at the level of gene copy number, can occur when HTA1-HTB1 is deleted. In this case, HTA2-HTB2 amplifies via creation of a new, small, circular chromosome. This duplication, which contains 39 kb of chromosome II, includes HTA2-HTB2, the histone H3-H4 locus HHT1-HHF1, a centromere and origins of replication. Formation of the new chromosome occurs by recombination between two Ty1 retrotransposon elements that flank this region. Following meiosis, recombination between these two particular Ty1 elements occurs at a greatly elevated level in hta1-htb1Δ mutants, suggesting that a decreased level of histones H2A and H2B specifically stimulates this amplification of histone genes. Our results demonstrate another mechanism by which histone gene dosage is controlled to maintain genomic integrity.
Although early genetic studies of S. cerevisiae genes encoding histones H2A and H2B clearly demonstrated that they are essential for growth10,11, deletion of either of the H2A-H2B loci seemed to allow viability4,6. In those studies, hta2-htb2Δ mutants were shown to grow normally, presumably owing to increased transcription of HTA1-HTB14,9. In contrast, hta1-htb1Δ mutants were shown to have several mutant phenotypes, including defects in transcription and chromatin structure3,4,6,12. Notably, several unresolved mysteries have surrounded hta1-htb1Δ mutants. First, it was reported13 that some hta1-htb1Δ strains contain two copies of HTA2-HTB2, although this possible duplication was not characterized. Second, the S. cerevisiae deletion project reported that, whereas an hta1Δ mutant is viable, an htb1Δ mutant is inviable14. Finally, although hta1-htb1Δ mutants have been constructed in an S288C background, such mutants are inviable in W303 background (P. Kaufman and M. A. Osley, personal communication).
As an initial step in further characterizing hta1-htb1Δ mutants, we analysed strains previously suspected of containing an HTA2-HTB2 duplication13. In this analysis we included the hta1Δ mutant from the S. cerevisiae deletion project14. To test for possible genomic changes, chromosomes were separated using contour-clamped homogeneous electric field (CHEF) gels and then probed by Southern analysis using an HTA2-HTB2 probe (Fig. 1a). Our results show that for all hta1-htb1Δ strains and the hta1Δ strain, the HTA2-HTB2 probe hybridized both to chromosome II, the normal location of HTA2-HTB2, and to a second prominent band (Fig. 1b). Thus, in these strains, HTA2-HTB2 exists as a second copy that is not part of chromosome II.
Figure 1. Characterization of HTA2-HTB2 amplification in hta1-htb1Δ.
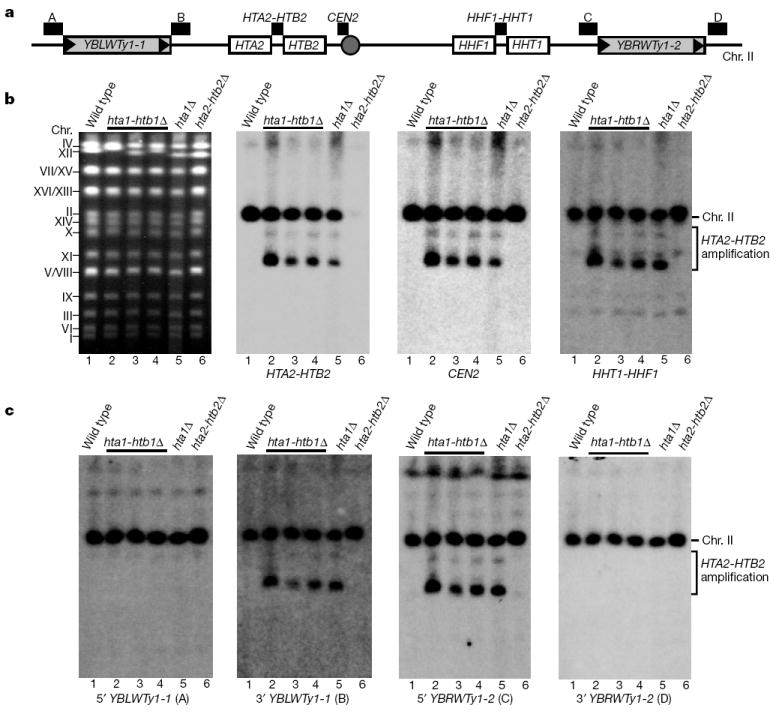
a, A simplified genome map of the HTA2-HTB2 region on chromosome II. The white boxes represent the HTA2-HTB2 and HHT1-HHF1 histone loci. The grey boxes represent the Ty1 elements, YBLWTy1-1 and YBLWTy1-2, with the long terminal repeats (known as LTRs or δ elements) shown as black triangles. The grey circle represents the centromere. The probes used in b and c are represented as black bars above the map in a; the probe used for each Southern analysis is indicated below the blots in b and c. A complete map of the region is shown in Supplementary Fig. 1. b, Separated chromosomes from S. cerevisiae strains were analysed on a CHEF gel. Each panel shows a wild-type strain (lane 1), three hta1-htb1Δ strains (lanes 2–4), the hta1Δ strain from the deletion project (lane 5), and an hta2-htb2Δ strain (lane 6). The left panel is an ethidium-bromide-stained gel showing the positions of the chromosomes. The altered migration of chromosome XII is a consequence of the rDNA repeats, which are known to vary in number26. The other three panels show analysis of the same gel by Southern hybridization analysis. c, Chromosomes from the same strains were examined as in b using probes just outside (probes A and D) and within (probes B and C) the region flanked by YBLWTy1-1 and YBLWTy1-2. The hta1Δ strain from the deletion set has the identical pattern to our hta1-htb1Δ strains. We assume that during construction of the deletion set, the hta1Δ strain acquired the amplification and the htb1Δ strain did not. Chr., chromosome.
To determine the size of the HTA2-HTB2 amplification in hta1-htb1Δ mutants, we tested for amplification of flanking sequences. HTA2-HTB2 is in a 33-kb region, flanked by Ty1 elements, that contains the centromere and 15 genes, including the histone H3-H4 locus HHT1-HHF1 (Fig. 1a; Supplementary Fig. 1). Our results show that sequences between the Ty1 elements display the same hybridization pattern as HTA2-HTB2 in the hta1-htb1Δ strains (Fig. 1b, c). In contrast, sequences just outside the Ty1 elements were present in single copy in all strains tested (Fig. 1c). These results establish that the amplified region is delimited by the flanking Ty1 elements.
To determine whether all hta1-htb1Δ strains would contain the same amplification, additional hta1-htb1Δ strains were constructed by two methods. First, we deleted HTA1-HTB1 in a diploid, sporulated the HTA1-HTB1/hta1-htb1Δ heterozygote, and dissected tetrads. Among 78 tetrads analysed, 149/156 HTA1-HTB1 spores germinated and grew normally. In contrast, most hta1-htb1Δ spores failed to germinate, suggesting that this deletion causes inviability. Eventually, 20/156 hta1-htb1Δ spores formed colonies, appearing two days later than the wild-type colonies (Fig. 2a). (In a separate experiment, 70 hta1-htb1Δ spores that failed to form colonies were examined by microscopy and all failed to proceed past a single cell division (Supplementary Table 1; Supplementary Discussion).) When the viable hta1-htb1Δ strains were restreaked, they had a growth rate similar to that of the wild type (Supplementary Fig. 2a). To test the new viable hta1-htb1Δ strains for the amplification, 15 were examined by CHEF gel Southern analyses (Fig. 2b and data not shown) and all were shown to contain the amplification event observed in Fig. 1. This suggests that the amplification is required for the viability of hta1-htb1Δ strains and that it occurs at a high frequency in hta1-htb1Δ spores (see Supplementary Discussion). Additional experiments show that the HTA2-HTB2 genes within the amplification are sufficient for viability in hta1-htb1Δ strains (Supplementary Fig. 3). Southern hybridizations and real-time polymerase chain reaction (PCR) determined that the amplification copy number is approximately one per cell (data not shown).
Figure 2. Analysis of newly constructed hta1-htb1Δstrains.

a, Strains from HTA1-HTB1/hta1-htb1Δ tetrad dissection. Shown is a representative tetrad dissection plate. Each column shows growth of the four progeny from a single tetrad. The large colonies are wild type and the small colonies are hta1-htb1Δ. The apparent slow growth of the hta1-htb1Δ colonies is caused by slow germination (see Supplementary Discussion). Most spores that failed to germinate, for example, tetrad 1 spore D, were also hta1-htb1Δ. b, Four hta1-htb1Δ progeny (lanes 1–4) and two wild-type progeny (lanes 5 and 6) generated from the HTA1-HTB1/(hta1-htb1)Δ tetrad dissection were analysed by a CHEF gel Southern analysis probed with HTA2-HTB2. Controls include the HTA1-HTB1/hta1-htb1Δ parent diploid (lane 7), an hta1-htb1Δ haploid (lane 8) and a wild-type strain (lane 9). All strains were tested with the same probes as Fig. 1 and shown to contain the same amplified region (data not shown).
In a second approach, we constructed an hta1-htb1Δ haploid strain containing an HTA1-HTB1 URA3 plasmid. Three independent cultures were plated on 5-fluoroorotic acid (5-FOA) medium to select for viable derivatives without the plasmid, thus generating new hta1-htb1Δ strains. Of the resistant (5-FOAR) colonies generated, 6/32 examined contained the amplification (Supplementary Fig. 2b). The frequency of the amplification was determined to be 3 ×10⁻⁵ amplification events per cell (Supplementary Table 2; Supplementary Discussion). Of the hta1-htb1Δ strains without the amplification, ten were tested and shown to be chromosome II disomes; all ten had a severe growth defect (Supplementary Fig. 2). Altogether, these results show that hta1-htb1Δ strains require two copies of HTA2-HTB2 for viability. The remainder of our studies focused on the amplification event.
Several results suggested that the amplified version of HTA2-HTB2 is circular and formed by homologous recombination between the Ty1 elements (Supplementary Discussion). To test for a circle, three experiments were performed. First, PCR was performed with primers designed to amplify a product only if the Ty1-Ty1 recombination on chromosome II occurred. Our results show that, in contrast to wild-type strains, all hta1-htb1Δ strains tested produced the PCR product expected from the Ty1-Ty1 recombinant (Fig. 3a). Second, Southern analyses of restriction-enzyme-digested genomic DNA were probed for fragments that would exist in only the recombinants. Our results demonstrate a novel restriction fragment with a size consistent with a 39 kb circular chromosome formed by recombination between the Ty1 elements (Supplementary Fig. 4). Third, homothallic switching (HO) endonuclease was used to cut the amplified DNA in vivo. If the amplified DNA is circular, then linearization by HO endonuclease digestion would cause a large shift in its migration in CHEF gels. Therefore, hta1-htb1Δ strains were constructed with a HO endonuclease site integrated near the HTA2-HTB2 locus and with a plasmid containing the HO gene under the control of the GAL1 promoter. Our results show that upon HO induction, the migration of the amplified DNA shifts markedly, consistent with the linearization of a 39 kb circular chromosome (Fig. 3b; compare lanes 15 and 16). Collectively, these results provide strong evidence that the amplified HTA2-HTB2 locus is a novel circular chromosome.
Figure 3. Tests for the presence of a 39 kb circular chromosome.

a, PCR test for recombination between YBLWTy1-1 and YBLWTy1-2. The left side shows an abbreviated view of the HTA2-HTB2 region of chromosome II, before and after recombination between the two Ty1 elements. The arrows indicate the PCR primers designed to amplify a product only if the recombination event occurred. The right side shows an ethidium-bromide-stained gel of the PCR products. Lanes 1–4 are four independently derived hta1-htb1Δ strains containing the amplification. The presence of the 7,500 bp PCR product is consistent with the predicted recombination event. The less intense 930 bp band is probably due to crossover PCR between partly synthesized products. CHA1 is a positive control for the PCR. b, Cleavage of the amplification by HO endonuclease. The left diagram indicates the location of the HO endonuclease site on chromosome II and the amplification. The right side shows an HTA2-HTB2-probed CHEF gel Southern analysis of wild-type and hta1-htb1Δ strains, with and without the HO site, before and after HO induction. The 252 kb band in lanes 12 and 16 is a fragment of chromosome II produced by HO cleavage. The 39 kb band in lane 16 indicates a linearized form of the amplification.
Two experiments were performed to examine the role of Ty1 elements in the amplification. First, to test whether both Ty1 elements on chromosome II are required for the amplification, HTA1-HTB1/hta1-htb1Δ diploids that were homozygous for deletion of one of the two Ty1 elements were constructed. For the deletion of YBLWTy1-1, 37 tetrads were analysed and only 4/74 hta1-htb1Δ spores formed colonies. For the deletion of YBRWTy1-2, 46 tetrads were analysed and only 1/92 hta1-htb1Δ spores grew. All five of these strains grew extremely slowly, and none of them contained the amplification (Fig. 4a). Genetic analysis suggested that these strains are disomic for chromosome II. The conclusion that the amplification requires both Ty1 elements is also supported by experiments with S. cerevisiae W303. Unlike the S288C background, deletion of HTA1-HTB1 causes inviability in all hta1-htb1Δ spores in the W303 background (P. Kaufman and M. A. Osley, personal communication). Our analysis of W303 has shown that only a solo δ element exists in place of YBRWTy1-2 (Supplementary Fig. 5). Taken together, our results strongly suggest that each of the Ty1 elements on chromosome II is required for the amplification event.
Figure 4. Characterization of the recombination event to amplify histone genes.
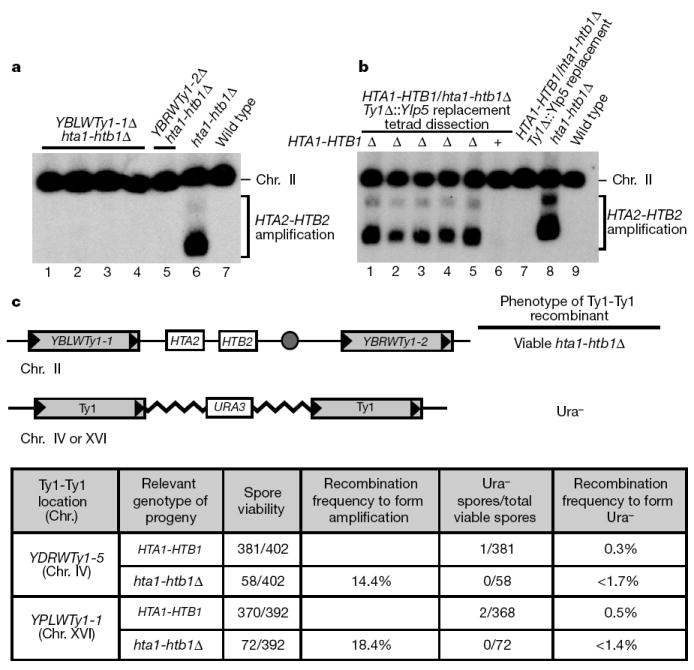
a, Analysis of Ty1 deletion mutants. HTA1-HTB1/hta1-htb1Δ diploids that are homozygous for deletion of either YBLWTy1-1 or YBLWTy1-2 were sporulated and hta1-htb1Δ survivors were analysed for the amplification. Shown is a CHEF gel Southern analysis probed with HTA2-HTB2. YBLWTy1-1Δ hta1-htb1Δ strains (lanes 1–4) and the YBLWTy1-2Δ hta1-htb1Δ strain (lane 5) do not contain the HTA2-HTB2 amplification. Controls are an hta1-htb1Δ mutant with normal Ty1 elements (lane 6) and a wild-type strain (lane 7). b, Replacement of the Ty1 elements. HTA1-HTB1/hta1-htb1Δ diploids in which the Ty1 elements YBLWTy1-1 and YBRWTy1-2 were each replaced with Ylp5, were sporulated and dissected. Surviving hta1-htb1Δ strains (lanes 1–5) and wild-type progeny (lane 6) were analysed as described for a. Controls include the parent diploid (lane 7), an hta1-htb1Δ haploid (lane 8), and a wild-type strain (lane 9). By PCR, the HTA2-HTB2 amplification in the Ty1 replacement hta1-htb1Δ strains was confirmed to be a circular chromosome (data not shown). Note that owing to its slightly smaller size, the band for the Ylp5-containing amplification migrates faster than the Ty1-containing amplification (compare lanes 1–5 with lane 8). c, Frequency of Ty1-Ty1 recombination in wild-type and hta1-htb1Δ strains. The diagram depicts the Ty1 flanked region of chromosome II with the HTA2-HTB2 locus and the Ty1-URA3-Ty1 configuration on chromosome IV or XVI. In the Ty1-URA3-Ty1 constructs, the Ty1 elements are 17 kb apart, compared with 33 kb for the Ty1 elements on chromosome II. The expected phenotypes of recombinants at both classes of loci are indicated. HTA1-HTB1/hta1-htb1Δ diploid strains were constructed that are homozygous for either Ty1-URA3-Ty1 configuration. The diploids were sporulated and analysed for the phenotypes of recombinants at either locus. The table presents the results of the Ty1-Ty1 recombination assay. The amplification frequency was found to be 14–18% in hta1-htb1Δ. In contrast, none of the viable hta1-htb1Δ progeny lost the URA3 marker, demonstrating that the HTA2-HTB2 amplification event occurs at a significantly higher frequency than the Ty1-URA3-Ty1 recombination event. All three pairs of Ty1 elements are capable of normal levels of recombination during mitotic growth (Supplementary Table 3). In a separate experiment, the HTA2-HTB2 amplification frequency in wild-type strains following meiosis was found to be close to 0% (see Supplementary Methods).
Second, to test whether the amplification can occur if the Ty1 elements are replaced by a different sequence of similar length, we replaced each Ty1 with linearized plasmid Ylp5 (ref. 15). Ylp5 is 5.5 kb long (compared with 5.9 kb for Ty1) and contains no homology to Ty1 elements. To measure the recombination frequency, HTA1-HTB1/(hta1-htb1)Δ diploids homozygous for the Ty1 replacements with Ylp5 were sporulated. From 115 tetrads, 44/230 hta1-htb1Δ spores (19.1%) contained the amplification, a frequency comparable to that observed for amplification with the Ty1 elements. Both CHEF gels (Fig. 4b) and PCR (data not shown) confirmed that the amplification was an extrachromosomal circle. Thus, Ty1 elements are not required for the amplification, suggesting that any homologous sequence of adequate length is sufficient.
The amplification event that we have described occurs at a greatly elevated frequency in hta1-htb1Δ mutants following meiosis, compared with the frequencies of previously studied Ty-Ty recombination events16-18. This high frequency might reflect a genome-wide elevation of recombination in hta1-htb1Δ mutants due to reduced levels of histones H2A and H2B. Alternatively, the high frequency of recombination may be specific to this pair of Ty1 elements. To distinguish between these possibilities, we measured the recombination frequency for two additional pairs of adjacent Ty1 elements under the same conditions in which the histone gene amplification occurs. As a control, we first showed that each of these pairs of Ty1 elements has normal levels of mitotic recombination (Supplementary Table 3). Our results (Fig. 4c) show that the level of Ty1-Ty1 recombination that gives rise to the amplification is significantly higher than for either of the other Ty1-Ty1 recombination events following meiosis, demonstrating that there is not a genome-wide elevation of recombination. Rather, the recombination event that forms the amplification appears to be enhanced specifically at this locus in hta1-htb1Δ spores.
How can a high level of recombination between two specific Ty elements be explained? Indeed, previous studies have shown that Ty elements are generally cold for meiotic recombination and, in fact, suppress the activity of nearby recombination hotspots19. Several factors have been suggested to control meiotic recombination levels, including chromatin structure and histone modifications20. In addition, earlier analysis of hta1-htb1Δ mutants demonstrated that they have localized, rather than general, effects on chromatin structure3. Thus, when H2A and H2B levels are reduced, as in hta1-htb1Δ spores, there may be a specific local alteration of chromatin structure to create a hotspot for recombination, resulting in the observed amplification frequency. Conceivably, the recombination frequency could also be affected by transcription levels, as has been suggested for the S. cerevisiae recombination enhancer that controls the directionality of mating-type switching21,22. However, our results suggest that Ty1 transcription is not a critical factor (see Supplementary Discussion).
Ty elements have been suggested to mediate genomic rearrangements under selective pressure23. Our work has identified a previously unknown mechanism by which Ty elements enable histone genes to dosage-compensate in response to reduced histone levels. To our knowledge, this is the first example of a natural role for Ty elements that is dependent upon their specific genomic position. This amplification mechanism would also allow the transient modulation of histone levels in wild-type cells in response to the need for altered histone levels; the amplification could occur when more histones are required, and the circular chromosome could be easily lost when this requirement ends. The amplification described here suggests that similar transposon-related mechanisms may serve in adaptive gene amplification in other organisms, including humans, where 45% of the genome consists of transposons24,25.
METHODS
Details of strains, plasmids, media, CHEF gel analysis, Southern blot hybridization analysis, PCR across Ty elements, and HO endonuclease experiments can be found in Supplementary Information.
Ty1-Ty1 recombination assay
Ty1-Ty1 recombination markers were constructed to determine the level of Ty1-Ty1 recombination in wild-type and hta1-htb1Δ strains. To do this, plasmid B155, which contains a complete Ty1 and URA3, was used to transform FY26. Integrants resulting from recombination between the Ty1 element on the plasmid and a Ty1 element in the genome result in two Ty1 elements flanking 17 kb of plasmid sequences including URA3. The integration location was mapped using CHEF gels, Southern blots and PCR analysis. Two different integrants were chosen for further analysis: in FY2526, B155 integrated at YPLWTy1-1 on chromosome XVI, and in FY2523, B155 integrated at YDRWTy1-5 on chromosome IV. By a series of crosses (FY2526 × FY2525 and FY2523 × FY2524) and selection on 5-fluoroanthranilic acid (5-FAA) media to lose the pDL2 plasmid, HTA1-HTB1/hta1-htb1Δ diploid strains, homozygous for either of the Ty1-Ty1 recombination markers, were constructed. For Fig. 4c, the resultant diploids were then sporulated and tetrads dissected to assess the stability of the Ty1-Ty1 recombination marker in both wild-type and hta1-htb1Δ spores. If the frequency of Ty1-Ty1 recombination throughout the genome is elevated to the same frequency of the Ty1-Ty1 recombination event that generates the amplification (14–18%), then 14–18% of hta1-htb1Δ strains with the amplification would be expected to be Ura−.
Supplementary Material
Acknowledgments
We thank A. Dudley and D. Helmlinger for helpful comments on the manuscript. We also thank J. Haber and J.-A. Kim for the suggestion of and advice on the HO experiment, and V. Dror for instruction about CHEF gels. We are grateful to A. Gabriel, P. Kaufman, M. A. Osley and T. Petes for sharing unpublished results and for discussions. We thank J. Hirschhorn, whose observations led to this project. This work was supported by a grant from the National Institutes of Health to F.W. and by a National Science Foundation Graduate Fellowship to D.E.L.
Footnotes
Supplementary Information is linked to the online version of the paper at www.nature.com/nature.
The authors declare no competing financial interests.
References
- 1.Meeks-Wagner D, Hartwell LH. Normal stoichiometry of histone dimer sets is necessary for high fidelity of mitotic chromosome transmission. Cell. 1986;44:43–52. doi: 10.1016/0092-8674(86)90483-6. [DOI] [PubMed] [Google Scholar]
- 2.Gunjan A, Verreault AA. Rad53 kinase-dependent surveillance mechanism that regulates histone protein levels in S. cerevisiae. Cell. 2003;115:537–549. doi: 10.1016/s0092-8674(03)00896-1. [DOI] [PubMed] [Google Scholar]
- 3.Norris D, Dunn B, Osley MA. The effect of histone gene deletions on chromatin structure in Saccharomyces cerevisiae. Science. 1988;242:759–761. doi: 10.1126/science.2847314. [DOI] [PubMed] [Google Scholar]
- 4.Norris D, Osley MA. The two gene pairs encoding H2A and H2B play different roles in the Saccharomyces cerevisiae life cycle. Mol Cell Biol. 1987;7:3473–3481. doi: 10.1128/mcb.7.10.3473. [DOI] [PMC free article] [PubMed] [Google Scholar]
- 5.Han M, Chang M, Kim UJ, Grunstein M. Histone H2B repression causes cell-cycle-specific arrest in yeast: effects on chromosomal segregation, replication, and transcription. Cell. 1987;48:589–597. doi: 10.1016/0092-8674(87)90237-6. [DOI] [PubMed] [Google Scholar]
- 6.Clark-Adams CD, Norris D, Osley MA, Fassler JS, Winston F. Changes in histone gene dosage alter transcription in yeast. Genes Dev. 1988;2:150–159. doi: 10.1101/gad.2.2.150. [DOI] [PubMed] [Google Scholar]
- 7.Han M, Grunstein M. Nucleosome loss activates yeast downstream promoters in vivo. Cell. 1988;55:1137–1145. doi: 10.1016/0092-8674(88)90258-9. [DOI] [PubMed] [Google Scholar]
- 8.Hereford L, Fahrner K, Woolford J, Jr, Rosbash M, Kaback DB. Isolation of yeast histone genes H2A and H2B. Cell. 1979;18:1261–1271. doi: 10.1016/0092-8674(79)90237-x. [DOI] [PubMed] [Google Scholar]
- 9.Moran L, Norris D, Osley MA. A yeast H2A-H2B promoter can be regulated by changes in histone gene copy number. Genes Dev. 1990;4:752–763. doi: 10.1101/gad.4.5.752. [DOI] [PubMed] [Google Scholar]
- 10.Rykowski MC, Wallis JW, Choe J, Grunstein M. Histone H2B subtypes are dispensable during the yeast cell cycle. Cell. 1981;25:477–487. doi: 10.1016/0092-8674(81)90066-0. [DOI] [PubMed] [Google Scholar]
- 11.Kolodrubetz D, Rykowski MC, Grunstein M. Histone H2A subtypes associate interchangeably in vivo with histone H2B subtypes. Proc Natl Acad Sci USA. 1982;79:7814–7818. doi: 10.1073/pnas.79.24.7814. [DOI] [PMC free article] [PubMed] [Google Scholar]
- 12.Hirschhorn JN, Brown SA, Clark CD, Winston F. Evidence that SNF2/SWI2 and SNF5 activate transcription in yeast by altering chromatin structure. Genes Dev. 1992;6:2288–2298. doi: 10.1101/gad.6.12a.2288. [DOI] [PubMed] [Google Scholar]
- 13.Hirschhorn JN, Bortvin AL, Ricupero-Hovasse SL, Winston F. A new class of histone H2A mutations in Saccharomyces cerevisiae causes specific transcriptional defects in vivo. Mol Cell Biol. 1995;15:1999–2009. doi: 10.1128/mcb.15.4.1999. [DOI] [PMC free article] [PubMed] [Google Scholar]
- 14.Giaever G, et al. Functional profiling of the Saccharomyces cerevisiae genome. Nature. 2002;418:387–391. doi: 10.1038/nature00935. [DOI] [PubMed] [Google Scholar]
- 15.Struhl K, Stinchcomb DT, Scherer S, Davis RW. High-frequency transformation of yeast: autonomous replication of hybrid DNA molecules. Proc Natl Acad Sci USA. 1979;76:1035–1039. doi: 10.1073/pnas.76.3.1035. [DOI] [PMC free article] [PubMed] [Google Scholar]
- 16.Kupiec M, Petes TD. Allelic and ectopic recombination between Ty elements in yeast. Genetics. 1988;119:549–559. doi: 10.1093/genetics/119.3.549. [DOI] [PMC free article] [PubMed] [Google Scholar]
- 17.Kupiec M, Petes TD. Meiotic recombination between repeated transposable elements in Saccharomyces cerevisiae. Mol Cell Biol. 1988;8:2942–2954. doi: 10.1128/mcb.8.7.2942. [DOI] [PMC free article] [PubMed] [Google Scholar]
- 18.Roeder GS. Unequal crossing-over between yeast transposable elements. Mol Gen Genet. 1983;190:117–121. [Google Scholar]
- 19.Ben-Aroya S, Mieczkowski PA, Petes TD, Kupiec M. The compact chromatin structure of a Ty repeated sequence suppresses recombination hotspot activity in Saccharomyces cerevisiae. Mol Cell. 2004;15:221–231. doi: 10.1016/j.molcel.2004.06.002. [DOI] [PubMed] [Google Scholar]
- 20.Petes TD. Meiotic recombination hot spots and cold spots. Nature Rev Genet. 2001;2:360–369. doi: 10.1038/35072078. [DOI] [PubMed] [Google Scholar]
- 21.Wu X, Haber JEA. 700 bp cis-acting region controls mating-type dependent recombination along the entire left arm of yeast chromosome III. Cell. 1996;87:277–285. doi: 10.1016/s0092-8674(00)81345-8. [DOI] [PubMed] [Google Scholar]
- 22.Ercan S, Reese JC, Workman JL, Simpson RT. Yeast recombination enhancer is stimulated by transcription activation. Mol Cell Biol. 2005;25:7976–7987. doi: 10.1128/MCB.25.18.7976-7987.2005. [DOI] [PMC free article] [PubMed] [Google Scholar]
- 23.Zeyl C. Capturing the adaptive mutation in yeast. Res Microbiol. 2004;155:217–223. doi: 10.1016/j.resmic.2003.12.006. [DOI] [PubMed] [Google Scholar]
- 24.Venter JC, et al. The sequence of the human genome. Science. 2001;291:1304–1351. doi: 10.1126/science.1058040. [DOI] [PubMed] [Google Scholar]
- 25.Lander ES, et al. Initial sequencing and analysis of the human genome. Nature. 2001;409:860–921. doi: 10.1038/35057062. [DOI] [PubMed] [Google Scholar]
- 26.Schwartz DC, Cantor CR. Separation of yeast chromosome-sized DNAs by pulsed field gradient gel electrophoresis. Cell. 1984;37:67–75. doi: 10.1016/0092-8674(84)90301-5. [DOI] [PubMed] [Google Scholar]
Associated Data
This section collects any data citations, data availability statements, or supplementary materials included in this article.