Background: What are the mechanisms regulating compensatory responses to hypoxia in adipocytes?
Results: Induction of hypoxia genes requires HIF-1α and PPARγ in white adipocytes and PGC-1 cofactors in brown adipocytes.
Conclusion: Adipogenic factors and HIF-1α regulate hypoxia responses in adipocytes.
Significance: Results suggest that obese adipose tissue is compromised due to defects in signaling pathways converging on HIF-1α.
Keywords: Adipocyte, Gene Expression, Hypoxia, Hypoxia-inducible Factor (HIF), Peroxisome Proliferator-activated Receptor (PPAR)
Abstract
Obese white adipose tissue is hypoxic but is incapable of inducing compensatory angiogenesis. Brown adipose tissue is highly vascularized, facilitating delivery of nutrients to brown adipocytes for heat production. In this study, we investigated the mechanisms by which white and brown adipocytes respond to hypoxia. Brown adipocytes produced lower amounts of hypoxia-inducible factor 1α (HIF-1α) than white adipocytes in response to low O2 but induced higher levels of hypoxia-associated genes. The response of white adipocytes to hypoxia required HIF-1α, but its presence alone was incapable of inducing target gene expression under normoxic conditions. In addition to the HIF-1α targets, hypoxia also induced many inflammatory genes. Exposure of white adipocytes to a peroxisome proliferator-activated receptor γ (PPARγ) ligand (troglitazone) attenuated induction of these genes but enhanced expression of the HIF-1α targets. Knockdown of PPARγ in mature white adipocytes prevented the usual robust induction of HIF-1α targets in response to hypoxia. Similarly, knockdown of PPARγ coactivator (PGC) 1β in PGC-1α-deficient brown adipocytes eliminated their response to hypoxia. These data demonstrate that the response of white adipocytes requires HIF-1α but also depends on PPARγ in white cells and the PPARγ cofactors PGC-1α and PGC-1β in brown cells.
Introduction
Insulin resistance and the development of type 2 diabetes are linked to an increase in white adiposity, but the mechanisms responsible are not well understood. Expansion of white adipose tissue (WAT)2 during obesity involves both hyperplasia and hypertrophy, leading to an increase in the number and size of individual adipocytes. Recent investigations suggest that obese WAT is hypoxic due to its failure to mount compensatory angiogenesis (1–3). Hypoxic adipocytes secrete inflammatory cytokines such as TNF, IL-6, IL-1 and chemokines such as Ccl2, which attract macrophages, leading to inflammation and local insulin resistance (4, 5). Inflamed adipocytes undergo tremendous stress, resulting in alterations in fuel metabolism, as well as a reduction in the production of beneficial adipokines, including adiponectin and adipsin (6, 7). A reduction in the circulating levels of these factors contributes to systemic insulin resistance and its accompanying comorbidities (8). Another potential contributor to the deterioration of normal WAT function in obese individuals is fibrosis (9, 10). Recent investigations have suggested that enhanced production of fibrotic proteins, including components of a connective tissue extracellular matrix in obese WAT, is due to the accompanying hypoxia, possibly through the major hypoxia-inducible transcription factor, HIF-1α (1). Understanding obesity-associated hypoxia and its stimulated fibrosis as opposed to the needed compensatory angiogenesis and identifying alternative means to induce vascular growth and development in hypoxic adipose tissue will aid in combating insulin resistance and type 2 diabetes.
The response of most cells to hypoxia is to activate a program of gene expression that functions to protect against the ensuing stress and stimulate blood vessel formation to provide an adequate supply of oxygen and nutrients (11). Transcription of this program of genes is regulated by HIFs, which are basic helix-loop-helix/PAS proteins consisting of an oxygen-regulated α-subunit (HIF-1α) and a β-subunit (HIF-1β) (12–14). These factors form heterodimers in response to hypoxia and activate transcription of a diverse group of genes by binding to hypoxia-responsive elements in the promoters/enhancers of the genes. The HIF target genes code for proteins participating in several physiological processes such as angiogenesis (vegfa) and glucose metabolism, which compensate for the deleterious effects of low oxygen (14). Under normoxic conditions in most tissues, HIF-1α is hydroxylated on proline residues by prolyl hydroxylase domain-containing proteins (PHD1–3; also known as Egln2, Egln1, and Egln3, respectively), which facilitate its binding to the pVHL (von Hippel-Lindau protein)-ubiquitin E3 ligase, resulting in its rapid degradation by the proteasome (15). Under hypoxic conditions, hydroxylation does not occur because PHD proteins are inactive due to their high Km for O2. As a result, HIF-1α is stabilized, leading to the formation of transcriptionally active HIF-1α/HIF-1β heterodimers. The activity of PHD proteins requires α-ketoglutarate and oxygen as cosubstrates and ascorbate and ferrous iron as cofactors. Hydroxylation of HIF-1α is therefore responsive to reactive oxygen species, which oxidize the cofactors, and to succinate or fumarate, which competes with α-ketoglutarate for binding to PHD proteins. In fact, the absence of the well established tumor suppressors succinate dehydrogenase and fumarate hydratase has been linked to tumor progression as a result of activation of the HIF pathway and angiogenesis (16, 17). Consequently, effectors that modulate the levels of succinate and/or fumarate have the potential to stimulate a pseudo-hypoxia response consisting of high HIF activity under normoxic conditions. Such effectors could be operating by altering mitochondrial activity that may include stimulation of the electron transport chain or an increase in mitochondrial density (18, 19). PHD proteins are also regulated by HIF-associated transcription of the corresponding genes, which mediate a feedback loop to modulate the hypoxia response by supplying more hydroxylases (20).
Adaptation to low oxygen by adipocytes in obese WAT and brown adipose tissue (BAT) could involve several different effectors and pathways. To gain insight into the response of white and brown adipocytes to hypoxia, we initiated this study to determine the involvement of HIF-1α as well as other factors that might respond to novel effectors. The results show that the response of white adipocytes to low oxygen requires HIF-1α, but its stabilization under normoxic conditions (pseudo-hypoxia) is incapable of inducing target gene expression. Hypoxia induces inflammatory genes as well as the classic HIF-1α targets. Treatment of white adipocytes with troglitazone attenuates inflammatory gene expression but enhances expression of the HIF-1α targets in response to low O2. These responses to hypoxia require peroxisome proliferator-activated receptor γ (PPARγ) in white adipocytes and the PPARγ coactivators PGC-1α and PGC-1β in brown adipocytes.
EXPERIMENTAL PROCEDURES
Materials
Specific reagents were purchased as indicated: dexamethasone, 3-isobutyl-1-methylxanthine, insulin, CoCl2, troglitazone, indomethacin, and triiodothyronine from Sigma-Aldrich; Halt protease inhibitor mixture from Thermo Scientific; DMEM from Mediatech, Inc. (Herndon, VA); FBS from Gemini Bio Products (West Sacramento, CA); and calf serum from Invitrogen. The HIF-1α inhibitor YC-1 was obtained from Cayman Chemical Co. (Ann Arbor, MI).
Cell Lines and Cell Culture
Murine 3T3-L1 preadipocytes and Swiss 3T3 fibroblasts ectopically expressing PPARγ were cultured and maintained in DMEM supplemented with 10% calf serum. Differentiation was induced by exposure of 2-day post-confluent cells to DMEM containing 10% FBS, 1 μm dexamethasone, 0.5 mm 3-isobutyl-1-methylxanthine, and 1.67 μm insulin. After 48 h, the medium was changed every 2 days to DMEM containing only 10% FBS. Primary brown preadipocytes isolated from newborn wild-type and PGC-1α knock-out mice, immortalized via pBABE-SV40T antigen, were a kind gift from Dr. Bruce Spiegelman and were described previously (21). Differentiation of brown preadipocytes was induced by treatment of confluent cells with medium containing 10% FBS, 0.5 mm 3-isobutyl-1-methylxanthine, 125 nm indomethacin, 1 μm dexamethasone, 850 nm insulin, and 1 nm triiodothyronine (T3). After 48 h, cells were incubated in medium containing 10% FBS, 850 nm insulin, and 1 nm triiodothyronine. For cells differentiated in the presence of the PPARγ agonist, 5 μm troglitazone was added to the medium from day 2 of differentiation until harvest on days 8–10.
Cell Extracts and Western Blot Analysis of Proteins
Total and nuclear proteins of cultured cells were extracted into radioimmune precipitation assay buffer (50 mm Tris, 150 mm NaCl, 0.1% SDS, 0.5% sodium deoxycholate, 1% Nonidet P-40, 1 mm PMSF, 50 μm leupeptin, and 5 μm aprotinin). After the protein content was quantified using a BCA kit (Pierce), 40 μg of protein from the supernatant of each sample was separated by SDS-PAGE and then transferred to a PVDF membrane (PerkinElmer Life Sciences). Following transfer, membranes were blocked in 5% nonfat dry milk in PBS and 0.1% Tween 20 and probed with primary antibodies. Horseradish peroxidase-conjugated secondary antibodies (Sigma) and an ECL substrate kit (PerkinElmer Life Sciences) were used in the detection of Western signals. Fractionation of cells into nuclear and cytoplasmic compartments and preparation of the corresponding extracts were performed using an NE-PER nuclear protein extraction kit (Thermo Fisher Scientific) as recommended by the manufacturer. The antibodies employed in the analysis were as follows: anti-CCAAT/enhancer-binding protein α (Santa Cruz Biotechnology, Inc.), anti-Acrp30/adiponectin (Affinity BioReagents, Golden, CO), anti-aP2 and anti-PPARγ (Cell Signaling Technology, Inc.), and anti-HIF-1α (Novus Biologicals, LLC, Littleton, CO; Abcam, Cambridge, MA).
Microarray Gene Chips
The preparation of samples and the procedure for microarray analysis have been described previously (22).
Gene Expression Analysis
RNA was isolated from cultured cells using TRIzol reagent (Invitrogen) as instructed by the manufacturer. cDNA from cultured cells was produced from equivalent amounts of total RNA (2 μg) using a high-capacity cDNA reverse transcription kit (Applied Biosystems) according to the manufacturer's instructions. Analysis of gene expression was performed using Maxima SYBR Green qPCR Master Mix (Fermentas Inc., Glen Burnie, MD) in an ABI Prism 7300 sequence detector for an initial denaturation at 95 °C for 10 min, followed by 40 PCR cycles (with each cycle consisting of 95 °C for 15 s, 60 °C for 20 s, and 72 °C for 30 s), and SYBR green fluorescence emissions were monitored after each cycle. mRNA expression was calculated relative to TATA-binding protein for murine samples. Amplification of specific transcripts was confirmed by melting-curve profiles (cooling the sample to 68 °C and heating slowly to 95 °C with measurement of fluorescence) at the end of each PCR.3
Knockdown of HIF-1α and PPARγ Using siRNA
siRNA duplexes for mouse HIF-1α and PPARγ were obtained from Integrated DNA Technologies, Inc. (Coralville, IA). Transfection of siRNAs was achieved by using a DeliverX Plus delivery kit (Affymetrix, Inc./Panomics, Santa Clara, CA) according to the manufacturer's instructions specific to 3T3-L1 adipocytes. Briefly, on days 6–8 of differentiation, 3T3-L1 adipocytes cells were trypsinized and replated at 50–70% confluence 18 h prior to transfection. 48–72 h post-transfection, cells were harvested for isolation of protein for Western blot analysis or for isolation of RNA for gene expression analysis.
Statistical Analyses
Data are expressed as means ± S.D. from three independent experiments, which were performed in duplicate. Data were analyzed using Student's t test, and statistically significant differences are reported when p was <0.05.
RESULTS
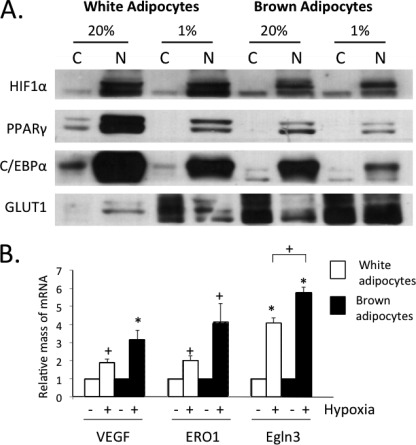
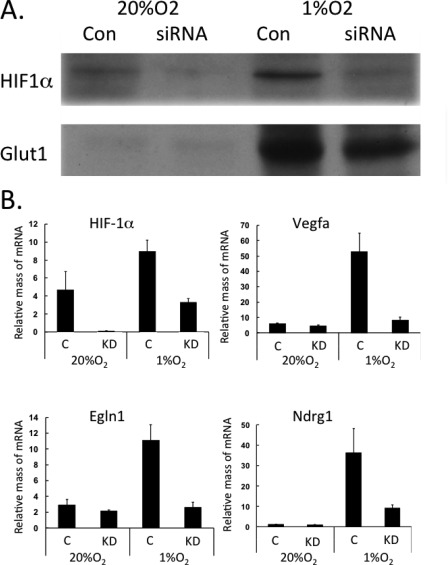
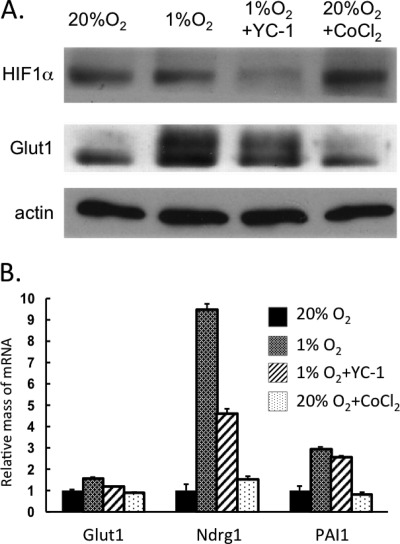
Other studies have shown that overexpression of HIF-1α in WAT induces fibrosis instead of its usual targets such as the compensatory angiogenesis factor vegfa. Because of the fact that BAT is highly vascularized compared with avascular WAT, we hypothesized that brown adipocytes might respond more favorably to hypoxia than white cells by stimulating production of greater quantities of HIF-1α. However, Fig. 1A demonstrates a slightly lower amount of HIF-1α in brown versus white adipocytes. Interestingly, there was only a slight increase in the abundance of nuclear localized HIF-1α in response to hypoxia in both white and brown adipocytes. The dramatic increase in GLUT1, an HIF-1α target, in the cytoplasm of the white cells indicates that they responded to the low O2. Normoxic brown adipocytes already expressed abundant amounts of GLUT1 that were equivalent to those levels expressed in hypoxic white adipocytes. There was some GLUT1 detected in the nuclear fraction of brown adipocytes, which is accounted for by some contamination from the cytoplasmic fraction (data not shown). The data in Fig. 1B demonstrate that both cells responded to hypoxia by inducing expression of known HIF-1α targets, including vegfa, Ero1a, and Egln3. The small increase in HIF-1α levels in hypoxic white and brown adipocytes suggests that induction of hypoxia genes might require nuclear factors in addition to HIF-1α. To determine the importance of HIF-1α, its expression was knocked down in mature white adipocytes using an appropriate siRNA. Fig. 2A demonstrates the effectiveness of the knockdown, resulting in an ∼70% decrease in HIF-1α levels and leading to a significantly reduced induction of GLUT1 by exposure to 1% O2. The quantitative PCR analysis shown in Fig. 2B demonstrates that the knockdown also attenuated the hypoxic induction of vegfa, Egln1, and Ndrg1 mRNAs. To gain additional insight into the importance of HIF-1α, white adipocytes were treated with YC-1 (an HIF-1α inhibitor) during their exposure to hypoxia or with CoCl2 (an HIF-1α mimetic) under normoxic conditions. The data show that the hypoxic response was similarly attenuated by reduction of HIF-1α using YC-1 (Fig. 3). Interestingly, treatment of normoxic cells with CoCl2 failed to enhance the expression of GLUT1 protein and the HIF-1α target genes (Fig. 3). These data suggest that HIF-1α does facilitate the induction of its target genes in white adipocytes but likely requires additional factors that are activated only under hypoxic conditions.
FIGURE 1.
In response to hypoxia, brown adipocytes produce lower amounts of HIF-1α than white adipocytes but induce higher levels of hypoxia-associated genes. 3T3-L1 and brown preadipocytes were differentiated until day 7, at which stage cells were exposed to 20% or 1% O2 for 18 h. A, nuclear (N) and cytoplasmic (C) cell fractions were prepared, and extracts were subjected to Western blot analysis. B, cells were also harvested for RNA isolation and quantitative real-time PCR analysis. Results are means ± S.E. (n = 3). *, p < 0.01; +, p < 0.05. C/EBPα, CCAAT/enhancer-binding protein α.
FIGURE 2.
Response of white adipocytes to hypoxia requires HIF-1α. 3T3-L1 preadipocytes were differentiated until day 8, at which time cells were exposed to DeliverX siRNA reagent alone (C, Con) or with oligonucleotides specific to HIF-1α (KD). 48 h later, cells were exposed to 20% or 1% O2 for 18 h. The cells were immediately harvested in lysis buffer for protein isolation and Western blot analysis (A) or in TRIzol reagent for RNA isolation and quantitative real-time PCR analysis (B). Results are means ± S.E. (n = 3).
FIGURE 3.
HIF-1α alone is incapable of inducing its target genes without accompanying exposure to hypoxia. 3T3-L1 preadipocytes were differentiated until day 8, and then cells were exposed to 20% or 1% O2 for 18 h. Some cells were also exposed to 200 μm YC-1 under hypoxia for 18 h or to 200 μm CoCl2 under normoxia for 6 h. The cells were immediately harvested for protein isolation and Western blot analysis (A) or for RNA isolation and quantitative real-time PCR analysis (B). Results are means ± S.E. (n = 3).
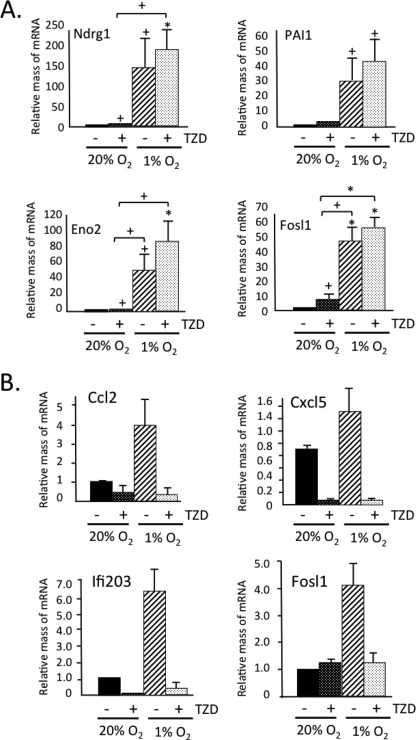
We have recently shown that activation of PPARγ with synthetic ligands in white adipocytes in mice and in culture induces expression of a brown adipose phenotype. This is characterized by an increase in mitochondrial biogenesis and function as well as suppression of several genes coding for adipokines associated with insulin resistance, which are highly expressed in visceral WAT (22, 23). Importantly, the troglitazone-associated “browning” of white adipocytes also included a 2–5-fold enhancement in expression of many HIF-1α targets (Table 1) as well as suppression of many inflammatory genes (see below). We therefore questioned whether PPARγ could be contributing to the hypoxic response in white adipocytes. Fig. 4A demonstrates that induction of the HIF-1α targets by troglitazone (TZD) was modest compared with their dramatic induction by hypoxia; however, TZD did appear to enhance the hypoxic response. It is interesting that TZD prevented the induction of inflammatory genes in response to hypoxia (Fig. 4B).
TABLE 1.
List of genes induced by exposure of adipocytes to troglitazone
Swiss mouse fibroblasts ectopically expressing PPARγ were differentiated until day 10 with and without 5 μm TZD and then immediately harvested in TRIzol for RNA isolation and Affymetrix microarray analysis.
| Gene symbol | TZD vs. control | Gene name |
|---|---|---|
| Chchd10 | 18.77 | Coiled coil-helix-coiled coil-helix domain 10 |
| Pdk4 | 12.01 | Pyruvate dehydrogenase kinase, isoenzyme 4 |
| Fgf21 | 11.64 | Fibroblast growth factor 21 |
| PAI1 | 4.82 | Plasminogen activator 1 |
| Cox7a1 | 4.58 | Cytochrome oxidase c subunit 7a1 |
| Acot2 | 4.50 | Acyl-CoA thioesterase 2 |
| Acot1 | 4.36 | Acyl-CoA thioesterase 1 |
| Egln3 (PHD3) | 4.20 | HIF prolyl hydroxylase 3 |
| Ero1l | 3.54 | ERO1-like (Saccharomyces cerevisiae) |
| Ndrg1 | 3.46 | N-myc downstream regulated gene 1 |
| Trib3 | 3.40 | Tribbles homolog 3 (Drosophila) |
| GLUT1 | 3.09 | Glucose transporter 1 |
| Scd3 | 2.94 | Stearoyl-CoA desaturase 3 |
| Ghrh | 2.64 | Growth hormone-releasing hormone |
| Angptl4 | 2.60 | Angiopoietin-like 4 |
| Itm2a | 2.53 | Integral membrane protein 2A |
| Angptl6 | 2.40 | Angiopoietin-like 6 |
| Ddit3 | 2.16 | DNA damage-inducible transcript 3 |
| Hmox1 | 1.67 | Heme oxygenase (decycling) 1 |
| vegfa | 1.50 | Vascular endothelial growth factor A |
FIGURE 4.
TZD suppresses hypoxia-associated induction of inflammatory genes and enhances expression of HIF-1α targets. 3T3-L1 preadipocytes were differentiated until day 8 with either 5 μm TZD or Me2SO vehicle added to the medium. On day 8, cells were exposed to 20% or 1% O2 for 18 h. The cells were immediately harvested in TRIzol reagent for RNA isolation and quantitative real-time PCR analysis for HIF-1 targets (A) or inflammatory genes (B). Results are means ± S.E. (n = 3). *, p = < 0.01; +, p < 0.05.
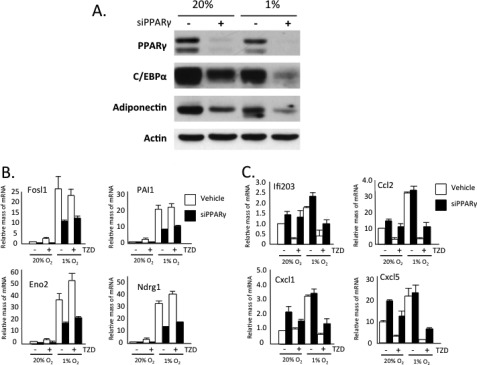
These data show that TZD activation of PPARγ has both a positive and negative effect on the response of white adipocytes to hypoxia. To determine whether PPARγ plays a critical role in these responses, we diminished its expression in mature 3T3-L1 adipocytes using siRNA technology. Fig. 5A shows an almost complete knockdown of PPARγ along with an accompanying reduction in CCAAT/enhancer-binding protein α and adiponectin expression. Exposure of control cells to 1% O2 for 18 h induced expression of select HIF-1α targets (Fosl1, PAI1, Eno2, and Ndrg1) (Fig. 5B) and attenuated expression of CCAAT/enhancer-binding protein α and adiponectin (Fig. 5A) as demonstrated previously by others (6). More importantly, the extent of induction of the HIF-1α target genes by hypoxia as well as by TZD was significantly blunted in the absence of PPARγ (Fig. 5B). In the case of the inflammatory genes, the absence of PPARγ had a minimal effect on their expression in response to hypoxia, but it did significantly reduce their suppression by TZD (Fig. 5C).
FIGURE 5.
PPARγ deficiency attenuates induction of hypoxia-responsive genes while increasing expression of inflammatory genes in mature hypoxic adipocytes. 3T3-L1 preadipocytes were differentiated until day 4, and then either 5 μm TZD or Me2SO vehicle was added to the medium until day 10. On day 8, cells were exposed to DeliverX siRNA reagent alone or with oligonucleotides specific to PPARγ. On day 9, cells were exposed to 20% or 1% O2 for 18 h. The cells were immediately harvested in lysis buffer for protein isolation and Western blot analysis (A) or in TRIzol reagent for RNA isolation and quantitative real-time PCR analysis (B and C). Results are means ± S.E. (n = 3). siPPARγ, PPARγ siRNA.
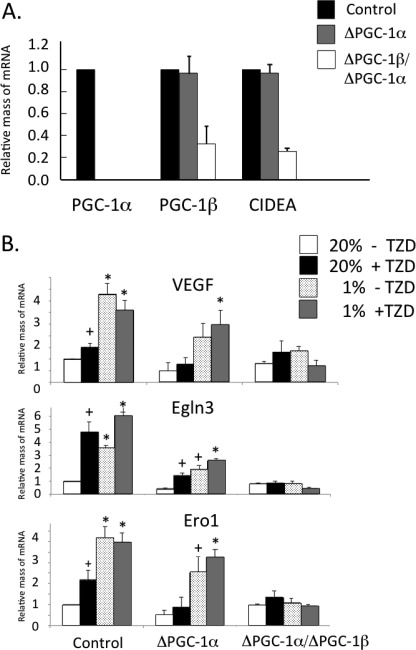
In addition to promoting the browning of white adipocytes, including enhanced production of many HIF-1α target genes, activation of PPARγ by TZD induces expression of PGC-1β (24). Other studies have shown that PGC-1α facilitates induction of vegfa and compensatory angiogenesis in ischemic skeletal muscle in an HIF-1α-independent manner (25). To begin to dissect the molecular mechanisms controlling the responses of adipocytes to hypoxia, we questioned whether PGC-1α and/or PGC-1β collaborate with PPARγ in regulating hypoxia-associated gene expression. We chose to address this question in brown adipocytes because they express both forms of the PGCs. Data of others demonstrated that PGC-1α is dispensable for maintenance of the brown phenotype but is required for cold-induced thermogenesis (21). Importantly, loss of brown-specific gene expression occurred only following knockdown of PGC-1β along with PGC-1α (Fig. 6A). These data highlight the importance of PGC-1β in regulating the brown adipocyte program. When exposed to 1% O2 for 18 h, control brown adipocytes responded by significantly enhancing expression of vegfa, Egln3, and Ero1 (Fig. 6B). The response of PGC-1α-deficient cells, however, was blunted by ∼50% compared with control cells, whereas cells deficient for both PGC-1 cofactors were incapable of responding to hypoxia (Fig. 6B). These data suggest that PGC-1 cofactors facilitate expression of hypoxia-responsive genes in brown adipocytes as well as skeletal muscle cells as observed by others (21). We also tested whether the synthetic PPARγ agonist TZD impacts hypoxia gene expression via PGC-1α or PGC-1β. Interestingly, exposure of control cells to the thiazolidinedione (TZD) enhanced expression of the HIF-1α targets by ∼2–5-fold compared with untreated cells (Fig. 6B). As observed for the response of these genes to hypoxia, their induction by TZD was blunted in the absence of PGC-1α and completely eliminated when both PGC-1 factors were eliminated. These data suggest that the PGC-1 cofactors are mediators of the action of PPARγ in regulating expression of hypoxia genes in brown adipocytes.
FIGURE 6.
PGC-1 cofactors facilitate expression of hypoxia-responsive genes in brown adipocytes. WT, PGC-1α knock-out (α-KO), and PGC-1α knock-out/PGC-1β knockdown (α/β-KO) brown preadipocytes were differentiated until harvesting on day 8, at which stage total RNA was isolated using TRIzol reagent and analyzed by quantitative real-time PCR analysis (A). Results are means ± S.E. (n = 3). WT, PGC-1α knock-out (ΔPGC-1α), and PGC-1α knock-out/PGC-1β knockdown (ΔPGC-1α/PGC-1β) brown preadipocytes were differentiated until day 7, at which stage cells were exposed to 20% or 1% O2 for 18 h. The cells were immediately harvested for RNA isolation and quantitative real-time PCR analysis (B). Results are means ± S.E. (n = 3). *, p < 0.01; +, p < 0.05. CIDEA, cell death-inducing DFFA-like effector A.
DISCUSSION
Obese WAT is susceptible to hypoxia, whereas BAT is less likely to become hypoxic due to its high vascular density. Recent studies have suggested that white adipocytes respond poorly to hypoxia due to their inability to activate HIF-1α-associated compensatory angiogenesis (1, 2). The data presented here demonstrate that white and brown adipocytes have a limited ability to induce HIF-1α in response to hypoxia, but white cells require HIF-1α to maximally respond to hypoxia. It appears though that HIF-1α alone is not sufficient because its induction under normoxic conditions (+CoCl2) is incapable of inducing its target genes. These data suggest that additional factors activated by low O2 cooperate with HIF-1α to facilitate the full response in white and brown adipocytes. In the case of white adipocytes, activation of PPARγ by TZD induced expression of HIF-1α target genes and suppressed inflammatory genes that were also induced by 1% O2. Knockdown of PPARγ in 3T3-L1 white adipocytes demonstrated that induction of hypoxia genes was significantly attenuated in the absence of PPARγ, whereas induction of inflammatory genes was unaffected. Interestingly, previous studies by others demonstrated that induction of vegfa and angiogenesis in skeletal muscle and brown adipocytes by hypoxia is mediated by PGC-1α via an HIF-1α-independent mechanism (25). Our data show that the induction of multiple hypoxia-responsive genes requires PGC-1α and PGC-1β in brown adipocytes. These data suggest a role for PPARγ and PGCs in regulating the response of white and brown adipocytes to hypoxia, respectively.
As discussed previously, obese WAT is hypoxic and responds by enhancing expression of fibrotic proteins as opposed to classic hypoxia-associated proteins, including those that regulate compensatory angiogenesis. In fact, fibrosis is a newly appreciated hallmark of the pathological alteration of human adipose tissue to obesity (10). Scherer and coworkers (1) have shown that transgenic expression of HIF-1α in adipose tissue leads to an extensive induction of known fibrotic genes. These investigators proposed that development of fibrosis due to hypoxia activation of HIF-1α in white adipose might precede progression to an insulin-resistant state (26). The data presented here are consistent with the suggestion that HIF-1α is not the only mechanism by which adipocytes respond to low oxygen and that PPARγ and PGC-1 cofactors are also required presumably to facilitate expression of the hypoxia-associated genes. Studies by Spiegelman and coworkers (25) showed that the angiogenic response to limb ischemia is mediated through a novel PGC-1α/estrogen-related receptor pathway independent of the HIF-1α pathway. Their study focused primarily on the induction of vegfa and angiogenesis in skeletal muscle and not on most of the other hypoxia-responsive genes. We show here that the PGC-1 cofactors are required for induction of a wide range of HIF-1α target proteins that function to regulate different compensatory processes to counteract the stress of hypoxia. The fact that some of these proteins are induced during the TZD-mediated browning of WAT (Table 1) and are regulated by PGC-1α suggests that they may contribute to the function of the brown adipocytes under normoxia. This possibility might explain why BAT is more highly vascularized than WAT. Interestingly, O'Hagan et al. (27) demonstrated that overexpression of PGC-1α in skeletal muscle cells induces expression of a cohort of HIF-1 target genes under normoxic conditions through a mechanism involving stabilization of HIF-1α. These authors suggested that PGC-1α activity causes intracellular hypoxia due to elevated oxygen consumption resulting from PGC-1α-associated mitochondrial biogenesis. It is conceivable that in brown adipocytes, PGC-1α/PGC-1β, in addition to maintaining expression of brown-specific functions, including mitochondrial biogenesis, also facilitates the observed stabilization of HIF-1α under normoxic conditions (Fig. 1). Consequently, metabolically active brown adipocytes under normoxia might express some hypoxia-associated proteins that contribute to the brown phenotype, including blood vessel formation. It is possible that such a response is similar to that reported by Arany et al. (25), whereby PGC-1α regulates expression of select HIF-1α targets, independently of HIF-1α. It is also likely that HIF-1α is required for induction of the entire program of hypoxia-responsive genes in skeletal muscle and that the PGC-1α/estrogen-related receptor pathway is unique to vegfa and other angiogenic regulators. A recent study demonstrated that PGC-1α regulates Sirt3 expression by coactivating estrogen-related receptor α bound to a corresponding response element in the promoter of the Sirt3 gene (28). The fact that Sirt3 can influence the response of cancer cells to hypoxia (18, 19) suggests another potential link between PGCs and hypoxia-responsive gene expression. It is relevant to mention that exposure of mice to cold induced a browning of WAT as revealed by induction of UCP-1 and PGC-1α but also activated angiogenesis along with vegfa expression in a hypoxia-independent manner (29). These data are therefore consistent with the notion that activation of the PGCs can induce angiogenesis under normoxic conditions, and this property might be a hallmark of the brown adipocyte phenotype.
In the case of white adipocytes, the fact that TZD induces expression of multiple HIF-1α targets suggests that PPARγ and HIF-1α pathways converge on each other. One possibility is that PPARγ directly activates the hypoxia target genes by interacting with factors bound to regulatory elements within the corresponding promoter/enhancer regions. In fact, the data suggest the involvement of additional factors that are induced by hypoxia because the extent of induction of these genes by TZD alone is significantly lower than that by low oxygen (Figs. 5B and 6B). We propose that the adipocyte senses low oxygen and activates a signaling pathway that converges on PPARγ and other associated nuclear factors to induce the entire program of hypoxia genes.
The inability of obese WAT to respond to hypoxia by inducing a set of compensatory processes might be due to the fact that HIF-1α requires PPARγ and the PGC-1 cofactors for its full activity. It is known that expansion of WAT causes infiltration of macrophages and local secretion of inflammatory cytokines, which attenuate PPARγ activity on select target genes (30). Such a stress-induced decline in PPARγ activity could redirect HIF-1α to regulate gene programs such as those coding for components of the extracellular matrix that have the potential to cause fibrosis. BAT might be protected from hypoxia-associated fibrosis because of a significantly lower level of cytokine-induced stress and consequently high levels of PPARγ activity. Clearly, additional investigations into the role of hypoxia-associated factors and adipogenic nuclear factors in regulating gene expression in hypoxic adipose tissue will provide important information concerning the development of insulin resistance in obese individuals.
Acknowledgment
We thank Dr. Bruce Spiegelman (Dana-Farber Cancer Institute and Harvard Medical School) for the kind gift of PGC-1α- and PGC-1α/PGC-1β-deficient brown preadipocytes.
This work was supported by United States Public Health Service Grants DK51586, DK58825, and DK086629 (to S. R. F.) and National Institutes of Health Training Grant 5T32AG000115-24 (to E. P.).
Primer sequences used for quantitative PCR are available upon request.
- WAT
- white adipose tissue
- HIF
- hypoxia-inducible factor
- BAT
- brown adipose tissue
- PPARγ
- peroxisome proliferator-activated receptor γ
- PGC
- PPARγ coactivator
- TZD
- troglitazone.
REFERENCES
- 1. Halberg N., Khan T., Trujillo M. E., Wernstedt-Asterholm I., Attie A. D., Sherwani S., Wang Z. V., Landskroner-Eiger S., Dineen S., Magalang U. J., Brekken R. A., Scherer P. E. (2009) Hypoxia-inducible factor 1α induces fibrosis and insulin resistance in white adipose tissue. Mol. Cell. Biol. 29, 4467–4483 [DOI] [PMC free article] [PubMed] [Google Scholar]
- 2. Pasarica M., Sereda O. R., Redman L. M., Albarado D. C., Hymel D. T., Roan L. E., Rood J. C., Burk D. H., Smith S. R. (2009) Reduced adipose tissue oxygenation in human obesity: evidence for rarefaction, macrophage chemotaxis, and inflammation without an angiogenic response. Diabetes 58, 718–725 [DOI] [PMC free article] [PubMed] [Google Scholar]
- 3. Pasarica M., Rood J., Ravussin E., Schwarz J. M., Smith S. R., Redman L. M. (2010) Reduced oxygenation in human obese adipose tissue is associated with impaired insulin suppression of lipolysis. J. Clin. Endocrinol. Metab. 95, 4052–4055 [DOI] [PMC free article] [PubMed] [Google Scholar]
- 4. Trayhurn P., Wang B., Wood I. S. (2008) Hypoxia in adipose tissue: a basis for the dysregulation of tissue function in obesity? Br J. Nutr. 100, 227–235 [DOI] [PubMed] [Google Scholar]
- 5. Wood I. S., de Heredia F. P., Wang B., Trayhurn P. (2009) Cellular hypoxia and adipose tissue dysfunction in obesity. Proc. Nutr. Soc. 68, 370–377 [DOI] [PubMed] [Google Scholar]
- 6. Ye J., Gao Z., Yin J., He Q. (2007) Hypoxia is a potential risk factor for chronic inflammation and adiponectin reduction in adipose tissue of ob/ob and dietary obese mice. Am. J. Physiol. Endocrinol. Metab. 293, E1118–E1128 [DOI] [PubMed] [Google Scholar]
- 7. Ouchi N., Parker J. L., Lugus J. J., Walsh K. (2011) Adipokines in inflammation and metabolic disease. Nat. Rev. Immunol. 11, 85–97 [DOI] [PMC free article] [PubMed] [Google Scholar]
- 8. Trujillo M. E., Scherer P. E. (2006) Adipose tissue-derived factors: impact on health and disease. Endocr. Rev. 27, 762–778 [DOI] [PubMed] [Google Scholar]
- 9. Divoux A., Clément K. (2011) Architecture and the extracellular matrix: the still unappreciated components of the adipose tissue. Obes. Rev. 12, e494–e503 [DOI] [PubMed] [Google Scholar]
- 10. Divoux A., Tordjman J., Lacasa D., Veyrie N., Hugol D., Aissat A., Basdevant A., Guerre-Millo M., Poitou C., Zucker J. D., Bedossa P., Clément K. (2010) Fibrosis in human adipose tissue: composition, distribution, and link with lipid metabolism and fat mass loss. Diabetes 59, 2817–2825 [DOI] [PMC free article] [PubMed] [Google Scholar]
- 11. Semenza G. L. (2007) Life with oxygen. Science 318, 62–64 [DOI] [PubMed] [Google Scholar]
- 12. Maxwell P. H. (2005) Hypoxia-inducible factor as a physiological regulator. Exp. Physiol. 90, 791–797 [DOI] [PubMed] [Google Scholar]
- 13. Semenza G. L. (2001) HIF-1, O2, and the 3 PHDs: how animal cells signal hypoxia to the nucleus. Cell 107, 1–3 [DOI] [PubMed] [Google Scholar]
- 14. Semenza G. L. (2007) Hypoxia-inducible factor 1 (HIF-1) pathway. Sci. STKE 2007, cm8. [DOI] [PubMed] [Google Scholar]
- 15. Boulahbel H., Duran R. V., Gottlieb E. (2009) Prolyl hydroxylases as regulators of cell metabolism. Biochem. Soc. Trans. 37, 291–294 [DOI] [PubMed] [Google Scholar]
- 16. King A., Selak M. A., Gottlieb E. (2006) Succinate dehydrogenase and fumarate hydratase: linking mitochondrial dysfunction and cancer. Oncogene 25, 4675–4682 [DOI] [PubMed] [Google Scholar]
- 17. Selak M. A., Armour S. M., MacKenzie E. D., Boulahbel H., Watson D. G., Mansfield K. D., Pan Y., Simon M. C., Thompson C. B., Gottlieb E. (2005) Succinate links TCA cycle dysfunction to oncogenesis by inhibiting HIF-α prolyl hydroxylase. Cancer Cell 7, 77–85 [DOI] [PubMed] [Google Scholar]
- 18. Finley L. W., Carracedo A., Lee J., Souza A., Egia A., Zhang J., Teruya-Feldstein J., Moreira P. I., Cardoso S. M., Clish C. B., Pandolfi P. P., Haigis M. C. (2011) SIRT3 opposes reprogramming of cancer cell metabolism through HIF-1α destabilization. Cancer Cell 19, 416–428 [DOI] [PMC free article] [PubMed] [Google Scholar]
- 19. Bell E. L., Emerling B. M., Ricoult S. J., Guarente L. (2011) SirT3 suppresses hypoxia-inducible factor 1α and tumor growth by inhibiting mitochondrial ROS production. Oncogene 30, 2986–2996 [DOI] [PMC free article] [PubMed] [Google Scholar]
- 20. Marxsen J. H., Stengel P., Doege K., Heikkinen P., Jokilehto T., Wagner T., Jelkmann W., Jaakkola P., Metzen E. (2004) Hypoxia-inducible factor 1 (HIF-1) promotes its degradation by induction of HIF-α prolyl-4-hydroxylases. Biochem. J. 381, 761–767 [DOI] [PMC free article] [PubMed] [Google Scholar]
- 21. Uldry M., Yang W., St-Pierre J., Lin J., Seale P., Spiegelman B. M. (2006) Complementary action of the PGC-1 coactivators in mitochondrial biogenesis and brown fat differentiation. Cell Metab. 3, 333–341 [DOI] [PubMed] [Google Scholar]
- 22. Wang H., Qiang L., Farmer S. R. (2008) Identification of a domain within peroxisome proliferator-activated receptor γ regulating expression of a group of genes containing fibroblast growth factor 21 that are selectively repressed by SIRT1 in adipocytes. Mol. Cell. Biol. 28, 188–200 [DOI] [PMC free article] [PubMed] [Google Scholar]
- 23. Vernochet C., Peres S. B., Davis K. E., McDonald M. E., Qiang L., Wang H., Scherer P. E., Farmer S. R. (2009) C/EBPα and the corepressors CtBP1 and CtBP2 regulate repression of select visceral white adipose genes during induction of the brown phenotype in white adipocytes by peroxisome proliferator-activated receptor γ agonists. Mol. Cell. Biol. 29, 4714–4728 [DOI] [PMC free article] [PubMed] [Google Scholar]
- 24. Deng T., Sieglaff D. H., Zhang A., Lyon C. J., Ayers S. D., Cvoro A., Gupte A. A., Xia X., Baxter J. D., Webb P., Hsueh W. A. (2011) A peroxisome proliferator-activated receptor γ (PPARγ)/PPARγ coactivator 1β autoregulatory loop in adipocyte mitochondrial function. J. Biol. Chem. 286, 30723–30731 [DOI] [PMC free article] [PubMed] [Google Scholar]
- 25. Arany Z., Foo S. Y., Ma Y., Ruas J. L., Bommi-Reddy A., Girnun G., Cooper M., Laznik D., Chinsomboon J., Rangwala S. M., Baek K. H., Rosenzweig A., Spiegelman B. M. (2008) HIF-independent regulation of VEGF and angiogenesis by the transcriptional coactivator PGC-1α. Nature 451, 1008–1012 [DOI] [PubMed] [Google Scholar]
- 26. Rutkowski J. M., Davis K. E., Scherer P. E. (2009) Mechanisms of obesity and related pathologies: the macro- and microcirculation of adipose tissue. FEBS J. 276, 5738–5746 [DOI] [PMC free article] [PubMed] [Google Scholar]
- 27. O'Hagan K. A., Cocchiglia S., Zhdanov A. V., Tambawala M. M., Cummins E. P., Monfared M., Agbor T. A., Garvey J. F., Papkovsky D. B., Taylor C. T., Allan B. B. (2009) PGC-1α is coupled to HIF-1α-dependent gene expression by increasing mitochondrial oxygen consumption in skeletal muscle cells. Proc. Natl. Acad. Sci. U.S.A. 106, 2188–2193 [DOI] [PMC free article] [PubMed] [Google Scholar]
- 28. Giralt A., Hondares E., Villena J. A., Ribas F., Díaz-Delfín J., Giralt M., Iglesias R., Villarroya F. (2011) Peroxisome proliferator-activated receptor γ coactivator 1α controls transcription of the Sirt3 gene, an essential component of the thermogenic brown adipocyte phenotype. J. Biol. Chem. 286, 16958–16966 [DOI] [PMC free article] [PubMed] [Google Scholar]
- 29. Xue Y., Petrovic N., Cao R., Larsson O., Lim S., Chen S., Feldmann H. M., Liang Z., Zhu Z., Nedergaard J., Cannon B., Cao Y. (2009) Hypoxia-independent angiogenesis in adipose tissues during cold acclimation. Cell Metab. 9, 99–109 [DOI] [PubMed] [Google Scholar]
- 30. Choi J. H., Banks A. S., Estall J. L., Kajimura S., Boström P., Laznik D., Ruas J. L., Chalmers M. J., Kamenecka T. M., Blüher M., Griffin P. R., Spiegelman B. M. (2010) Anti-diabetic drugs inhibit obesity-linked phosphorylation of PPARγ by Cdk5. Nature 466, 451–456 [DOI] [PMC free article] [PubMed] [Google Scholar]


