

Background: Nicotinamide treatment decreases mitochondrial content and helps cells maintain high mitochondrial quality.
Results: Metabolically enhanced NAD+/NADH ratio and chemically induced SIRT1 activation similarly decreased mitochondrial content, increased autophagy, and induced mitochondrial fragmentation.
Conclusion: Mitochondrial content is modulated by high NAD+/NADH ratio and mechanisms that involve SIRT1 activation.
Significance: Elevation of NAD+/NADH ratio may promote cellular health by facilitating mitochondrial autophagy.
Keywords: Autophagy, Mitochondria, NAD, Nicotinamide, Sirt1, Asparagine
Abstract
Active autophagy coupled with rapid mitochondrial fusion and fission constitutes an important mitochondrial quality control mechanism and is critical to cellular health. In our previous studies, we found that exposure of cells to nicotinamide causes a decrease in mitochondrial content and an increase in mitochondrial membrane potential (MMP) by activating autophagy and inducing mitochondrial fragmentation. Here, we present evidence to show that the effect of nicotinamide is mediated through an increase of the [NAD+]/[NADH] ratio and the activation of SIRT1, an NAD+-dependent deacetylase that plays a role in autophagy flux. The [NAD+]/[NADH] ratio was inversely correlated with the mitochondrial content, and an increase in the ratio by the mobilization of the malate-aspartate shuttle resulted in autophagy activation and mitochondrial transformation from lengthy filaments to short dots. Furthermore, treatment of cells with SIRT1 activators, fisetin or SRT1720, induced similar changes in the mitochondrial content. Importantly, the activators induced mitochondrial fragmentation only when SIRT1 expression was intact. Meanwhile, MMP did not increase when the cells were treated with the activators, suggesting that the change in MMP is not induced by the mitochondrial turnover per se and that elevation of the [NAD+]/[NADH] ratio may activate additional mechanisms that cause MMP augmentation. Together, our results indicate that a metabolic state resulting in an elevated [NAD+]/[NADH] ratio can modulate mitochondrial quantity and quality via pathways that may include SIRT1-mediated mitochondrial autophagy.
Introduction
Cells from aging tissues and late passage cultures exhibit abnormalities in mitochondrial electron transport chain (ETC)3 such as cytochrome c oxidase negativity and mtDNA mutations (1). Defective ETCs produce large amounts of reactive oxygen species (ROS) and thereby play a major role in the induction of cellular senescence and possibly tissue aging and are strongly associated with various aging-associated degenerative diseases and cancers as well (2, 3). For this reason, maintenance of mitochondria quality is of utmost importance to body health and longevity (4). Mitochondrial quality control is mediated largely by the removal of dysfunctional parts of mitochondria and biogenesis of new parts of mitochondria. However, during senescence and aging, the removal of damaged mitochondria is attenuated, resulting in an increase of mitochondrial mass and cellular mitochondrial content (5, 6). Autophagy is the major cellular mechanism removing organelles, including mitochondria, and along with coordinated mitochondrial fission and fusion is believed to selectively remove damaged (depolarized) mitochondria (7). Therefore, the persistence of a high level of autophagy flux and mitochondria, structural dynamics may be the key to the maintenance of mitochondrial quality. In fact, the longevity of model organisms has been linked to the efficient maintenance of autophagy, a cellular process that is down-regulated during aging (8). The role of autophagy in the maintenance of health and longevity was recently highlighted in studies that showed that calorie restriction exerts its effect by enhancing mitochondrial autophagy (9). However, the mitochondrial status in the cells in which autophagy is activated has rarely been examined in detail. Limited information is available as to whether the content of mitochondria decreases or their quality increases in the cells in which autophagy has been induced. Meanwhile, mitochondrial structural dynamics appear to be attenuated during cellular senescence and aging as well (10). This change seems to be a causative event as well as a consequence of cellular senescence. The knockdown of mitochondrial fission results in the retention of elongated mitochondria, persistence of high ROS level, and progression into a stage of senescence (11). Exposure to H2O2 or disruption of ETC function, both of which induce senescence, also causes a reduction in mitochondrial fission activity and formation of elongated or giant mitochondria (12).
Nicotinamide (NAM), an amide form of vitamin B3, is readily converted to coenzyme β-nicotinamide-adenine dinucleotide (NAD+) through the salvage pathway involving NAM phosphoribosyltransferase (NAMPT) and NAM mononucleotide adenylyltransferase (13, 14). NAM promotes the survival of a variety of cell types, mainly by serving as a source of NAD+ (15). One of the known molecular targets of increased NAD+ levels is SIRT1, a member of the NAD+-dependent protein deacetylase family (16). SIRT1 activation has been suggested to promote cell survival and longevity of organisms (17, 18), although this effect has been recently challenged (19). It also exerts protective effects against a number of age-associated disorders and conditions, such as metabolic, cardiovascular, cancer, and neurodegenerative diseases (20). The dependence of SIRT1 on NAD+ suggests that SIRT1 fine-tunes cellular metabolism and body physiology according to the availability of cellular NAD+. SIRT1 also has been shown to play an essential role in the induction of autophagy during starvation (21, 22). Meanwhile, its absence results in the appearance of abnormally shaped mitochondria (21). However, a direct relationship between SIRT1-mediated autophagy and mitochondrial quantity as well as quality has not yet been reported.
In previous studies, we demonstrated that the treatment of human fibroblasts with 5 mm NAM activates autophagy and causes a decrease in mitochondrial content and ROS levels, while increasing mitochondrial membrane potential (MMP). NAM treatment also induces transformation of mitochondria from filamentous network structures to short dot structures (23). Furthermore, long term treatment of NAM resulted in a significant extension of the replicative life span of normal human fibroblasts and keratinocytes (24). On the basis of these findings, we hypothesized that by accelerating mitophagy NAM may facilitate the maintenance of high quality mitochondria and restrict oxidative stress to low levels. However, molecular mechanisms underlying the acceleration of autophagy and the mitochondrial transformation have not yet been elucidated. In this study, we examined the involvement of high cellular [NAD+]/[NADH] ratios and SIRT1 activation in the NAM-induced decrease of the mitochondrial content and their transformations. Our results show that cellular NAD+ metabolism modulates mitochondrial content through pathways that might involve SIRT1 activation.
EXPERIMENTAL PROCEDURES
Cell Culture and Chemicals
Normal human fibroblasts were cultured in DMEM plus 10% FBS with or without NAM (5 mm), NAD+ (5 mm), l-asparagine (20 mm), or the indicated amounts of fisetin, resveratrol (Sigma), SRT1720 (Selleck Chemical, Houston, TX), or FK866 (NIMH Drug Supply Program). For long term treatment, the medium supplemented with the chemicals was replaced every 2 days.
Western Blot Analysis
Cells were lysed with RIPA buffer (50 mm Tris-HCl (pH 7.5), 150 mm NaCl, 1% Nonidet P-40, 0.5% sodium deoxycholate, 0.1% SDS) supplemented with NaF, NaVO4, and a protease inhibitor mixture (Sigma). Typically, 30–40 μg of proteins were separated by SDS-PAGE, transferred to nitrocellulose membrane, and blotted with antibodies against human LC3, acetylated p53 (Cell Signaling Technology, Beverly, MA), p53, SIRT1, or ERK1/2 (Santa Cruz Biotechnology, Santa Cruz, CA) and acetyl-histone H3 (Millipore) or histone H3(Abcam, Cambridge, UK). Protein bands were visualized by using horseradish peroxidase-conjugated secondary antibodies and SuperSignal West Femto substrate (Pierce). For histone extraction, the RIPA lysate was pelleted, washed in Tris/EDTA (pH 7.4) buffer, and incubated in 200 μl of 0.4 n H2SO4 for 90 min on ice. After centrifugation, the supernatant was mixed with 1 ml of cold acetone and kept at −20 °C overnight. The histones were collected by centrifugation, air-dried, and resuspended in H2O. Typically, 1 μg of proteins was applied to Western blotting analysis.
Measurement of Mitochondrial Content and MMP
Cells were stained with 50 nm nonyl acridine orange or 100 nm MitoTracker Red (both from Invitrogen) for 30 min at 37 °C in dark and were then subjected to flow cytometry with 488 nm excitation/585 nm emission and 488 nm excitation/530 nm emission, respectively. For the measurement of MMP, cells were stained with 0.3 μg/ml JC-1 (Invitrogen) and subjected to flow cytometry with excitation at 488 nm. The emissions at 530 nm (FL-1) and at 585 nm (FL-2) were recorded, and the FL2/FL1 ratio of individual cells was calculated by using the software WEASEL. The mean values of the FL2/FL1 ratio of the samples were plotted by using the software SigmaPlot 9.01 (Systat Software, Inc., Chicago). Carbonyl cyanide m-chlorophenylhydrazone (Sigma), an inhibitor of oxidative phosphorylation, was used at 100 μm concentrations to analyze the MMP-independent staining of mitochondria in viable cells.
Confocal Microscopy for Mitochondria
Cells cultured on a microscope coverslip were fixed with 3.7% formaldehyde in PBS for 20 min, stained with OXPHOS complex detection kit (MitoSciences) and Alexa 488-conjugated anti-mouse 2° Ab, and visualized under a confocal microscope (LSM 510, Carl Zeiss, Thornwood, NY). To count the number of LC3 puncta per cell, the confocal microscopic image of LC3 puncta was applied to the punctum-counting program ImageJ (a freeware from National Institutes of Health).
siRNA Transfection
Cells seeded on a chamber slide were transfected with either control RNA (siNeg), siRNA against human NAMPT (siNAMPT; CAAGAGAUCUCUUGAAUUG), or SIRT1 (siSIRT1; CUUGUACGACGAAGACGAC) (Bioneer, Daejeon, South Korea) by using Lipofectamine RNAiMAX (Invitrogen) according to the manufacturer's protocol. Cells were analyzed 2–3 days after the transfection. siNeg RNA (CCUACGCCACCAAUUUCGU (dTdT)) has low homology to any human gene.
In Vivo SIRT1 Activity Assay
Cells were incubated with Fluor-de-Lys-SIRT1 deacetylase substrate (BML-K177, Enzo Life Sciences, Farmingdale, NY) and 1 m trichostatin A for 1 h, and fluorescence was detected as per the supplier's protocol.
Measurement of Total [NAD+]
Cells (1 × 10⁶) were washed in PBS and lysed by the addition of 200 μl of cold HClO4 solution (0.5 m) and incubated in ice for 15 min. The extracts were neutralized by adding 61 μl of 2 m KOH, 0.2 m K3PO4 (pH 7.5) and spun at 13,000 × g for 3 min. Supernatant or NAD+ standard diluents (30 μl) were mixed with 150 μl of the reaction solution. The mixtures were incubated for 30 min at 37 °C, and absorbance at 450 nm was measured. The reaction solution was composed of 8 μm WST-1 (Takara Bio Inc, Shiga, Japan), 70 μm 1-methoxy-5-methylphenazinium methyl sulfate, 20 IU alcohol dehydrogenase (Sigma), 64 mm nicotinamide, and 0.32 m ethanol (Sigma) in 64 mm Gly-Gly buffer (pH 7.4).
Measurement of Free [NAD+]/[NADH] Ratio
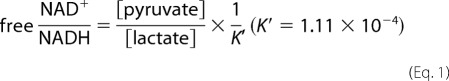
For the lactate oxidase assay, 10 μl of the culture medium or lactate standard solution was mixed with 196 μl of the assay buffer (0.1 m citrate, 1 mg/ml BSA, 0.1% CaCl2, 0.02% NaN3, adjusted to pH 6.5 with 1 m Na2HPO4), 1 μl of 2 milliunits/μl lactate oxidase stock (lactate oxidase enzymes (Sigma) were dissolved in the enzyme dilution buffer (10 mm KH2PO4, 10 μm FAD, adjusted to pH 7.0 with KOH)), 1 μl of 0.5 units/μl peroxidase stock (peroxidase (Sigma) dissolved in distilled water), and 2 μl of 5 mm Amplex UltraRed stock (Invitrogen). Assay mixtures were incubated for 30 min at 37 °C, and fluorescence was read at excitation/emission = 535/590 nm. For the pyruvate oxidase assay, 10 μl of the culture medium or pyruvate standard solution was mixed with 196 μl of the assay buffer (50 mm KH2PO4, 1 mg/ml BSA, 0.2 mm triphenylphosphine, 10 μm FAD, 0.97 mm EDTA, 9.8 mm MgCl2, 0.02% NaN3, adjusted to pH 6.5 with 1 m NaOH), 1 μl of 2 milliunits/μl lactate oxidase stock (pyruvate oxidase dissolved in buffer (10 mm KH2PO4, 10 μm FAD, adjusted to pH 7.0 with KOH)), 1 μl of 0.5 units/μl peroxidase stock, and 2 μl of 5 mm Amplex UltraRed stock. The assay mixtures were then incubated for 30 min at 37 °C, and fluorescence was read at excitation/emission = 535/590 nm. For the calculation of the ratio of free [NAD+]/[NADH], Equation 1 was used (25).
 |
Statistical Analysis
All quantitative measurements were made at least in triplicate, and mean ± S.E. values were presented. Intergroup comparison of the mean values was performed by one-way analysis of ANOVA using InStat 3.06 (GraphPad Software Inc., San Diego). A p value of ≤0.05 was considered to be statistically significant.
RESULTS
NAM-induced Decrease of Mitochondrial Content Requires NAM Conversion to NAD+
Fig. 1A shows an example of the change in the mitochondrial content that is commonly observed in various tested human cells (including normal fibroblasts and MCF-7, H460, and HCT116 cancer cell lines) after supplementation of 5 mm NAM in culture media. The mitochondrial content as determined by flow cytometry using two different mitochondrion-specific dyes was substantially decreased for the first 3 days and thereafter remained at a level about 70% that in the untreated cells, as reported previously (23).
FIGURE 1.

Importance of NAM conversion to NAD+ for the decrease of mitochondrial content. A, time course change in cellular mitochondrial content. Cells cultured in the medium supplemented with 5 mm NAM (replaced every 3 or 4 days) were collected and stained with nonyl acridine orange or MitoTracker Red and analyzed in flow cytometry. The mean fluorescence of three biological repeats of the NAM-treated cells was divided by that of the mock-treated cells, and the relative values were plotted. B, total [NAD+] was determined in the cells collected at 3, 6, 12, 24, and 48 h after the addition of 5 or 20 mm NAM, and the values relative to the concentration in the mock-treated cells were plotted. C and D, cells were cultured in the presence (gray bars) or absence (black bars) of 5 mm NAM (or 1 mm NMN) for 3 days. For FK866 treatment, 10 nm FK866 was added at the same time of NAM treatment. For siNAMPT expression, cells were first transfected with the siRNA 2 days prior to NAM addition. Cells were collected for analysis of [NAD+] (C) or stained with MitoTracker Green for quantification of mitochondrial content. Nonspecific RNA (siNeg) was used as a transfection control (D). The mean values from triplicate experiments were used to make the plots. *, p < 0.05; **, p < 0.01 (compared with the mock-treated cells (without NAM)); ##, p < 0.01 (compared with the mock-treated cells (with NAM)), by ANOVA test (Dunnett's test)).
In mammalian cells, NAM is readily converted to NAD+ through the salvage pathway; the first step of this pathway is the conversion of NAM to nicotinamide mononucleotide (NMN), which is mediated by NAM phosphoribosyltransferase (NAMPT) (26). In the cells pulsed with 5 mm NAM, cellular NAD+ concentration increased by close to 40% in 12 h, and this increase was maintained throughout the 21 days of the investigation (Fig. 1, B and C (−), gray bar; and supplemental Fig. 1).
The NAM-induced change in the mitochondrial status appears to be mediated by the increase in the NAD+ level. First, treatment of cells with 1 mm NMN, which caused an increase in the level of basal [NAD+] by nearly 40–50% (Fig. 1C (NMN)), resulted in a decrease in the mitochondrial content to the level achieved by NAM treatment, although NAM co-treatment did not cause any further decrease (Fig. 1D (NMN)). Next, the suppression of NAMPT by treatment with either FK866, a potent inhibitor of NAMPT (27), or NAMPT-specific siRNA resulted in a substantial decrease in the basal as well as the NAM-raised levels of NAD+ (Fig. 1C, FK866 and siNAMPT). Furthermore, these treatments resulted in a significant increase in the basal as well as the NAM-suppressed levels of the mitochondrial content. Importantly, this increase in mitochondrial content was attenuated by NMN supplementation, which enables cells to bypass the FK866- or siNAMPT RNA-induced inhibition of NAMPT (Fig. 1, C and D, FK866+NMN and siNAMPT+NMN). Overall, these results suggest that the NAD+ level determines the cellular mitochondrial content.
Lactate Treatment Alters Both the [NAD+]/[NADH] Ratio and Mitochondrial Content
We further questioned if the down-regulation of mitochondrial content by NAM is caused by an increase in the cellular ratio of [NAD+]/[NADH] rather than the increase of [NAD+] per se. In fact, the ratio of free [NAD+]/[NADH] increased nearly 2-fold on day 1 and remained elevated thereafter (Fig. 2A). (Interestingly, it further increased after day 3.) The ratio of the total [NAD+]/[NADH] also increased, albeit to a slightly lesser extent (Fig. 2B, compare NAM(−) and NAM(+)). The [NAD+]/[NADH] ratio is reciprocally regulated by the [pyruvate]/[lactate] ratio through lactate fermentation, and when elevated, it down-regulates the conversion of pyruvate to lactate. Indeed, in the NAM-treated cells, the cellular lactate production, as determined by its concentration in the culture medium, decreased with an inverse correlation to the change in the [NAD+]/[NADH] ratio (Fig. 2A). Meanwhile, the addition of 10 mm lactate to the medium resulted in a decrease in the ratio in the control as well as the NAM-treated cells to the levels well below those of the mock-treated cells (Fig. 2B). Surprisingly, lactate treatment resulted in an increase in the mitochondrial contents of both the control and NAM-treated cells in a dose-dependent manner (Fig. 2C). This indicates that lactate itself or the lactate-induced decrease in the [NAD+]/[NADH] ratio increases the mitochondrial content.
FIGURE 2.

NAM-mediated change in [NAD+]/[NADH] ratio and lactate production, and the effects of lactate and asparagine on the mitochondrial content. A, cells were cultured in the presence of 5 mm NAM, and at the indicated time points, cultured medium was collected and applied to the lactate/pyruvate oxidase assay to measure the ratio of free [NAD+]/[NADH] or to quantify lactate production per cell per h. B and C, cells cultured in the presence or absence of NAM for 3 days were treated with 10 mm l-lactate (5 or 10 mm in C) and further incubated for 3 more days prior to collection for the analysis for [NAD+]/[NADH] ratio (B) or for staining with MitoTracker Green to quantify mitochondrial content (C). The mean values from triplicate experiments were used to make the plots (p < 0.05 for all the comparisons to the mock-treated cells (−). D and E, effects of NAD+ and asparagine on the mitochondrial content. Fibroblasts cultured in the presence of 5 mm NAD+ (■) or 10 mm Asn (●) for 1, 3, or 7 days were collected, stained with MitoTracker Green and JC-1, and applied to flow cytometry for quantification of mitochondrial content (D) and MMP (E), respectively. The mean values from triplicate experiments were used to make the plots (*, p < 0.05; **, p < 0.01 (compared with the day 0 control) by ANOVA test (Dunnett's test)).
High [NAD+]/[NADH] Ratio Lowers Mitochondrial Content and Increases MMP
The importance of the [NAD+]/[NADH] ratio as a determining factor of the cellular mitochondrial status was confirmed in the cells where the ratio was altered through the modulation of the malate-aspartate shuttle. In this shuttle, malate dehydrogenase oxidizes NADH to NAD+ by transferring a hydrogen atom and an electron to oxaloacetate to produce malate, which crosses the mitochondrial membrane through the malate/α-ketoglutarate antiporter and becomes oxaloacetate again by reducing mitochondrial NAD+ to NADH. The mitochondrial oxaloacetate returns to cytosol in the form of aspartate (28). The cytosolic conversion of NADH to NAD+ can be promoted by an increase in the concentration of aspartate, which can be achieved by the addition to the culture medium of asparagine that is readily converted to aspartate by cytosolic asparaginase (29). We treated cells with 20 mm asparagine or NAD+ (treatment included as a positive control), and the effects on the mitochondrial content and MMP were monitored. Treatment of Asn caused a decrease in the mitochondrial content, with the kinetics being similar to that induced by NAD+ or NAM. For 3 days, nearly 40% reduction in the mitochondrial content was observed in both cases of Asn and NAD+ (Fig. 2D). The change in the MMP induced by Asn treatment was also similar to that induced by NAM treatment, an increase of nearly 50% in 3 days (Fig. 2E) (23). These results strongly indicate that the cytosolic [NAD+]/[NADH] ratio indeed plays a determinative role in the regulation of the mitochondrial content and MMP.
Both NAD+ and Asparagine Induce Autophagosome Formation and Mitochondrial Transformation
Our previous studies showed that NAM-induced changes in the mitochondrial status are dependent on the activation of autophagy and the transformation of mitochondria from long filaments to short dots (23). Whether Asn treatment also activates autophagy and induces mitochondrial transformation was determined. First, the effect of NAD+ or Asn treatment on autophagy activation was determined by examining the formation of LC-3 puncta through immunofluorescence for the endogenous LC-3 proteins (Fig. 3A). The numbers of prominent LC-3 puncta were significantly higher, and the puncta appeared to be more prominent in the cells treated with either NAD+ or Asn. The individual puncta were as big as those in the cells treated with resveratrol, which is known to induce autophagy through the activation of either SIRT1 (30) or AMP-activated protein kinase (31). Overall, these results suggest that autophagy flux is indeed increased by the treatment of Asn.
FIGURE 3.

Increase in LC3 puncta and mitochondrial fragmentation in the cells treated with NAD+ or Asn. A, cells cultured on a coverslip were either mock-treated (−) or incubated in the presence of 5 mm NAM, 5 mm NAD+, 10 mm Asn, or 10 μm resveratrol for 2 days and immunostained with antibody against LC3B protein (white) and counter-stained with Hoechst 33258 for nuclear DNA (gray). Representative confocal microscopic image of a cell is presented. The numbers of prominent LC3 puncta (bigger than 0.5 μm in diameter) in a cell were counted using the ImageJ program (rsbweb.nih.gov), and the mean numbers are presented in the table. B, cells cultured in the absence (−) or the presence of NAM, NAD+, or Asn for 2 days as above were stained with MitoTracker Red, fixed, and visualized in confocal microscopy. Magnifications: top row, ×252; bottom row, ×1000.
Next, a change in mitochondrial structure was examined through confocal microscopy. In mock-treated fibroblasts, most mitochondria appeared as long thread-like structures, as represented in Fig. 3B (−). However, in most of the NAM-treated cells, they seemed to be fragmented and appeared as short filaments or dots, many of which were shorter than 2 μm in length (Fig. 3B, NAM) (23). Importantly, in the NAD+- or Asn-treated cells, a decrease in mitochondrial length was also noted (Fig. 3B, NAD+ and Asn). Overall, all the three chemicals, NAM, NAD+, and Asn, increased autophagy flux and induced mitochondrial fragmentation, which strongly suggests that the increased [NAD+]/[NADH] ratio accelerates mitochondrial turnover via the induction of autophagy that is accompanied by mitochondrial fragmentation.
NAM at 5 mm but Not at Higher Concentrations Causes the Activation of SIRT1 and the Decrease of Mitochondrial Content
SIRT1 plays an essential role in autophagy by deacetylating the proteins involved in autophagosome formation (21). SIRT1 requires NAD+ as a substrate, and its activity is enhanced by an increase in the NAD+ level or [NAD+]/[NADH] ratio (32–34). However, SIRT1 activity is also inhibited by NAM itself (35), which makes it difficult to directly point to SIRT1 as a key mediator of the effect of NAM. In our previous study, knocking down SIRT1 substantially increased the level of the mitochondrial content both in the control and the NAM-treated cells, which rather demonstrates the importance of SIRT1 in the basal level autophagy (23). To determine whether the effect of NAM is mediated by the activation of SIRT1, we first checked if SIRT1 activity is indeed elevated in cells treated with 5 mm NAM. In the fibroblasts treated with 5 mm NAM, the acetylation level of histone H3, a known SIRT1 substrate (36), was apparently decreased from the 1st day and maintained at low levels thereafter, indicating an elevation of SIRT1 activity (Fig. 4A). Interestingly, SIRT1 protein level itself was substantially higher in the NAM-treated cells (Fig. 4A). Although the underlying mechanism is not known yet, this increase in the protein level would certainly help cells maintain high SIRT1 activity. Furthermore, the results from the Western blots where p53 acetylation level appeared to be lower at least from 12 h post-treatment (Fig. 4B) and the in vivo assay in which the deacetylation of a p53-based artificial substrate (37) similarly increased suggest an activation of SIRT1 upon the treatment of 5 mm NAM (Fig. 4C). Meanwhile, NAM at a 10 or 20 mm dose caused an increase of [NAD+] to the levels almost identical to that in the cells treated with 5 mm NAM (Fig. 1B) but resulted in an inhibition of SIRT1 activity during the early time period (data not shown). Importantly, the mitochondrial content was not down-regulated but rather increased in the cells treated with 20 mm NAM (Fig. 4D). This suggests that SIRT1 activities, including that which induces autophagy, are indeed inhibited when cells were fed with higher dose of NAM (especially at the early time period when a large quantity of NAM has not been converted to NMN and remains as NAM). In this regard, it is noteworthy that, in contrast to NAM, the treatment of NAD+ at a wide range of similar concentrations (1 μm to 5 mm) resulted in a decrease in the mitochondrial content, and not a single high dose caused an increase over the level that was maintained in the control cells (supplemental Fig. 2). This difference between NAM and NAD+ quite likely points to the inhibitory effect of NAM exerted at high doses.
FIGURE 4.

SIRT1 activity and the mitochondrial content in NAM-treated cells. A and B, cells incubated with 5 mm NAM for indicated time periods were applied to Western blotting for acetylated or total H3 or SIRT1 protein (A) and acetylated or total p53 or Erk protein. The protein bands were quantified by densitometry, and the values relative to those in the control cells (0 h) were averaged (from three different blots) and plotted. C, in vivo SIRT1 activity measured using Fluor-de-Lys assay kit. Each bar represents the mean ± S.E. of six independent experiments. *, p is < 0.02 compared with the 0 h control (−). D, cells cultured in the presence of 5 or 20 mm NAM were collected at the indicated time points, stained with nonyl acridine orange, and applied to flow cytometry to determine mitochondrial content. The quantities relative to those of the 0 h control from three biological repeats were averaged and plotted. A and D, *, #, p < 0.05; ##, p < 0.01 compared with the day 0 control by ANOVA test (Dunnett's test).
SIRT1 Activation Induces the Decrease of the Mitochondrial Content
The results above suggest that SIRT1-mediated autophagy activation may be at least one of the underlying mechanisms for the decrease in the mitochondrial content in the NAM-treated cells. This possibility was verified by examining the effect of the two chemicals that activate SIRT1 as follows: fisetin (3,7,3′,4′-tetrahydroxyflavone), which is structurally and functionally similar to resveratrol and therefore suffers from the problem of off-target effects (38, 39), and SRT1720, which is known to be highly specific to SIRT1 (40). Treatment with either chemical caused a decrease of the mitochondrial content to levels similar to that achieved by NAM treatment (Fig. 5, A–C). In the case of fisetin, the effect tended to be rapid, with the minimum level being attained on the 1st day, even at the lowest dose (10 μm). On the 2nd day, the content was restored a little bit but remained at nearly 80% of the mock-treated cells. Resveratrol also cased a similar change in the mitochondrial content (data not shown). Meanwhile, the treatment of SRT1720 caused a gradual decrease in the content, which reached nearly 60% that in the mock-treated cells on day 2, resembling that of the NAM treatment. Moreover, the doses of 80 and 800 nm caused almost identical changes, possibly reflecting a high specificity of the chemical. Together, the finding that different SIRT1 activators cause a decrease in the mitochondrial content to largely similar extents suggests that SIRT1 activation indeed causes down-regulation of cellular mitochondrial content. In addition, the mitochondrial content was maintained at low levels as long as the cells were continuously fed fresh activators as was the case with NAM (Fig. 5C).
FIGURE 5.

Mitochondrial content in the cells treated with fisetin or SRT1720. A and B, cells cultured for 1 or 2 days in the medium supplemented either with 10, 50, 100, or 250 μm fisetin (A) or 80, 160, of 800 nm SRT1720 (B) were fixed and stained with MitoTracker Green and applied to flow cytometric quantification of mitochondria. C, mitochondrial contents in the cells treated with either 10 μm fisetin or 160 nm SRT1720 for 1, 3, or 7 days were measured. The fluorescence values relative to those in the 0 day control cells were averaged from two biological repeats and plotted. (All the points are of p < 0.01 compared with the 0 day control cells (−) by ANOVA test.)
SIRT1 Activation Induces Mitochondrial Fragmentation
Next, we examined whether SIRT1 activation induces mitochondrial fragmentation as well. Treatment of 10 μm fisetin or 160 nm SRT1720 indeed resulted in the appearance of severed mitochondria in a large population of the cells on day 1 (Fig. 6A, panels b and c, respectively). Interestingly, mitochondria were severed but appeared to still be aligned with the location of the previous filaments in some cells treated with SRT1720 (Fig. 6A, panel c). Importantly, the mitochondrial fragmentation was blocked when SIRT1 mRNA was knocked down (Fig. 6B). As shown in Fig. 6A, (panels e and f), mitochondria remain as long filaments in the presence of fisetin or SRT1720 in the cells transfected with siRNA to SIRT1. These findings imply that mitochondrial transformation to dot structures is an event dependent on SIRT1 activation.
FIGURE 6.

Mitochondrial structure in the cells treated with fisetin or SRT1720. A, cells cultured in DMEM (panels a and d), DMEM containing 10 μm fisetin (panels b and e), or 160 nm SRT1720 (panels c and f) for 1 day were stained with MitoTracker Green, fixed, and microphotographed through confocal microscopy. Cells in panels a–c were transfected with siNegative RNA, and cells in panels d–f were transfected with siRNA to SIRT1 2 days prior to the chemical treatment. Magnifications: ×1000. B, status of SIRT1 protein in the cells transfected with siRNA to SIRT1 and mock-treated (lane c) or treated with fisetin (lane f) or SRT1720 (lane s).
NAM-induced MMP Change Is Not Dependent on SIRT1 Activation
Finally, we sought to determine whether the increase in MMP observed in the cells treated by NAM, NAD+, or Asn is also induced by SIRT1 activation. For this purpose, cells were treated with the SIRT1 activators, stained with JC-1, and subjected to flow cytometry for MMP determination. Surprisingly, none of the SIRT1 activators induced a significant increase in MMP (Fig. 7, A and B). This indicates that the increase in MMP by the treatment of NAM, NAD+, or Asn is mostly not due to SIRT1 activation or SIRT1-induced autophagy activation but is due to certain unknown mechanisms induced by the elevation of the [NAD+] or [NAD+]/[NADH] ratio. Finally, fisetin treatment induced a substantial decrease in MMP. This suppressive effect was not significant in the SRT1720-treated cells, and therefore it was likely caused by the off-target effect.
FIGURE 7.

Effect of fisetin or SRT1720 treatment on MMP. Cells cultured in the presence of 10, 50, 100, and 250 μm fisetin (A) or 80, 160, and 800 nm SRT1720 (B) for 1 or 2 days were collected, stained with JC-1, and applied to flow cytometry for quantification of MMP. Values were normalized by those from the 0-day control cells, and an average from three different biological repeats was plotted. In addition to the activators, the values from the cells treated with carbonyl cyanide 3-chlorophenylhydrazone, which induces mitochondrial depolarization, were added as a control showing a very low level of MMP. A, all the values are p < 0.05 compared with the 0 day control cells by ANOVA test.
DISCUSSION
Removal of dysfunctional mitochondria requires the activation of autophagy coupled with ongoing mitochondrial fission (7). Our current and previous studies show that both of these processes can be induced by NAM treatment. The earlier part of this study showed that the effect of NAM was exerted through an increase of [NAD+]/[NADH] ratio. The decrease of the mitochondrial content was not only dependent on the conversion of NAM to NAD+ but was also inversely proportional to the cellular levels of lactate, which is tightly linked to the [NAD+]/[NADH] ratio via lactate fermentation. More importantly, treatment of Asn, which mobilizes the aspartate-malate shuttle toward an increase in the [NAD+]/[NADH] ratio in cytosol, caused a decrease in the mitochondrial content and an increase in MMP with the kinetics and extent of change being similar to those induced by the NAM treatment. Furthermore, NAM, NAD+, and Asn commonly induced mitochondrial fragmentation, an essential prerequisite for mitochondrial autophagy.
The plausibility of SIRT1 being involved in the effect of the elevated [NAD+]/[NADH] ratio was examined in the latter part of this study. In our previous study, knocking down SIRT1 mRNA attenuated the effect of NAM on both mitochondrial content and MMP (23). However, SIRT1 appears to be an essential element in the basal level of autophagy (21). If this is the case, its absence would nullify cellular autophagy activity, and the results of this SIRT1 knockdown experiment may emphasize the requirement of SIRT1 for the effect of NAM but do not prove that NAM exerts its effect through the activation of SIRT1. In this study, the possibility for the involvement of SIRT1 activation is better supported. SIRT1 activation by fisetin, resveratrol, or SRT1720 caused a decrease in the mitochondrial content, with the extents being similar in all the cases and almost equivalent to those induced by NAM, NAD+, and Asn. More importantly, the treatment of the activators, similar to the treatment of NAM, NAD+, and Asn, caused mitochondrial fragmentation, and this effect required SIRT1 expression.
One important message of our study is that the activation of SIRT1 causes a decrease in the cellular content of mitochondria through the induction of autophagy and mitochondrial fragmentation. Previous studies showed that SIRT1 overexpression or its activation by resveratrol (although the effect of resveratrol may also be mediated by AMP-activated protein kinase activation (31)) induces autophagy (21, 41). SIRT1 has also been shown to play an essential role in the induction of autophagy in fasting cardiac myocytes (42). However, in these studies, it was not determined whether the cellular mitochondrial status is affected by the SIRT1-activated autophagy. Active autophagy does not necessarily mean ongoing mitophagy or a change in the status of mitochondria. Increased autophagy should be accompanied by the transformation of mitochondria to the structures that are suitable for autophagosome encirclement. In fact, a recent study showed that mitochondria are spared during starvation-induced autophagy by acquiring an elongated structure (43).
With regard to reasons for the decrease in the mitochondrial content, the possibility of down-regulation of mitochondrial biogenesis was ruled out in the previous study on the basis of the finding that the mRNA levels of PGC-1α, NRF-1 TFAM, as well as the ETC proteins were by and large unaffected by NAM treatment, at least soon after the treatment (23). On the contrary, SIRT1 activation has been reported to induce mitochondrial biogenesis, which would result in an increase in the mitochondrial content. In these studies, treatment with either resveratrol (44) or SRT1720 (45) activated PGC-1α and thereby induced mitochondrial biogenesis, which in turn results in an increased aerobic capacity of primary cultured cells or mice. If both mitochondrial autophagy and biogenesis occur simultaneously in a cell, these seemingly contradictory effects of SIRT1 would play an important role in mitochondrial quality maintenance, because mitochondrial biogenesis coupled with active mitophagy would repopulate functional mitochondria, resulting in the restoration of a healthy population of mitochondria (46). However, in our study, no activator, at any concentration, increased the MMP (Fig. 7). This suggests that SIRT1 activation most probably does not induce mitochondrial biogenesis nor activate mitophagy selective for depolarized ones in vitro. It is noteworthy that in a study (47) SIRT1-activated PGC-1α up-regulated gluconeogenic genes but not mitochondrial genes during fasting.
NAM is the end product of SIRT1 activity and noncompetitively inhibits the activity in vitro (35). Therefore, NAM has been widely used as an inhibitor of SIRT1. Meanwhile, NAM, when added to a cell culture, is readily converted to NMN by the intracellular and extracellular NAMPT enzymes (48). In fact, NAD+ level increased rapidly and was maintained at elevated levels for 21 days of experiment (see Fig. 1 and supplemental Fig. 1). Furthermore, in our studies thus far, it appears that SIRT1 stimulation rather than SIRT1 inactivation is the outcome of the treatment with 5 mm NAM. In MCF-7 and H460 human cancer lines, NAM treatment at 5 mm (but not at 20 mm) caused a similar decrease in the mitochondrial content.4 Meanwhile, to induce SIRT1 inhibition in vivo, NAM is frequently used at concentrations higher than 5 mm (for example, 40 mm was used in Ref. 49). With regard to this contradictory effect of NAM, it is noteworthy that 5 mm NAM inhibited SIRT1-mediated PGC-1α deacetylation in 293T cells, but even at 50 mm it was unable to increase PGC-1α acetylation when the SIRT1 protein level was increased by the adenoviral transduction of the gene (47). This indicates that the inhibitory effect of NAM is sensitive to the cellular level of the SIRT1 protein. An apparent increase of SIRT1 protein level occurred, and this, in the presence of the high concentration of NAM, would also enable cells to maintain a high level SIRT1 activity (Fig. 4A). Meanwhile, during the course of the NAM-induced change in the mitochondrial content, a brief increase in the content occurred within 12 h post-treatment suggesting a possibility that SIRT1 might be transiently inactivated at an early period of NAM treatment (Fig. 4D). This raises a possibility that the SIRT1 inhibitory effect of NAM lasts only transiently, and therefore, it has to be sought immediately after the treatment. This also emphasizes the importance of measuring the intracellular concentration of NAM itself at various time points after treatment in this study as well as in other studies that may examine the cellular effect of NAM. Meanwhile, there is a possibility that SIRT1 may function indirectly in the NAM-induced autophagy activation. For example, SIRT1 may work as a sink for the incoming NAM. Activity of certain unknown molecules may benefit from this SIRT1-modulated [NAM] or NAD+/NADH ratio and cause mitochondrial degradation or mitophagy. Despite appearing to be rather remote and considering the molecular ratio of SIRT1 and NAM in cells, such a possibility needs to be experimentally ruled out.
Mitochondria frequently undergo changes in morphology that are mediated by continuous and rapid fusion and fission (7). Mitophagy coupled with this structural dynamic functions in removing the depolarized parts of mitochondria. Mitochondrial dynamics appear to be implicated in many cellular processes, including proliferation, apoptosis (50), and senescence (51). For example, fission activity declines during the course of cellular senescence (10), and conversely, blocking mitochondrial fission leads to senescence (11). Mitochondrial dynamics are also implicated in cardiac and neuronal development (50, 52) and in a variety of neurodegenerative diseases and metabolic disorders (reviewed in Ref. 50). Our results suggest a possibility that these physiological and pathological processes may be affected by the status of the [NAD+]/[NADH] ratio through its effect on the mitochondrial dynamics. Furthermore, certain beneficial effects of calorie restriction may be driven by this metabolic modulator. In fact, calorie restriction is associated with an increase in mitochondrial turnover (41). Our results support the previous notion by other reports that, under conditions of calorie restriction, the maintenance of a high [NAD+]/[NADH] ratio elevates the rate of mitochondrial turnover through the activation of SIRT1. It would be interesting to see whether the beneficial effects of calorie restriction and SIRT1 activation on various age-related disorders are accompanied by a change in mitochondrial content and morphology.
Finally, fragmented punctiform mitochondria have been found in cells undergoing apoptosis (53), and a long filamentous form appears to be associated with better energy metabolism (54, 55). Failure in mitochondrial fusion has been shown to cause accumulation of defective mitochondrial DNA (56). The continued presence of the fragmental mitochondria during the long term culture in the presence of NAM did not cause an increase of ROS or shorten cellular life span (24). Therefore, such transformation of mitochondria by NAM treatment does not seem to be associated with apoptosis or functional deterioration of mitochondria. Still, for a practical application of NAM, it may be important to further examine the functional significance of this fragmental transformation and its maintenance in energy metabolism.
Supplementary Material
This work was supported by Mid-career Researcher Program NRF Grant 2009-0086432 funded by the MEST.

This article contains supplemental Figs. 1 and 2.
H. T. Kang, unpublished data.
- ETC
- electron transport chain
- NAM
- nicotinamide
- MMP
- mitochondrial membrane potential
- ROS
- reactive oxygen species
- NAMPT
- nicotinamide phosphoribosyltransferase
- ANOVA
- analysis of variance.
REFERENCES
- 1. Humphries K. M., Szweda P. A., Szweda L. I. (2006) Aging. A shift from redox regulation to oxidative damage. Free Radic. Res. 40, 1239–1243 [DOI] [PubMed] [Google Scholar]
- 2. Liu Y., Fiskum G., Schubert D. (2002) Generation of reactive oxygen species by the mitochondrial electron transport chain. J. Neurochem. 80, 780–787 [DOI] [PubMed] [Google Scholar]
- 3. Yoon Y. S., Lee J. H., Hwang S. C., Choi K. S., Yoon G. (2005) TGFβ1 induces prolonged mitochondrial ROS generation through decreased complex IV activity with senescent arrest in Mv1Lu cells. Oncogene 24, 1895–1903 [DOI] [PubMed] [Google Scholar]
- 4. Guarente L. (2008) Mitochondria. A nexus for aging, calorie restriction, and sirtuins? Cell 132, 171–176 [DOI] [PMC free article] [PubMed] [Google Scholar]
- 5. Brunk U. T., Terman A. (2002) The mitochondrial-lysosomal axis theory of aging. Accumulation of damaged mitochondria as a result of imperfect autophagocytosis. Eur. J. Biochem. 269, 1996–2002 [DOI] [PubMed] [Google Scholar]
- 6. Lee H. C., Yin P. H., Chi C. W., Wei Y. H. (2002) Increase in mitochondrial mass in human fibroblasts under oxidative stress and during replicative cell senescence. J. Biomed. Sci. 9, 517–526 [DOI] [PubMed] [Google Scholar]
- 7. Twig G., Elorza A., Molina A. J., Mohamed H., Wikstrom J. D., Walzer G., Stiles L., Haigh S. E., Katz S., Las G., Alroy J., Wu M., Py B. F., Yuan J., Deeney J. T., Corkey B. E., Shirihai O. S. (2008) Fission and selective fusion govern mitochondrial segregation and elimination by autophagy. EMBO J. 27, 433–446 [DOI] [PMC free article] [PubMed] [Google Scholar]
- 8. Simonsen A., Cumming R. C., Brech A., Isakson P., Schubert D. R., Finley K. D. (2008) Promoting basal levels of autophagy in the nervous system enhances longevity and oxidant resistance in adult Drosophila. Autophagy 4, 176–184 [DOI] [PubMed] [Google Scholar]
- 9. Kume S., Uzu T., Horiike K., Chin-Kanasaki M., Isshiki K., Araki S., Sugimoto T., Haneda M., Kashiwagi A., Koya D. (2010) Calorie restriction enhances cell adaptation to hypoxia through Sirt1-dependent mitochondrial autophagy in mouse aged kidney. J. Clin. Invest. 120, 1043–1055 [DOI] [PMC free article] [PubMed] [Google Scholar]
- 10. Jendrach M., Pohl S., Vöth M., Kowald A., Hammerstein P., Bereiter-Hahn J. (2005) Morpho-dynamic changes of mitochondria during ageing of human endothelial cells. Mech. Ageing Dev. 126, 813–821 [DOI] [PubMed] [Google Scholar]
- 11. Lee S., Jeong S. Y., Lim W. C., Kim S., Park Y. Y., Sun X., Youle R. J., Cho H. (2007) Mitochondrial fission and fusion mediators, hFis1 and OPA1, modulate cellular senescence. J. Biol. Chem. 282, 22977–22983 [DOI] [PubMed] [Google Scholar]
- 12. Yoon Y. S., Yoon D. S., Lim I. K., Yoon S. H., Chung H. Y., Rojo M., Malka F., Jou M. J., Martinou J. C., Yoon G. (2006) Formation of elongated giant mitochondria in DFO-induced cellular senescence. Involvement of enhanced fusion process through modulation of Fis1. J. Cell. Physiol. 209, 468–480 [DOI] [PubMed] [Google Scholar]
- 13. Jackson T. M., Rawling J. M., Roebuck B. D., Kirkland J. B. (1995) Large supplements of nicotinic acid and nicotinamide increase tissue NAD+ and poly(ADP-ribose) levels but do not affect diethylnitrosamine-induced altered hepatic foci in Fischer-344 rats. J. Nutr. 125, 1455–1461 [DOI] [PubMed] [Google Scholar]
- 14. Zhang T., Berrocal J. G., Frizzell K. M., Gamble M. J., DuMond M. E., Krishnakumar R., Yang T., Sauve A. A., Kraus W. L. (2009) Enzymes in the NAD+ salvage pathway regulate SIRT1 activity at target gene promoters. J. Biol. Chem. 284, 20408–20417 [DOI] [PMC free article] [PubMed] [Google Scholar]
- 15. Maiese K., Chong Z. Z., Hou J., Shang Y. C. (2009) The vitamin nicotinamide. Translating nutrition into clinical care. Molecules 14, 3446–3485 [DOI] [PMC free article] [PubMed] [Google Scholar]
- 16. Blander G., Guarente L. (2004) The Sir2 family of protein deacetylases. Annu. Rev. Biochem. 73, 417–435 [DOI] [PubMed] [Google Scholar]
- 17. Giannakou M. E., Partridge L. (2004) The interaction between FOXO and SIRT1. Tipping the balance toward survival. Trends. Cell Biol. 14, 408–412 [DOI] [PubMed] [Google Scholar]
- 18. Klöting N., Blüher M. (2005) Extended longevity and insulin signaling in adipose tissue. Exp. Gerontol. 40, 878–883 [DOI] [PubMed] [Google Scholar]
- 19. Burnett C., Valentini S., Cabreiro F., Goss M., Somogyvári M., Piper M. D., Hoddinott M., Sutphin G. L., Leko V., McElwee J. J., Vazquez-Manrique R. P., Orfila A. M., Ackerman D., Au C., Vinti G., Riesen M., Howard K., Neri C., Bedalov A., Kaeberlein M., Soti C., Partridge L., Gems D. (2011) Absence of effects of Sir2 overexpression on life span in Caenorhabditis elegans and Drosophila. Nature 477, 482–485 [DOI] [PMC free article] [PubMed] [Google Scholar]
- 20. Herranz D., Serrano M. (2010) SIRT1. Recent lessons from mouse models. Nat. Rev. Cancer 10, 819–823 [DOI] [PMC free article] [PubMed] [Google Scholar]
- 21. Lee I. H., Cao L., Mostoslavsky R., Lombard D. B., Liu J., Bruns N. E., Tsokos M., Alt F. W., Finkel T. (2008) A role for the NAD-dependent deacetylase Sirt1 in the regulation of autophagy. Proc. Natl. Acad. Sci. U.S.A. 105, 3374–3379 [DOI] [PMC free article] [PubMed] [Google Scholar]
- 22. Salminen A., Kaarniranta K. (2009) SIRT1. Regulation of longevity via autophagy. Cell. Signal. 21, 1356–1360 [DOI] [PubMed] [Google Scholar]
- 23. Kang H. T., Hwang E. S. (2009) Nicotinamide enhances mitochondria quality through autophagy activation in human cells. Aging Cell 8, 426–438 [DOI] [PubMed] [Google Scholar]
- 24. Kang H. T., Lee H. I., Hwang E. S. (2006) Nicotinamide extends replicative life span of human cells. Aging Cell 5, 423–436 [DOI] [PubMed] [Google Scholar]
- 25. Williamson D. H., Lund P., Krebs H. A. (1967) The redox state of free nicotinamide-adenine dinucleotide in the cytoplasm and mitochondria of rat liver. Biochem. J. 103, 514–527 [DOI] [PMC free article] [PubMed] [Google Scholar]
- 26. Rongvaux A., Andris F., Van Gool F., Leo O. (2003) Reconstructing eukaryotic NAD metabolism. BioEssays 25, 683–690 [DOI] [PubMed] [Google Scholar]
- 27. Hasmann M., Schemainda I. (2003) FK866, a highly specific noncompetitive inhibitor of nicotinamide phosphoribosyltransferase, represents a novel mechanism for induction of tumor cell apoptosis. Cancer Res. 63, 7436–7442 [PubMed] [Google Scholar]
- 28. Nelson D. L., Cox M. M. (eds) (2000) Lehninger; Principles of Biochemistry, 3rd Ed., p. 685, Worth Publishers, New York [Google Scholar]
- 29. Park J. W., Chun Y. S., Kim M. S., Park Y. C., Kwak S. J., Park S. C. (1998) Metabolic modulation of cellular redox potential can improve cardiac recovery from ischemia-reperfusion injury. Int. J. Cardiol. 65, 139–147 [DOI] [PubMed] [Google Scholar]
- 30. Morselli E., Mariño G., Bennetzen M. V., Eisenberg T., Megalou E., Schroeder S., Cabrera S., Bénit P., Rustin P., Criollo A., Kepp O., Galluzzi L., Shen S., Malik S. A., Maiuri M. C., Horio Y., López-Otín C., Andersen J. S., Tavernarakis N., Madeo F., Kroemer G. (2011) Spermidine and resveratrol induce autophagy by distinct pathways converging on the acetyl proteome. J. Cell Biol. 192, 615–629 [DOI] [PMC free article] [PubMed] [Google Scholar]
- 31. Puissant A., Robert G., Fenouille N., Luciano F., Cassuto J. P., Raynaud S., Auberger P. (2010) Resveratrol promotes autophagic cell death in chronic myelogenous leukemia cells via JNK-mediated p62/SQSTM1 expression and AMPK activation. Cancer Res. 70, 1042–1052 [DOI] [PubMed] [Google Scholar]
- 32. Lin S. J., Ford E., Haigis M., Liszt G., Guarente L. (2004) Calorie restriction extends yeast life span by lowering the level of NADH. Genes Dev. 18, 12–16 [DOI] [PMC free article] [PubMed] [Google Scholar]
- 33. Sauve A. A., Wolberger C., Schramm V. L., Boeke J. D. (2006) The biochemistry of sirtuins. Annu. Rev. Biochem. 75, 435–465 [DOI] [PubMed] [Google Scholar]
- 34. Milner J. (2009) Cellular regulation of SIRT1. Curr. Pharm. Des. 15, 39–44 [DOI] [PubMed] [Google Scholar]
- 35. Bitterman K. J., Anderson R. M., Cohen H. Y., Latorre-Esteves M., Sinclair D. A. (2002) Inhibition of silencing and accelerated aging by nicotinamide, a putative negative regulator of yeast Sir2 and human SIRT1. J. Biol. Chem. 277, 45099–45107 [DOI] [PubMed] [Google Scholar]
- 36. Tanno M., Sakamoto J., Miura T., Shimamoto K., Horio Y. (2007) Nucleocytoplasmic shuttling of the NAD+-dependent histone deacetylase SIRT1. J. Biol. Chem. 282, 6823–6832 [DOI] [PubMed] [Google Scholar]
- 37. Vaziri H., Dessain S. K., Ng Eaton E., Imai S. I., Frye R. A., Pandita T. K., Guarente L., Weinberg R. A. (2001) hSIR2(SIRT1) functions as an NAD-dependent p53 deacetylase. Cell 107, 149–159 [DOI] [PubMed] [Google Scholar]
- 38. Howitz K. T., Bitterman K. J., Cohen H. Y., Lamming D. W., Lavu S., Wood J. G., Zipkin R. E., Chung P., Kisielewski A., Zhang L. L., Scherer B., Sinclair D. A. (2003) Small molecule activators of sirtuins extend Saccharomyces cerevisiae life span. Nature 425, 191–196 [DOI] [PubMed] [Google Scholar]
- 39. Baur J. A. (2010) Biochemical effects of SIRT1 activators. Biochim. Biophys. Acta 1804, 1626–1634 [DOI] [PMC free article] [PubMed] [Google Scholar]
- 40. Milne J. C., Lambert P. D., Schenk S., Carney D. P., Smith J. J., Gagne D. J., Jin L., Boss O., Perni R. B., Vu C. B., Bemis J. E., Xie R., Disch J. S., Ng P. Y., Nunes J. J., Lynch A. V., Yang H., Galonek H., Israelian K., Choy W., Iffland A., Lavu S., Medvedik O., Sinclair D. A., Olefsky J. M., Jirousek M. R., Elliott P. J., Westphal C. H. (2007) Small molecule activators of SIRT1 as therapeutics for the treatment of type 2 diabetes. Nature 450, 712–716 [DOI] [PMC free article] [PubMed] [Google Scholar]
- 41. Morselli E., Maiuri M. C., Markaki M., Megalou E., Pasparaki A., Palikaras K., Criollo A., Galluzzi L., Malik S. A., Vitale I., Michaud M., Madeo F., Tavernarakis N., Kroemer G. (2010) The life span-prolonging effect of sirtuin-1 is mediated by autophagy. Autophagy 6, 186–188 [DOI] [PubMed] [Google Scholar]
- 42. Hariharan N., Maejima Y., Nakae J., Paik J., Depinho R. A., Sadoshima J. (2010) Deacetylation of FoxO by Sirt1 plays an essential role in mediating starvation-induced autophagy in cardiac myocytes. Circ. Res. 107, 1470–1482 [DOI] [PMC free article] [PubMed] [Google Scholar]
- 43. Gomes L. C., Di Benedetto G., Scorrano L. (2011) During autophagy mitochondria elongates are spared from degradation and sustain cell viability. Nat. Cell Biol. 13, 589–598 [DOI] [PMC free article] [PubMed] [Google Scholar]
- 44. Lagouge M., Argmann C., Gerhart-Hines Z., Meziane H., Lerin C., Daussin F., Messadeq N., Milne J., Lambert P., Elliott P., Geny B., Laakso M., Puigserver P., Auwerx J. (2006) Resveratrol improves mitochondrial function and protects against metabolic disease by activating SIRT1 and PGC-1α. Cell 127, 1109–1122 [DOI] [PubMed] [Google Scholar]
- 45. Funk J. A., Odejinmi S., Schnellmann R. G. (2010) SRT1720 induces mitochondrial biogenesis and rescues mitochondrial function after oxidant injury in renal proximal tubule cells. J. Pharmacol. Exp. Ther. 333, 593–601 [DOI] [PMC free article] [PubMed] [Google Scholar]
- 46. Fu X., Wan S., Lyu Y. L., Liu L. F., Qi H. (2008) Etoposide induces ATM-dependent mitochondrial biogenesis through AMPK activation. PloS One 3, e2009. [DOI] [PMC free article] [PubMed] [Google Scholar]
- 47. Rodgers J. T., Lerin C., Haas W., Gygi S. P., Spiegelman B. M., Puigserver P. (2005) Nutrient control of glucose homeostasis through a complex of PGC-1α and SIRT1. Nature 434, 113–118 [DOI] [PubMed] [Google Scholar]
- 48. Imai S. (2009) Nicotinamide phosphoribosyltransferase (Nampt). A link between NAD biology, metabolism, and diseases. Curr. Pharm. Des. 15, 20–28 [DOI] [PMC free article] [PubMed] [Google Scholar]
- 49. Chen C. J., Yu W., Fu Y. C., Wang X., Li J. L., Wang W. (2009) Resveratrol protects cardiomyocytes from hypoxia-induced apoptosis through the SIRT1-FoxO1 pathway. Biochem. Biophys. Res. Commun. 378, 389–393 [DOI] [PubMed] [Google Scholar]
- 50. Liesa M., Palacín M., Zorzano A. (2009) Mitochondrial dynamics in mammalian health and disease. Physiol. Rev. 89, 799–845 [DOI] [PubMed] [Google Scholar]
- 51. Hwang E. S., Yoon G., Kang H. T. (2009) A comparative analysis of the cell biology of senescence and aging. Cell. Mol. Life Sci. 66, 2503–2524 [DOI] [PMC free article] [PubMed] [Google Scholar]
- 52. Ong S. B., Hausenloy D. J. (2010) Mitochondrial morphology and cardiovascular disease. Cardiovasc. Res. 88, 16–29 [DOI] [PMC free article] [PubMed] [Google Scholar]
- 53. Frank S., Gaume B., Bergmann-Leitner E. S., Leitner W. W, Robert E. G., Catez F., Smith C. L., Youle R. J. (2001) The role of dynamin-related protein 1, a mediator of mitochondrial fission, in the regulation of apoptosis. Dev. Cell 1, 515–525 [DOI] [PubMed] [Google Scholar]
- 54. Bach D., Pich S., Soriano F. X., Vega N., Baumgartner B., Oriola J., Daugaard J. R., Lloberas J., Camps M., Zierath J. R., Rabasa-Lhoret R., Wallberg-Henriksson H., Laville M., Palacín M., Vidal H., Rivera F., Brand M., Zorzano A. (2003) A novel regulatory mechanism altered in obesity. J. Biol. Chem. 278, 17190–17197 [DOI] [PubMed] [Google Scholar]
- 55. Ishihara N., Eura Y., Mihara K. (2004) Mitofusin 1 and 2 play distinct roles in mitochondrial fusion reactions via GTPase activity. J. Cell Sci. 117, 6535–6546 [DOI] [PubMed] [Google Scholar]
- 56. Chen H., Vermulst M., Wang Y. E., Chomyn A., Prolla T. A., McCaffery J. M., Chan D. C. (2010) Mitochondrial fusion is required for mtDNA stability in skeletal muscle and tolerance of mtDNA mutations. Cell 141, 280–289 [DOI] [PMC free article] [PubMed] [Google Scholar]
Associated Data
This section collects any data citations, data availability statements, or supplementary materials included in this article.