Abstract
Purpose
To measure vertical and horizontal thickness profiles of the central and peripheral corneal epithelium and determine if daytime changes occur.
Methods
Forty eyes of 20 normal subjects were imaged by ultra-high resolution spectral domain optical coherence tomography to profile the corneal epithelial thickness from the edge of Bowman’s layer to the central cornea across the vertical and horizontal meridians. Measurements were made at 10:00 AM and again at 6, 8 hours later.
Results
The baseline vertical meridional epithelial thickness was thinnest, 42.9±4.1 μm, at the edge of Bowman’s layer in the superior region. It increased in thickness (p<0.01), towards the central cornea. The central epithelium averaged 52.5±2.4 μm, becoming thickest, 55.2±2.5 μm, in the inferior pericentral region. It thinned towards the inferior periphery, reaching 51.3±5.1 μm at the edge of Bowman’s layer (p<0.01). Along the horizontal meridian, the epithelium was thickest at the nasal side, 58.6±5.1 μm, and temporal side, 59.3±6.6 μm, near the edges of Bowman’s layer. It thinned towards the central cornea. There were no significant changes in the epithelial thickness at any location over 8 hours.
Conclusion
Epithelial thickness varied over the horizontal and vertical meridians and appeared stable during the daytime.
Keywords: epithelial thickness, diurnal variation, optical coherence tomography
INTRODUCTION
The corneal epithelium plays an important role in the maintenance of corneal integrity and transparency.1,2 Also, it affects refraction because of its shape at the air-tear film interface and differences in refractive index with the stroma.3 Understanding the thickness profile of the corneal epithelium may enable us to gain insightful information to better understand the mechanisms of the corneal change due to disease, surgery, and contact lens wear.
Using a variety of techniques and instruments, variations in corneal epithelial thickness have been measured in normal and abnormal populations.4–9 Most investigations of epithelial thickness report on the central cornea only. While a few studies have documented the peripheral thickness along the horizontal meridian, 10–13 very few have studied the thickness along the peripheral vertical meridian.14, 15 The thickness of the peripheral epithelium is especially important because corneal refractive surgery and contact lenses infringe upon it.15, 16
Only a few instruments or techniques have the ability to measure epithelial thickness.10, 11, 17–19 Reinstein et al.20, 21 used high frequency ultrasound to produce in vivo topographical plots of epithelial thickness over the entire corneal surface. However this technique requires the cornea to be submerged in a water bath while the subject assumes a supine position. Confocal microscopy can measure epithelial thickness, but it also is invasive and has the potential to cause corneal lesions or transmission of infections. Also, it is impossible to measure exactly the same locations within the cornea in serial confocal microscopy examinations.13 Recent advances in optical coherence tomography (OCT) have enabled exact and rapid cross-sectional imaging of the cornea without direct eye contact. This imaging modality has excellent repeatability and accuracy.22–24 Ultra-high resolution OCT (UHR-OCT) is an advanced technique that has enhanced resolution, ~3 μm, approximately 3-times better than conventional time domain OCT. The high speed imaging modality with ultra-high resolution enables analysis of the topographical thickness of the tear film, epithelium, Bowman’s layer, as well as the total cornea.25,26 This novel instrumentation may be beneficial for clinicians and scientists for precisely measuring the subtle but clinically significant changes of the epithelium in various diseases. The goal of this study was to determine by UHR-OCT the thickness profiles of the central and peripheral corneal epithelia in the vertical and horizontal meridians. We also determined if the epithelium undergoes daytime changes.
SUBJECTS AND METHODS
Subjects
This study was approved by the institutional review board for human research of the University of Miami. Informed consent was obtained from each subject, and all were treated in accordance with the tenets of the Declaration of Helsinki. A total of 20 participants (7 males and 13 females) with a mean (±SD) age 32.4 ± 5.7 years old were recruited from the campus of the University and the Medical Center. None of the subjects had a history of ocular or systemic disease or surgery. Thirteen were non-lens wearers and seven wore soft contact lenses. They were asked to stop wearing their contact lenses for at least one week prior to beginning the study. The mean refraction for right eyes was −2.1 ± 1.9 D and for left eyes was −1.9 ± 1.9 D.
UHR-OCT
A custom-built UHR spectral domain OCT prototype was used to assess corneal epithelial thickness across the horizontal and vertical meridians. The specification of the instrument and the experimental procedures were described in our previous studies.25,26 Briefly, the system included a spectral domain OCT instrument with ~3 μm axial resolution that was designed for imaging the anterior segment of the eye. The scanning probe was mounted on a standard slit-lamp to facilitate imaging. The scan speed was set to 24K A-scans per second, and the scan width was set to 7.746 mm.
Experimental procedure and image processing
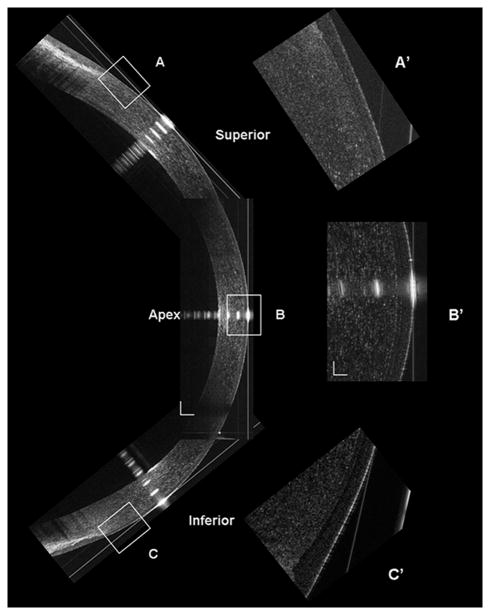
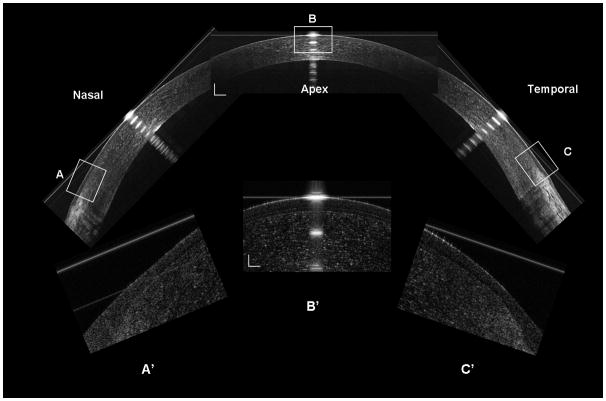
All OCT images were obtained in a normal examination room with environmental settings of temperature (15–25°C) and humidity (30–50%) that were monitored by a temperature logger (Dickson TM121, Addison, Illinosis). Baseline images of both eyes of the 20 subjects were taken twice within 15 minutes after 10:00 AM and again at 6 hours (4:00 PM) and 8 hours (6:00 PM) later. Each subject was asked to sit in front of the slit-lamp on which the OCT probe was mounted. The epithelial thickness profiles were obtained by scanning the vertical and horizontal meridians. The central OCT beam, indicated on the OCT monitor, was set on the corneal apex where a specular reflection was normally detected. When imaging the peripheral cornea, the subject was asked to look at the nasal, temporal, superior, and inferior fixation targets that were marked on the slit-lamp. (Figs. 1, 2) Additionally, when imaging the vertical meridian of the inferior cornea, the subject looked at the superior fixation target and opened the eye as widely as possible. For the vertical meridian of the superior cornea, the subject looked at the inferior target and used a finger to slightly lift the upper lid.
Figure 1. Construction of the UHR-OCT corneal image along the vertical meridian.
The superior, central and inferior OCT images were reconstructed at the vertical meridian (Bars = 250 μm). The inserts (A’, B’ and C’) were the magnified areas marked as A, B, and C (Bars = 50 μm).
Figure 2. Construction of the UHR-OCT corneal image along the horizontal meridian.
The nasal, central, and temporal OCT images were reconstructed at the horizontal meridian (Bars = 250 μm). The inserts (A’, B’ and C’) were the magnified areas marked as A, B and C (Bars = 50 μm).
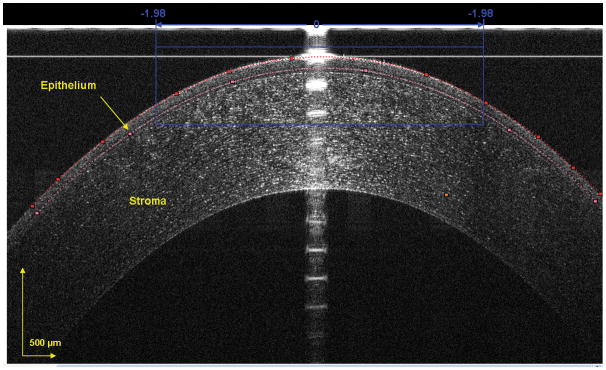
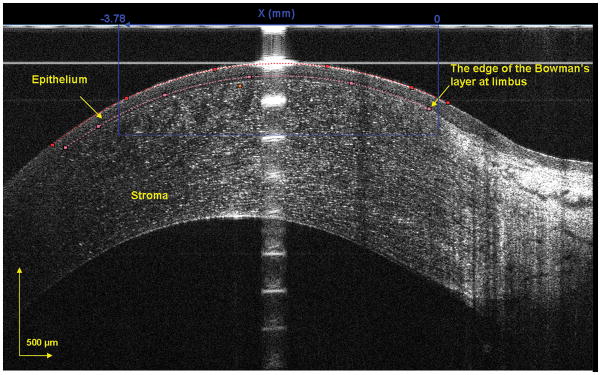
Custom software was used to segment the epithelium in the OCT images to yield the epithelial thickness profile. In the exported images, the epithelium was outlined semi-manually. For the central region, only the central 1000 pixels out of a total of 2048 pixels, equivalent to a 3.78 mm chord distance, were used for image analysis (Fig. 3). For the peripheral region, the edge of Bowman's layer was chosen to define the outer limits. A thousand pixels extending from the edge of Bowman’s layer toward the central cornea were analyzed (Fig. 4). Both regions were divided into 10 equal zones. For the central cornea, Zones 5 – 6 represented the apex. For the peripheral regions, Zone 1 was at the edge of Bowman's layer and Zone 10 was towards the central cornea.
Figure 3. Segmented epithelium at horizontal central region of the cornea.
The image was acquired at the center location, and the epithelium was outlined semi-manually. The dots were chosen as the intensity peaks and the software detected all other peaks to form the curve-fitted boundaries of the front and back surfaces of the epithelium. The central 1000 pixels, equal to a chord distance of 3.78 mm, were used to yield the epithelial thickness for the central cornea in each of the 10 zones.
Figure 4. Segmented epithelium at peripheral temporal region of the cornea.
The edge of Bowman’s layer was chosen as the landmark. The epithelium toward the apex was outlined using custom software. The 1000 pixels, equal to chord distance of 3.78 mm, from the landmark toward the apex were used to yield the peripheral epithelial thickness in each of the 10 zones.
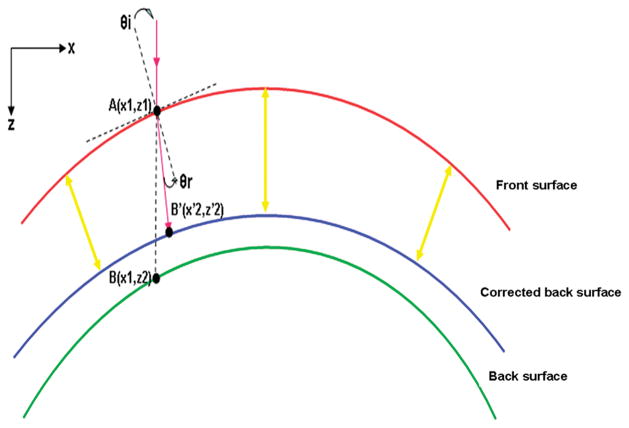
For image processing, we applied a refraction correction algorithm. First, a polynomial function was fitted to the front interface using a least squares fitting procedure. Then, using the algorithm according to the Snell’s principle,27 we calculated the corrected position of each pixel on the back interface. In the third step, the epithelium thickness was measured around the axis that was perpendicular to the slope of the epithelium at each lateral location. A refractive index of 1.389 was used to calculate to epithelial thickness across the cornea.28 The custom built UHR-OCT prototype and the refraction correction algorithm were validated by testing the thickness measurements of a polymethylmethacrylate (PMMA) contact lens. First, the PMMA lens was measured with a lens measuring gauge (Vigor GA-715,MITUTOYO Japan).29 Five repeated measurements were taken by three technicians at five marked position (1 mm apart) within the 4 mm central region along one meridian. Then, three repeated OCT scanning images with a width of 7.746 mm were taken along the marked meridian. The images were processed with custom software, and the PMMA lens thickness was calculated using the refractive index of PMMA, 1.485 at the light wavelength of 830 nm, in the refraction correction algorithm. The correlation coefficient R2 between the gauge and OCT measurements was 0.906 with differences of 1–3 μm at the five positions within the central 4 mm region.
Data analysis
A statistical package (Statistica 7.0, StatSoft Inc, Tulsa, OK, USA) was used for descriptive statistics and data analysis. Repeated measures ANOVA (Re- ANOVA) was used for overall effects, and post hoc paired t-tests with Bonferroni correction were used to determine if there were pair-wise differences (p<0.05). P-values were adjusted for epsilon using Geisser-Greenhouse correction when the variances of the differences between effects were not equal.
RESULTS
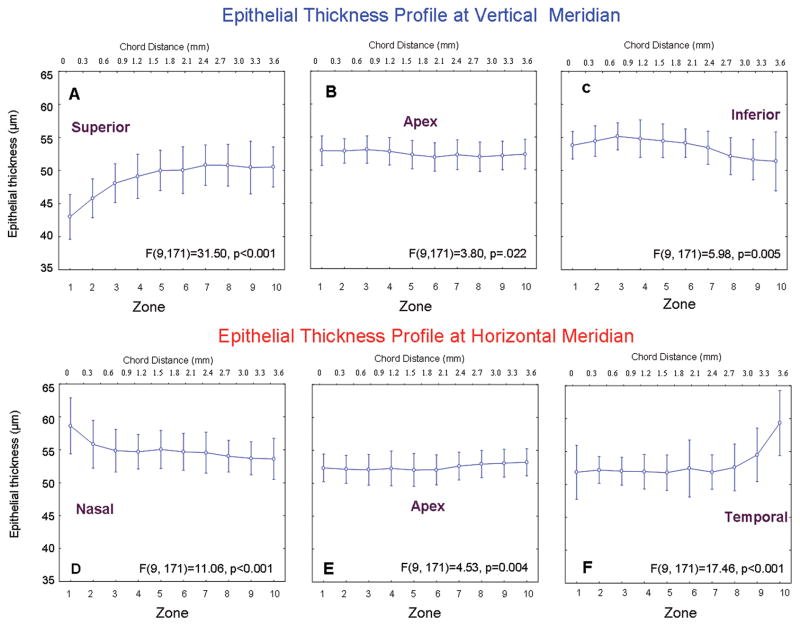
There were no significant changes between the two baseline measurements in the epithelial thickness along horizontal or vertical meridians (p>0.05). The average of the two measurements was used for the epithelial thickness profile (Fig. 6). For the vertical meridian, the baseline superior peripheral epithelium was thinnest at the edge of Bowman's layer, 42.9±4.1 μm in Zone 1 (Fig. 6A). The thickness gradually increased (P < 0.001) towards the pericentral cornea, reaching 49.5 – 50.4 μm in Zones 4 – 10 (Fig. 6A). The central epithelium thickness averaged 52.5±2.4 μm (Fig. 6B). The inferior peripheral epithelium was thickest in Zone 8, 55.2± 2.5 μm, and then decreased, reaching 51.3±5.1 μm in Zone 1 (post hoc, p<0.01 between Zones 10-3 and 1-2) at the edge of Bowman's layer (Fig. 6C). This thickness was not significantly different from Zone 6 in the central cornea (p > 0.05, Fig. 6B).
Figure 6. Baseline epithelial thickness profile.
The epithelial thickness profiles at the vertical (A – C) and horizontal (D – F) meridians were obtained by scanning different locations. Each scan consisted of 1000 lateral A-scans over a chord distance of 3.78 mm (upper scale) and was divided into 10 equal zones (lower scale). For the peripheral profiles, Zone 1 began at the edge of Bowman’s layer. Bars denote 95% confidence intervals.
For the horizontal meridian, the baseline thickness of peripheral nasal epithelium in Zone 1 was 58.6±5.1 μm. It decreased gradually to 53.6±3.7 μm in Zone 10 (p<0.01, Fig. 6D). The thickness of the central epithelium was uniform from the nasal to the temporal side, averaging 52.0±2.3μm (Fig. 6E). The epithelium in temporal peripheral Zone 10 was similar in thickness to the central epithelium. However, beginning in Zone 2, it increased sharply to 59.3±6.6 μm in Zone 1 (Fig. 6F), which was not significantly different from the Zone 1 value in the nasal region (p > 0.05).
After the baseline UHR-OCT images were taken, they were repeated at 6 and 8 hours later. There were no significant changes in the epithelial thickness at any location along either the horizontal or vertical meridians (Fig. 7, p>0.05).
Figure 7. Daytime variation of epithelial thickness profile.
The epithelial thickness profile was imaged at baseline, 6, and 8 hours for both eyes of 20 subjects. After 6 and 8 hours, there were no significant changes in epithelial thickness for any location along the vertical (A – C) or horizontal (D – F) meridians (P > 0.05). Bars denote 95% confidence intervals.
DISCUSSION
Based on a variety of methods, central epithelial thickness has been reported with values varying from 50 to 60 μm.11,12,15,20,21, 32,33 Prior to 2005 there were no reported differences between central and peripheral thicknesses, and the epithelium was considered to have a uniform depth.11,15 However, with recent improvements of measurement accuracy and area of acquisition, the general finding has been that the peripheral epithelial thickness is greater than the central thickness in normal eyes.10,21 Our study here is one of the few that addresses thoroughly the thickness profile of the central and peripheral epithelium in both the vertical and horizontal meridians.
The central epithelial thickness reported here, 51.4 μm – 53.2 μm, is consistent with previously reported OCT values.11,18 However, there appears to be a large discrepancy in the peripheral thickness measurements, especially around the vertical meridian. Using a modified OCT instrument with scan width of 1.13 mm and an axial resolution of 10 μm, Haque et al.33 measured corneal and epithelial thicknesses across four meridians in normal eyes. They found that the peripheral epithelial thickness was greater than the central thickness. The thickest location, 68 μm, was in the superior region, and the thinnest, 58 μm, was in the inferior region. Their results were opposite to the only other study of the time, which used high-frequency digital ultrasound,21 but they did not attempt to explain the differences. A likely explanation for this dissimilarity is the selection of a suitable and readily identifiable landmark from which the measurements were made. In our high resolution images, the ending of Bowman’s layer was an easily differentiated landmark. Apparently in older studies using relatively lower axial resolution devices, it was not possible to clearly identify it. The epithelium at the peripheral transparent area before the end of Bowman’s layer was thinner than the area near to or at the limbus that they measured. With our 7.45 mm scan width, the thinnest point could be screened in a single scan from the peripheral region defined as the 1000 pixels from the landmark towards the apex. In the study by Haque et al.,33 the limited scan width and the absence of any landmarks may have caused them to miss the thinnest point in the superior region in their “point by point” constructed map. The standard deviations obtained in our study were remarkably lower than those reported by others,10,18,23,33 which implies that our method is more repeatable. Thus, the epithelial thickness profile that we reported here is in agreement with the values obtained by very high-frequency digital ultrasound.20,21 Both approaches show that the epithelium increases in thickness from the superior to inferior cornea, with the center being nearly as thick as the inferior region.
There may be several explanations of why the superior peripheral corneal epithelium is thinner than the inferior portion. First, anatomically the upper lid impinges directly on the superior 2 mm of the cornea while the lower lid covers less of the inferior peripheral cornea in most normal eyes. This suggests that the corneal epithelium becomes modified by the long term constant depression of the upper lid. Secondly, as Reinstein et al.34 originally suggested, blinking and friction on the cornea may regulate the corneal epithelial thickness profile. The eyelid might effectively be chafing the surface epithelium during blinking, with greater forces applied on the superior cornea than on the inferior cornea,35,36 thus thinning the superior epithelium. The weakness of the superior epithelial barrier could also explain the occurrence of superior epithelial arcuate lesions (SEALs) that can occur with conventional soft contact lens wear.37 Finally, the gravity-dependent flow of the tear film from the superior to the inferior corneal surface may contribute to the relative thinness of the superior epithelium. The average tear film is approximately 3 μm thick in the center;38 however in this study, we did not assess it. Thus this variation of the tear film thickness in the periphery may have induced an overestimation of epithelial thickness in the inferior region.
This is the first study that attempted to determine if the topographical thickness of the epithelium along the vertical and horizontal meridians changes over time. We were unable to identify any thickness changes in the central corneal epithelium during the 8-hour study period, which is in agreement with the findings by Feng et al.17 Using time domain OCT, they found diurnal variation of the central epithelium in eyes with patches, but not in control eyes. Although UHR-OCT appears to be suitable for imaging the epithelial profile, further improvements are necessary to image the entire map of the epithelium and study short term changes such as those that might occur after eye opening.
Understanding the baseline profile and normal physiologic variation in corneal epithelial thickness is imperative to provide a basic reference parameter for clinical and laboratory research. This information can increase the accuracy of corneal refractive surgery as epithelial changes play a role in refractive regression.39 Knowledge of the corneal epithelial profile may also be of interest in the fitting and wear of contact lenses. Further studies concerning ocular surface changes after contact lens wear and changes associated with different types of lenses are warranted. In addition, although a lot of complications associated with contact lens wear can be easily observed in routine clinic examinations, it is difficult to detect subtle sub-clinical alterations of the ocular surface and quantify these changes. The application of UHR-OCT may lead to a more complete and deeper understanding of the mechanism and early diagnosis of these complications.
There are some limitations in this study. First, there may have been some overlap in the segmented regions of the central and peripheral cornea used to yield the epithelial profile. This could have lead to a slight bias in this region. However, this bias would not have affected the comparison between superior and inferior peripheral regions where there were significant differences. Second, the opening between the eyelids was voluntarily expanded when the vertical meridian was imaged. It was difficult to quantify the magnitude of eyelid opening and corneal exposure, so there may have been some variability between subjects in the evaporation and movement of the tear film that could induce subtle effects in the final epithelium thickness measurements.40 Finally, a single refractive index of 1.389 was used in the present study for calculation of the epithelium. According to the results by Vasudevan et al.41, we may have had about 0.25% underestimate of the epithelial thickness in the peripheral region, which may be too small to be meaningful. However, with these differences in refractive indices, the difference between the central and the peripheral thicknesses at horizontal meridian would be larger, supporting our conclusions.
To the best of our knowledge, this was the first study using UHR-OCT to measure corneal epithelial thickness profiles across the peripheral and central cornea in the vertical and horizontal meridians, and to assess daytime variation of the full corneal epithelial thickness profile in normal eyes. The epithelial thickness was not evenly distributed in the vertical and meridional planes. The epithelial depth thinned from the inferior to the superior regions across the vertical meridian, and it symmetrically thickened from the central to temporal and nasal regions across the horizontal meridian. The epithelial thickness profile was stable during the 8 hour daytime period of observation.
Figure 5. Schematic of optical correction of the epithelial profile.
The algorithm was applied to correct each pixel on the back surface to restore its geometric location in the image. The epithelium thickness was measured around each axis between the front interface and corrected back interface.
Acknowledgments
Grant/financial support: This study was supported by research grants from Vistakon, NIH Center Grant P30 EY014801 and Research to Prevent Blindness (RPB).
Other acknowledgement
We thank Britt Bromberg, PhD, Xenofile Editing, for providing editing services for this manuscript.
Footnotes
Financial Disclosures: Jianhua Wang is a recipient of the Vistakon research grant. The other authors have no proprietary interest in any materials or methods described within this article.
Contributions to authors
Design of the study (AT, JW); Conduct of the study, data collection, analysis and interpretation (CD, LC, MS, YY); Manuscript preparation and review (CD, JW, MS, LC).
Statement about conformity The Institutional Review Board for Human Research of the University of Miami approved this study.
References
- 1.Krachmer JH, Mannis MJ, Holland E. Cornea:Fundamentals, Diagnosis and Management. Philadelphia: Elsevler-Mosby; 2005. pp. 3–26. [Google Scholar]
- 2.Zagon IS, Sassani JW, Ruth TB, McLaughlin PJ. Epithelial adhesion complexes and organ culture of the human cornea. Brain Res. 2001;900:205–213. doi: 10.1016/s0006-8993(01)02296-x. [DOI] [PubMed] [Google Scholar]
- 3.Patel S, Marshall J, Fitzke FW., III Refractive index of the human corneal epithelium and stroma. J Refract Surg. 1995;11:100–105. doi: 10.3928/1081-597X-19950301-09. [DOI] [PubMed] [Google Scholar]
- 4.Radford SW, Lim R, Salmon JF. Comparison of Orbscan and ultrasound pachymetry in the measurement of central corneal thickness. Eye (Lond) 2004;18:434–436. doi: 10.1038/sj.eye.6700669. [DOI] [PubMed] [Google Scholar]
- 5.Rainer G, Findl O, Petternel V, Kiss B, Drexler W, Skorpik C, Georgopoulos M, Schmetterer L. Central corneal thickness measurements with partial coherence interferometry, ultrasound, and the Orbscan system. Ophthalmology. 2004;111:875–879. doi: 10.1016/j.ophtha.2003.09.027. [DOI] [PubMed] [Google Scholar]
- 6.Kawana K, Tokunaga T, Miyata K, Okamoto F, Kiuchi T, Oshika T. Comparison of corneal thickness measurements using Orbscan II, non-contact specular microscopy, and ultrasonic pachymetry in eyes after laser in situ keratomileusis. Br J Ophthalmol. 2004;88:466–468. doi: 10.1136/bjo.2003.030361. [DOI] [PMC free article] [PubMed] [Google Scholar]
- 7.Realini T, Lovelace K. Measuring central corneal thickness with ultrasound pachymetry. Optom Vis Sci. 2003;80:437–439. doi: 10.1097/00006324-200306000-00009. [DOI] [PubMed] [Google Scholar]
- 8.Tam ES, Rootman DS. Comparison of central corneal thickness measurements by specular microscopy, ultrasound pachymetry, and ultrasound biomicroscopy. J Cataract Refract Surg. 2003;29:1179–1184. doi: 10.1016/s0886-3350(02)01921-1. [DOI] [PubMed] [Google Scholar]
- 9.Bechmann M, Thiel MJ, Neubauer AS, Ullrich S, Ludwig K, Kenyon KR, Ulbig MW. Central corneal thickness measurement with a retinal optical coherence tomography device versus standard ultrasonic pachymetry. Cornea. 2001;20:50–54. doi: 10.1097/00003226-200101000-00010. [DOI] [PubMed] [Google Scholar]
- 10.Feng Y, Simpson TL. Comparison of human central cornea and limbus in vivo using optical coherence tomography. Optom Vis Sci. 2005;82:416–419. doi: 10.1097/01.opx.0000162649.97059.72. [DOI] [PubMed] [Google Scholar]
- 11.Feng Y, Simpson TL. Corneal, limbal, and conjunctival epithelial thickness from optical coherence tomography. Optom Vis Sci. 2008;85:E880–E883. doi: 10.1097/OPX.0b013e318185272d. [DOI] [PubMed] [Google Scholar]
- 12.Wang J, Fonn D, Simpson TL. Topographical thickness of the epithelium and total cornea after hydrogel and PMMA contact lens wear with eye closure. Invest Ophthalmol Vis Sci. 2003;44:1070–1074. doi: 10.1167/iovs.02-0343. [DOI] [PubMed] [Google Scholar]
- 13.Patel SV, McLaren JW, Hodge DO, Bourne WM. Confocal microscopy in vivo in corneas of long-term contact lens wearers. Invest Ophthalmol Vis Sci. 2002;43:995–1003. [PubMed] [Google Scholar]
- 14.Erickson P, Comstock TL, Zantos SG. Is the superior cornea continuously swollen? Clin Exp Optom. 2002;85:168–171. doi: 10.1111/j.1444-0938.2002.tb03030.x. [DOI] [PubMed] [Google Scholar]
- 15.Perez JG, Meijome JM, Jalbert I, Sweeney DF, Erickson P. Corneal epithelial thinning profile induced by long-term wear of hydrogel lenses. Cornea. 2003;22:304–307. doi: 10.1097/00003226-200305000-00005. [DOI] [PubMed] [Google Scholar]
- 16.Ivarsen A, Laurberg T, Moller-Pedersen T. Characterisation of corneal fibrotic wound repair at the LASIK flap margin. Br J Ophthalmol. 2003;87:1272–1278. doi: 10.1136/bjo.87.10.1272. [DOI] [PMC free article] [PubMed] [Google Scholar]
- 17.Feng Y, Varikooty J, Simpson TL. Diurnal variation of corneal and corneal epithelial thickness measured using optical coherence tomography. Cornea. 2001;20:480–483. doi: 10.1097/00003226-200107000-00008. [DOI] [PubMed] [Google Scholar]
- 18.Sin S, Simpson TL. The repeatability of corneal and corneal epithelial thickness measurements using optical coherence tomography. Optom Vis Sci. 2006;83:360–365. doi: 10.1097/01.opx.0000221388.26031.23. [DOI] [PubMed] [Google Scholar]
- 19.Radhakrishnan S, Rollins AM, Roth JE, Yazdanfar S, Westphal V, Bardenstein DS, Izatt JA. Real-time optical coherence tomography of the anterior segment at 1310 nm. Arch Ophthalmol. 2001;119:1179–1185. doi: 10.1001/archopht.119.8.1179. [DOI] [PubMed] [Google Scholar]
- 20.Reinstein DZ, Silverman RH, Raevsky T, Simoni GJ, Lloyd HO, Najafi DJ, Rondeau MJ, Coleman DJ. Arc-scanning very high-frequency digital ultrasound for 3D pachymetric mapping of the corneal epithelium and stroma in laser in situ keratomileusis. J Refract Surg. 2000;16:414–430. doi: 10.3928/1081-597X-20000701-04. [DOI] [PubMed] [Google Scholar]
- 21.Reinstein DZ, Archer TJ, Gobbe M, Silverman RH, Coleman DJ. Epithelial thickness in the normal cornea: three-dimensional display with Artemis very high-frequency digital ultrasound. J Refract Surg. 2008;24:571–581. doi: 10.3928/1081597X-20080601-05. [DOI] [PMC free article] [PubMed] [Google Scholar]
- 22.Wang J, Aquavella J, Palakuru J, Chung S. Repeated measurements of dynamic tear distribution on the ocular surface after instillation of artificial tears. Invest Ophthalmol Vis Sci. 2006;47:3325–3329. doi: 10.1167/iovs.06-0055. [DOI] [PMC free article] [PubMed] [Google Scholar]
- 23.Wang J, Fonn D, Simpson TL, Sorbara L, Kort R, Jones L. Topographical thickness of the epithelium and total cornea after overnight wear of reverse-geometry rigid contact lenses for myopia reduction. Invest Ophthalmol Vis Sci. 2003;44:4742–4746. doi: 10.1167/iovs.03-0239. [DOI] [PubMed] [Google Scholar]
- 24.Akiba M, Maeda N, Yumikake K, Soma T, Nishida K, Tano Y, Chan KP. Ultrahigh-resolution imaging of human donor cornea using full-field optical coherence tomography. J Biomed Opt. 2007;12:041202. doi: 10.1117/1.2764461. [DOI] [PubMed] [Google Scholar]
- 25.Wang J, Jiao S, Ruggeri M, Shousha MA, Chen Q. In situ visualization of tears on contact lens using ultra high resolution optical coherence tomography. Eye Contact Lens. 2009;35:44–49. doi: 10.1097/ICL.0b013e31819579f2. [DOI] [PMC free article] [PubMed] [Google Scholar]
- 26.Shousha MA, Perez VL, Wang J, Ide T, Jiao S, Chen Q, Chang V, Buchser N, Dubovy SR, Feuer W, Yoo SH. Use of ultra-high-resolution optical coherence tomography to detect in vivo characteristics of Descemet's membrane in Fuchs' dystrophy. Ophthalmology. 2010;117:1220–1227. doi: 10.1016/j.ophtha.2009.10.027. [DOI] [PMC free article] [PubMed] [Google Scholar]
- 27.Zhao M, Kuo AN, Izatt JA. 3D refraction correction and extraction of clinical parameters from spectral domain optical coherence tomography of the cornea. Opt Express. 2010;18:8923–8936. doi: 10.1364/OE.18.008923. [DOI] [PubMed] [Google Scholar]
- 28.Lin RC, Shure MA, Rollins AM, Izatt JA, Huang D. Group index of the human cornea at 1. 3-microm wavelength obtained in vitro by optical coherence domain reflectometry. Opt Lett. 2004;29:83–85. doi: 10.1364/ol.29.000083. [DOI] [PubMed] [Google Scholar]
- 29.Moezzi AM, Sin S, Simpson TL. Novel pachometry calibration. Optom Vis Sci. 2006;83:366–371. doi: 10.1097/01.opx.0000221403.32040.17. [DOI] [PubMed] [Google Scholar]
- 30.HANNA C, O'BRIEN JE. Cell production and migration in the epithelial layer of the cornea. Arch Ophthalmol. 1960;64:536–539. doi: 10.1001/archopht.1960.01840010538009. [DOI] [PubMed] [Google Scholar]
- 31.Simon G, Ren Q, Kervick GN, Parel JM. Optics of the corneal epithelium. Refract Corneal Surg. 1993;9:42–50. [PubMed] [Google Scholar]
- 32.Wirbelauer C, Pham DT. Monitoring corneal structures with slitlamp-adapted optical coherence tomography in laser in situ keratomileusis. J Cataract Refract Surg. 2004;30:1851–1860. doi: 10.1016/j.jcrs.2004.01.035. [DOI] [PubMed] [Google Scholar]
- 33.Haque S, Jones L, Simpson T. Thickness mapping of the cornea and epithelium using optical coherence tomography. Optom Vis Sci. 2008;85:E963–E976. doi: 10.1097/OPX.0b013e318188892c. [DOI] [PubMed] [Google Scholar]
- 34.Reinstein DZ, Silverman RH, Trokel SL, Coleman DJ. Corneal pachymetric topography. Ophthalmology. 1994;101:432–438. doi: 10.1016/s0161-6420(94)31314-5. [DOI] [PubMed] [Google Scholar]
- 35.Bentivoglio AR, Bressman SB, Cassetta E, Carretta D, Tonali P, Albanese A. Analysis of blink rate patterns in normal subjects. Mov Disord. 1997;12:1028–1034. doi: 10.1002/mds.870120629. [DOI] [PubMed] [Google Scholar]
- 36.Doane MG. Interactions of eyelids and tears in corneal wetting and the dynamics of the normal human eyeblink. Am J Ophthalmol. 1980;89:507–516. doi: 10.1016/0002-9394(80)90058-6. [DOI] [PubMed] [Google Scholar]
- 37.Holden BA, Stephenson A, Stretton S, Sankaridurg PR, O'Hare N, Jalbert I, Sweeney DF. Superior epithelial arcuate lesions with soft contact lens wear. Optom Vis Sci. 2001;78:9–12. doi: 10.1097/00006324-200101010-00008. [DOI] [PubMed] [Google Scholar]
- 38.King-Smith PE, Fink BA, Fogt N, Nichols KK, Hill RM, Wilson GS. The thickness of the human precorneal tear film: evidence from reflection spectra. Invest Ophthalmol Vis Sci. 2000;41:3348–3359. [PubMed] [Google Scholar]
- 39.Reinstein DZ, Ameline B, Puech M, Montefiore G, Laroche L. VHF digital ultrasound three-dimensional scanning in the diagnosis of myopic regression after corneal refractive surgery. J Refract Surg. 2005;21:480–484. doi: 10.3928/1081-597X-20050901-10. [DOI] [PubMed] [Google Scholar]
- 40.King-Smith PE, Fink BA, Nichols JJ, Nichols KK, Braun RJ, McFadden GB. The contribution of lipid layer movement to tear film thinning and breakup. Invest Ophthalmol Vis Sci. 2009;50:2747–2756. doi: 10.1167/iovs.08-2459. [DOI] [PubMed] [Google Scholar]
- 41.Vasudevan B, Simpson TL, Sivak JG. Regional variation in the refractive-index of the bovine and human cornea. Optom Vis Sci. 2008;85:977–981. doi: 10.1097/OPX.0b013e3181886fa5. [DOI] [PubMed] [Google Scholar]


