Syndecan-1 is a heparan sulfate proteoglycan expressed by both normal and multiple myeloma (MM) plasma cells. Matsui et al.1 reported the identification of a potential MM “stem cell” resembling less differentiated post germinal center B cells. These cells lacked expression of CD138 but expressed the B-cell antigens CD19 and CD20 as well as surface light chain. Recently, a population of drug resistant and less mature CD138-negative human myeloma cell line (HMCL) cells, which could be the cause of relapse in multiple myeloma, has been described.2,3 We have examined the characteristics of these CD138 negative (CD138−) MM cells and would like to comment on the important discrepancies observed.
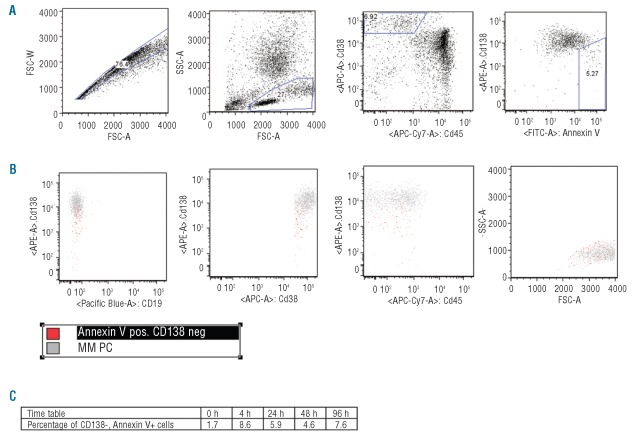
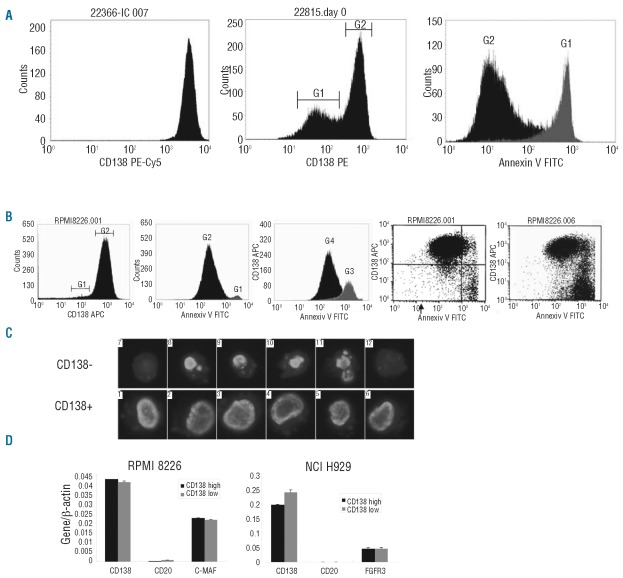
Thirty-one bone marrow (BM) samples from myeloma patients (30 obtained at time of diagnosis and one at relapse) and two human myeloma cell lines (RPMI 8226 and NCI H929) were analyzed by flow cytometry using the same antibodies as described by Matsui et al.1 Gating strategies are shown in Figure 1. In all primary MM plasma cells (PCs) analyzed immediately after sample taking, only a single population of MM PCs with respect to CD138 was observed (Figure 2A). However, when the time from sampling to analysis was increased, a CD138− population as reported by Matsui et al.1 was seen (Figure 2A). Therefore, in agreement with Jourdan et al.,4 we found that for primary MM cells an important factor was time from sampling to flow cytometric analysis, with the largest drop in CD138 expression in the first 3–4 h from sampling. Because apoptotic PCs show a selective loss of CD138 surface expression,4 we included Annexin V in all analyses to monitor the onset of apoptosis. In all cases, if a CD138− population was present, these cells were positive for Annexin V (Figure 2A). However, they did not differ in expression of CD19/CD45 and forward-side scatter characteristics, but typically had a less intense CD38 expression (Figure 1). In optimal growing HMCLs, only a single population of MM PCs with respect to CD138 was observed (Figure 2B). Although rare CD138− cells could be present (Figure 2B), these cells were always Annexin V positive (Figure 2B). Under different conditions, a CD138− population as described by Matsui et al.1 could be generated in both HMCLs. The size of the CD138- population was dependent on initiation of new cell culture, starvation, or treatment with 10−5 M dexamethasone. As in primary MM cells, CD138− cells were always positive for Annexin V (Figure 2B). To support the Annexin V data and to investigate whether, as suggested,1 the CD138− subpopulation had a different morphology, we used Laser Scanning Cytometry (LSC) to obtain the morphology of the CD138 positive (CD138+) versus CD138− populations observed in Figure 2A. Figure 2C shows LSC images of a CD138/nuclear (DAPI, 4′-6-diamidino-2-phenylindole) staining illustrating intact MM PCs in the CD138+ gate and cells with apoptotic morphology in the CD138− gate.
Figure 1.
Gating strategy and CD138- surface markers. (A) A fresh sample BM aspirate from MM patients were run immediately after sample taking. MNC were gated on FSC/SSC characteristics. Then MM PCs were identified on CD38/CD45 dot-plot. CD138 versus Annexin V was evaluated, for gating of CD138- versus CD138+ cells. (B) Surface expression of CD19, CD38, CD45 and FSC/SSC of CD138− (red) versus CD138+ (gray) population. A minimum of 100,000 events were acquired. (C) Time-table of CD138-, Annexin V+ cells at 0, 4, 24, 48 and 96 h.
Figure 2.
Characterizing CD138− MM cells. (A) Left: a fresh BM sample. Middle: a BM sample analyzed 3 h after sample taking. G1 defines a population of cells with a decreased CD138 expression. G2 defines CD138+ cells. Right: Annexin V histogram of the same BM sample shown in the middle histogram. G1 is defined in middle histogram and includes Annexin V positive cells. G2 is defined in middle histogram and includes Annexin V negative cells. (B) Left histogram, optimal growing RPMI 8226. G1 includes possible CD138− cells. G2 includes CD138+ cells. Middle histogram: Annexin V histogram of the same RPMI 8226 sample shown in left histogram. G1 is defined in left histogram and includes Annexin V positive cells. G2 is defined in left histogram and includes Annexin V negative cells. Right histogram: RPMI 8226 treated with 10-5 M dexamethasone for 3 h. G3 defines Annexin V positive cells and G4 defines Annexin V negative cells. Left dot-plot: Annexin V versus CD138 expression of optimal growing RPMI8226. Right dot-plot of RPMI cells after 72 h of dexamethasone. (C) LSC images of DAPI stained CD138− and CD138+ MM cells. (D) Q-RT-PCR for FACS-sorted CD138 subsets. A MM specific oncogene expressed by the HMCL was used as a control gene.
We further characterized CD138− cells using qPCR assays for CD138 and CD20 on FACS-sorted HMCL cells (Figure 2D). A high and similar level of CD138 mRNA was detected in both CD138− and CD138+ MM cells showing that the CD138 gene is turned on equally in the two cellular subsets. On MM cells, there is a rapid turnover of surface CD1385,6 and the rapid loss of CD138 on apoptotic cells is probably caused by a combination of decreased protein synthesis and increased proteolytic cleavage in these cells.7–9 Furthermore, neither flow cytometry nor qPCR was able to identify a differential expression of CD19 and CD20 between the CD138− and CD138+ sub-populations (Figure 2D). We conclude that the CD138− cellular subset reported seems to represent an apoptotic artifact probably due to sample handling and procedures.
Footnotes
The information provided by the authors about contributions from persons listed as authors and in acknowledgments is available with the full text of this paper at www.haematologica.org.
Financial and other disclosures provided by the authors using the ICMJE (www.icmje.org) Uniform Format for Disclosure of Competing Interests are also available at www.haematologica.org.
References
- 1.Matsui W, Huff CA, Wang Q, Malehorn MT, Barber J, Tanhehco Y, et al. Characterization of clonogenic multiple myeloma cells. Blood. 2004;103(6):2332–6. doi: 10.1182/blood-2003-09-3064. [DOI] [PMC free article] [PubMed] [Google Scholar]
- 2.Fuhler GM, Baanstra M, Chesik D, Somasundaram R, Seckinger A, Hose D, et al. Bone marrow stromal cell interaction reduces syndecan-1 expression and induces kinomic changes in myeloma cells. Exp Cell Res. 2010;316(11):1816–28. doi: 10.1016/j.yexcr.2010.03.013. [DOI] [PubMed] [Google Scholar]
- 3.Matsui W, Wang Q, Barber JP, Brennan S, Smith BD, Borrello I, et al. Clonogenic multiple myeloma progenitors, stem cell properties, and drug resistance. Cancer Res. 2008;68(1):190–7. doi: 10.1158/0008-5472.CAN-07-3096. [DOI] [PMC free article] [PubMed] [Google Scholar]
- 4.Jourdan M, Ferlin M, Legouffe E, Horvathova M, Liautard J, Rossi JF, et al. The myeloma cell antigen syndecan-1 is lost by apoptotic myeloma cells. Br J Haematol. 1998;100(4):637–46. doi: 10.1046/j.1365-2141.1998.00623.x. [DOI] [PubMed] [Google Scholar]
- 5.Mahtouk K, Hose D, Raynaud P, Hundemer M, Jourdan M, Jourdan E, et al. Heparanase influences expression and shedding of syndecan-1, and its expression by the bone marrow environment is a bad prognostic factor in multiple myeloma. Blood. 2007;109(11):4914–23. doi: 10.1182/blood-2006-08-043232. [DOI] [PMC free article] [PubMed] [Google Scholar]
- 6.Yang Y, Macleod V, Miao HQ, Theus A, Zhan F, Shaughnessy JD, Jr, et al. Heparanase enhances syndecan-1 shedding: a novel mechanism for stimulation of tumor growth and metastasis. J Biol Chem. 2007;282(18):13326–33. doi: 10.1074/jbc.M611259200. [DOI] [PubMed] [Google Scholar]
- 7.Homburg CH, de Haas M, von dem Borne AE, Verhoeven AJ, Reutelingsperger CP, Roos D. Human neutrophils lose their surface Fc gamma RIII and acquire Annexin V binding sites during apoptosis in vitro. Blood. 1995;85(2):532–40. [PubMed] [Google Scholar]
- 8.Ihrcke NS, Platt JL. Shedding of heparan sulfate proteoglycan by stimulated endothelial cells: evidence for proteolysis of cell-surface molecules. J Cell Physiol. 1996;168(3):625–37. doi: 10.1002/(SICI)1097-4652(199609)168:3<625::AID-JCP15>3.0.CO;2-Y. [DOI] [PubMed] [Google Scholar]
- 9.Reiland J, Ott VL, Lebakken CS, Yeaman C, McCarthy J, Rapraeger AC. Pervanadate activation of intracellular kinases leads to tyrosine phosphorylation and shedding of syndecan-1. Biochem J. 1996;319(Pt 1):39–47. doi: 10.1042/bj3190039. [DOI] [PMC free article] [PubMed] [Google Scholar]


