

Abstract
Liquid chromatography tandem mass spectrometry (LC–MS/MS) based methods provide powerful tools for the quantitative analysis of modified proteins. We have developed a label-free approach using internal reference peptides (IRP) from the target protein for signal normalization without the need for isotope labeling. Ion-trap mass spectrometry and pseudo-selected reaction monitoring (pSRM) were used to acquire full MS/MS and MS3 spectra from target peptides. Skyline, a widely used software for SRM experiments, was used for chromatographic ion extraction. Phosphopeptides spiked into a BSA background yielded concentration response curves with high correlation coefficients (typically >0.9) and low coefficients of variation (≤15%) over a 200-fold concentration range. Stable isotope dilution (SID) and IRP methods were compared for quantitation of six site-specific phosphorylations in the epidermal growth factor receptor (EGFR) in epidermal growth factor-stimulated A431 cells with or without the addition of EGFR inhibitors cetuximab and gefitinib. Equivalent responses were observed with both IRP and SID methods, although analyses using the IRP method typically had higher median CVs (22–31%) than SID (10–20%). Analyses using both methods were consistent with immunoblot using site-selective antibodies. The ease of implementation and the suitability for targeted quantitative comparisons make this method suitable for broad application in protein biochemistry.
Keywords: ion-trap mass spectrometry, label-free quantitation, phosphoprotein, epidermal growth factor receptor
Introduction
Posttranslational protein modifications (PTM), such as phosphorylation, are difficult to quantify because they are highly dynamic, present on proteins at low levels, and often of low stoichiometries. Quantitative analysis of PTM has been achieved using liquid chromatography tandem mass spectrometry (LC–MS/MS).1−4 Global quantification of phosphorylation or other PTM typically employs isotope labeling by chemical derivatization (e.g., iTRAQ) or metabolic incorporation of stable isotope-labeled amino acids in cell culture (SILAC).5−8 Stable isotope dilution provides the highest precision for quantitative MS studies;7−9 however, it requires both synthesis and amino acid analysis for each peptide of interest. The cost associated with SID quanatitive analyses becomes cost-prohibitive when many targets need to be analyzed.
An alternative to stable isotope labeling strategies is the use of commonly performed and accepted “label free” quantitation methods. These methods fall broadly into two groups, spectral counting and integrating MS1 peak areas. Although spectral counting methods compares favorably to stable isotope labeling in both precision and accuracy for quantifying proteins in shotgun proteomics analyses,10,11 the sampling of individual modified peptide spectra by “data-dependent MS/MS” is insufficient in capturing enough spectra to use this method for quantification at the peptide level. Quantification by integrated MS1 signals for specific peptide ions is performed by extraction of selected ion chromatograms from LC–MS data sets.12−14 Although a higher resolution instrument, such as an LTQ-Orbitrap or Q-TOF, may improve the background for an MS1 signal, this instrumentation may not be readily available for these experiments. In addition, the MS1 signal does not distinguish between sites of differentially modified peptides, particularly problematic when the peptides cannot be chromatographically resolved, and MS1 signals for lower level peptides (such as modified peptiedes) are frequently hindered because of significant background noise. Ion traps also have the ability to perform MS3, which is not possible with Q-TOF intruments. In many cases, analysis of PTM is done on purified proteins or simple mixtures, such as immunoprecipitates, expressed proteins, or proteins purified by chromatography or electrophoresis. In such cases, the need to quantify a stoichiometric change in a modification frequently follows the initial identification of modified forms. Since the modified form has been identified, the MS/MS spectral characteristics of the modified peptides of interest are known. In this context, the goal is targeted quantitation of changes to specific proteins, rather than a quantitative global survey. Here we describe the validation of a label-free approach to measure quantitative changes in modifications to specific proteins. The approach uses targeted LC–MS/MS analysis with extracted selected reaction monitoring (pseudo-SRM or pSRM) using a linear ion-trap mass spectrometer to enable selective detection and further quantification of modified peptides. We have implemented full support for this workflow in version 1.1 of the software tool Skyline (http://proteome.gs.washington.edu/software/skyline/), a widely used, freely available tool for SRM anlaysis.15 To correct for run-to-run variations in signal intensities, pSRM signals for the target peptides are normalized to signals from unmodified reference peptides from the same protein, which we termed the internal reference peptide (IRP) method. Although we and others have described similar quantification methods previously,12,16−23 here we performed proof-of-principle experiments that allowed us to validate the method, define its performance characteristics and compare them to stable isotope dilution, which is the accepted “gold standard” for SRM-based quantitation. We further assessed the performance of pSRM using both MS/MS and MS3 data for quantification. We describe the application of the IRP method to analyze phosphorylated forms of epidermal growth factor receptor (EGFR), an extensively characterized receptor tyrosine kinase and a target for several clinically used anticancer drugs. Our data demonstrate the proficiency of the IRP method to quantify site-specific changes in EGFR phosphorylation in response to modulation by EGF and the two tyrosine kinase inhibitors, cetuximab and gefitinib.
Experimental Procedures
Materials and Reagents
Acetonitrile and HPLC-grade water were from Mallinckrodt Baker (Phillipsburg, NJ), and 98% pure formic acid was from EMD (Darmstadt, Germany). Trypsin gold was purchased from Promega (Madison, WI), dithiothreitol (DTT) from Pierce (Rockford, IL), and iodacetamide was from Sigma (St. Louis, MO). The A431 cell line was obtained from ATCC (Manassas, VA), improved MEM media, and PBS were purchased from Invitrogen-GIBCO (Auckland, NZ). Media supplement, fetal bovine serum, was from Atlas Biologicals (Fort Collins, CO). For Western blotting, primary antibodies forphosphotyrosine site 1172, phosphotyrosine site 998 and EGFR were purchased from Cell Signaling Technology (Danvers, MA). Primary antibodies were detected using antirabbit and antimouse secondary antibodies conjugated with Fluorophore 680 from Invitrogen (Carlsbad, CA) and imaged using the LI-COR Odyssey Imager system with 3.0 application software (Lincoln, NE). All gels (NuPAGE), Western blot membranes and gel reagents (LDS, PVDF membrane, and SimplyBlue SafeStain) were purchased from Invitrogen (Carlsbad, CA). Individual components of the NETN lysis buffer, protease inhibitor cocktail and phosphatase inhibitor cocktail (see below) were purchased from Sigma (St. Louis, MO). Beads for immunoprecipitations, Protein A and Protein G were purchased from ThermoScientific (Rockford, IL) and Roche (Indianapolis, IN), respectively.
Synthetic phosphorylated peptides, DRVpYIHPF and IKNLQpSLDPSH, were purchased as part of the Phosphopeptide Standard I from Protea Biosciences (Morgantown, WV). Bovine serum albumin (BSA) was purchased from ThermoScientific (Rockford, IL). Four C-terminal isotopically labeled phosphotyrosine peptides containing U–13C6, U–15N4-arginine or U–13C6, U–15N2-lysine from EGFR (Y998–MHLPSPTDSNFpYR, Y1110–RPAGSVQNPVpYHNQPLNPAPSR, Y1172–GSHQISLDNPDpYQQDFFPK, and Y1197–GSTAENAEpYLR) were purchased from New England Peptide, LLC (Gardner, MA) at ≥95% chemical purity based on amino acid analysis. EGFR antibody and cetuximab were a gift from Dr. Robert Coffey; gefitinib was a gift from Dr. Carlos Arteaga, both from Vanderbilt–Ingram Cancer Center (Nashville, TN).
Phosphopeptide/BSA Spike Experiments
Synthetic phosphopeptide mixture (DRVpYIHPF and IKNLQpSLDPSH) was resuspended in 0.1% formic acid to a concentration of 500 pmol mL–1, and peptides were spiked into 100 μL of 6.0 μg mL–1 (6 ng of BSA) tryptic digest of BSA at concentrations ranging from 0.01 to 2.0 fmol ng–1 of BSA (which corresponds to 0.064–12.8 fmol μL–1) in 0.1% formic acid. The BSA tryptic digest was performed on 200 μg of 2 mg mL–1 of BSA. The sample was diluted in ammonium bicarbonate, reduced in 45 mM DTT at 55 °C for 20 min, alkylated in the dark at room temperature for 20 min using 100 mM iodoacetamide, and digested with 4 μg of trypsin overnight at 37 °C. An aliquot of this digest was diluted with 0.1% formic acid to a final concentration of 6.0 μg mL–1.
Cell Culture
A human epithelial carcinoma cell line (A431) was cultured in 150 mm culture dishes in improved MEM supplemented with 10% fetal bovine serum at 37 °C in 5% CO2. A431 cells were grown to ∼60–70% confluency prior to harvesting (control or treatment). All treated cells were serum-starved (18 h), followed by treatment with 30 nmol epidermal growth factor (EGF) for 20 min or incubated with either 10 μg mL–1 cetuximab or 500 nmol gefitinib for 30 min followed by subsequent stimulation with EGF for 20 min. Cells were harvested on ice with Mg and Cl-free PBS supplemented with a phosphatase inhibitor cocktail (1 mM sodium fluoride, 10 mM β-glycerophosphate, 1 mM sodium molybdate, and 1 mM activated sodium orthovanadate), pelleted by centrifugation at ∼250g, flash-frozen, and stored at −80 °C.
Immunoprecipitation, Western Blot, and Sample Preparation
Cell pellets were lysed by resuspension in NETN lysis buffer (50 mM Tris-HCl, pH 7.5, 150 mM NaCl, 1% Igepal, and 5% glycerol) containing protease inhibitors (0.5 mM 4-(2-aminoethyl)benzenesulfonyl fluoride hydrochloride, 10 mM aprotinin, 1 mM leupeptin, 1.5 μM E-64, 5 μM betastatin, and 1 μM pepstatin A) and the phosphatase inhibitor cocktail and incubated on ice for 25 min prior to mechanical lysis by sonication. After cell lysis, suspensions were cleared by centrifugation at 9400g for 5 min. The bicinchoninic acid assay (protein standard was bovine serum albumin) was used to measure the protein concentration of the cell lysate. A 100 μg aliquot of total cell lysate was collected as input control and combined with 4X LDS buffer and DTT for a final concentration of 1X and 50 mM, respectively. A 3 mg portion of the remaining cleared lysate was incubated at 4 °C for 1.5 h with cetuximab at a ratio of 5 μg of cetuximab for every 1 mg of cell lysate. A 30 μL portion of pre-equilibrated protein A and protein G resin (1:1 v/v) was added to the suspension and incubated with the lysate for 45 min at 4 °C. The suspension was then centrifuged at ∼200g for 2 min at 4 °C. The supernatant was removed and the resin washed three times with NETN lysis buffer. Protein(s) were eluted by treating beads for 5 min at 85 °C in 2X LDS buffer and 50 mM DTT. Samples were fractionated in NuPAGE 10% Bis-Tris SDS–PAGE gels using MOPS buffer. Gels were either prepared for Western blot by transferring proteins to PVDF membrane or stained (for 1 h) using SimplyBlue SafeStain followed by destaining in deionized water overnight.
Targeted MS analysis was performed on the digested EGFR gel regions. Briefly, the EGFR protein bands were excised and rinsed with 100 mM ammonium bicarbonate (pH 8.0). Gel pieces were reduced with 50 mM DTT at 60 °C for 30 min, followed by alkylation with 100 mM iodoacetamide in the dark at ambient temperature for 20 min, and digested with 200 ng trypsin overnight at 37 °C. Peptides were extracted from the gel three times with 60% acetonitrile/0.1% formic acid (v/v). Peptides were concentrated in vacuo (SpeedVac concentrator, Thermo-Fisher, Waltham, WA) and reconstituted in 30 μL of 5% acetonitrile and 0.1% formic acid with 12.5 fmol μL–1 of isotopically labeled peptides spiked in for LC–pSRM–MS analysis.
Mass Spectrometry and Data Analyses
LC–pSRM–MS and MSn analyses were performed on a ThermoFisher LTQ Velos (San Jose, CA) mass spectrometer equipped with an Eksigent Nano-1D Plus HPLC and AS-1 autosampler (Dublin, CA). Peptides were separated on a 100 μm × 11 cm fused silica capillary column (Polymicro Technologies, LLC., Phoenix, AZ) and 100 μm × 6 cm fused silica capillary precolumn packed with 5 μm, 300 Å Jupiter C18 (Phenomenex, Torrance, CA). Liquid chromatography was performed using a 95 min gradient at a flow rate of either 400 or 600 nL min–1 using a gradient mixture of 0.1% (v/v) formic acid in water (solvent A) and 0.1% (v/v) formic acid in acetonitrile (solvent B). Briefly, a 15 min wash period (100% solvent A) was performed followed by a gradient to 98% A at 15 min (1.2 μL min–1), and eluent was diverted to waste prior to the analytical column using a vented column set up similar to that previously described.24 Following removal of residual salts, the flow was redirected to flow through the analytical column and solvent B increased to 75% over 35 min and up to 90% in 65 min. The column was re-equlibrated to 98% solvent A for 10 min after each run. All peptides were analyzed using targeted analysis of doubly and/or triply charged ions to acquire the complete MS/MS spectrum. MS3 analysis was performed on the neutral loss of phosphoric acid for phosphopeptides IKNLQpSLDPSH (Protea peptide), MHLPpSPTDSNYR, and GSHQIpSLDNPDYQQDFFPK (both EGFR phosphopeptides) in addition to MS/MS analysis. Typical targeted parameters include an isolation width of two bracketed around the m/z of interest, a fragmentation time of 10 ms, normalized collision energy of 35.0, spray voltage of 1.8 kV, and capillary temperature at 200 °C.
Data was analyzed using either Xcalibur software (ThermoFisher, San Jose, CA) to determine extracted ion current peak area for 3–5 transitions for each targeted peptide or the full scan MS/MS filtering feature in Skyline 1.1 software.15 Each phosphopeptide was normalized by dividing the individual phosphopeptide (sum of three or four ion transitions/peptide) by either the individual reference peptides (sum of three or four ion transitions/peptide) or the sum of all of the references (unmodified internal peptides from BSA or EGFR) peptides.
Skyline Implementation
Full support for pSRM using chromatograms extracted from targeted MS/MS spectra for peak area calculations was implemented in the Skyline software tool, as shown in Figures 2, 6 and S1 (Supporting Information), and released in version 1.1. These new features included method export for ThermoFisher LTQ instruments as well as chromatogram extraction from MS/MS spectra at targeted product ion mass-to-charge ratios, making available for pSRM many existing Skyline features proven in SRM experiments with triple quadrupole mass spectrometers.
Figure 2.

Skyline display from replicate peak areas and imported targeted full MS and MS/MS data from a high (2.0 fmol ng–1 BSA), medium (0.2 fmol ng–1 BSA), and low (0.02 fmol ng–1 BSA) concentration of a phosphorylated peptide (DRVpYIHPF) spiked into BSA. Samples were run on a Thermo Fisher LTQ-Velos, low-resolution instrument. The precursor ion, in blue, is filtered from MS1 scans taken at the beginning of each cycle. At lower concentrations, interference becomes an issue for the precursor in the MS1 scans; however, the filtered product ions from the targeted MS/MS remain selective and free from interference producing a clear chromatographic peak. Replicate peak areas show the reproducibility of the peaks and their composition from the fragment ion (tandem MS) traces.
Figure 6.

Skyline display from replicate peak areas and imported targeted MS/MS data to produce pSRM traces for GSTAENAEpYLR from A431 cells not treated (proliferating), modulated with EGF, or cotreated with inhibitor (cetuximab or gefitinib) followed by EGF. Samples were acquired using a Thermo Fisher LTQ-Velos. Replicate peak areas show the reproducibility of the peaks and their composition from the pSRM traces.
Statistical Methods
The relationship between response and concentration was modeled by applying a weighted least-squares with the robust linear model using Tukey’s biweight to down-weight potential outliers. This model25 assumes that measurement standard deviation increases linearly with concentration. The model also accounts for nonlinear behavior at low concentrations by incorporating change-points. Selection of change points is based on Akaike’s information criterion (AIC), where the optimal model is the one with the minimum AIC. The fitted model provided three summary statistics: correlation coefficient (r2), slope, and coefficient of variation (CV). The details of the methods have been described previously.8,25
Results
Overview of Analytical Approach
This work describes quantitative analysis of post-translationally modified (PTM) peptides by pSRM together with either stable isotope dilution (SID) or a new IRP method. The pSRM experiments are targeted MS/MS analyses performed by producing a full MS/MS spectrum for each precursor m/z in a target list using a linear ion trap mass spectrometer (LTQ Velos). Transitions are extracted from the full MS/MS or MS3 spectrum and peak areas for transitions are summed and normalized to areas for a reference standard. For stable-isotope dilution (SID), the summed peak area is normalized to summed peak areas for transitions from a stable isotope labeled peptide standard. In the IRP method, one or more unmodified proteotypic peptides from the target protein serve as the reference standard for the modified peptides in the analysis. Because the target modified peptides and the reference standard are present in the same protein, the IRP method corrects for variations in recovery of the protein in the analysis. Normalized signals increase or decrease with a corresponding increase or decrease in the stoichiometry of the modification.
Analyses of Phosphopeptides Spiked into a BSA Digest
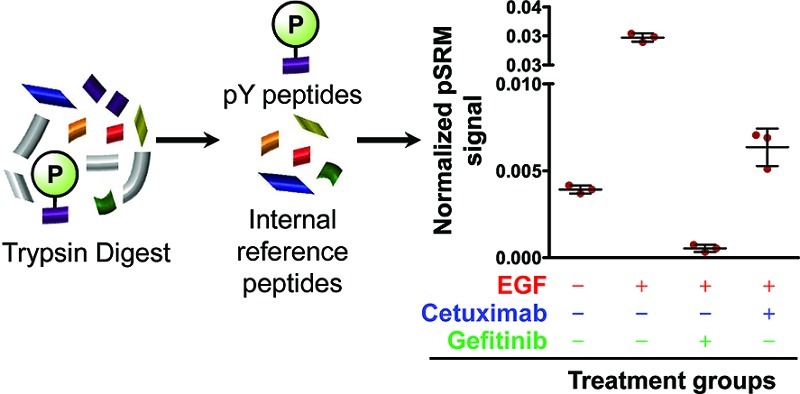
To test the ability of the IRP method to detect differences in modification stoichiometry as changes in normalized pSRM ratio, we performed proof-of-principle experiments by spiking synthetic phosphopeptides into a BSA background (see Figure 1). The peptides, DRVpYIHPF (angiotensin II) and IKNLQpSLDPSH (cholecystokinin 10–20), were spiked into 100 μL of 6 μg mL–1 BSA digest at 0.01, 0.02, 0.05, 0.10, 0.20, 0.50, 1.0, and 2.0 fmol ng–1 BSA. These concentrations were chosen to mimic the low abundance phosphorylation events that occur in biological systems;12 these spike concentrations correlated to 0.12–14% stoichiometry relative to BSA.
Figure 1.
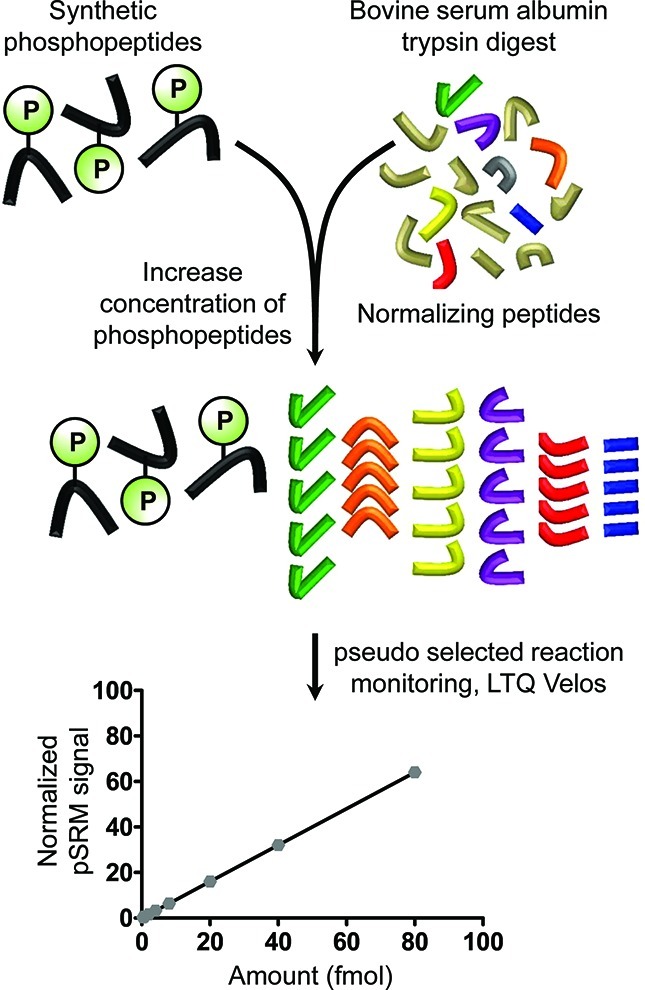
Internal reference peptide proof-of-principle experiment. Synthetic phosphopeptides were spiked into a standard bovine serum albumin (BSA) protein digest at increasing concentrations (0.064–12.8 fmol μL–1). Phosphorylated peptides were targeted employing pSRM using a linear ion-trap mass spectrometer. Data is normalized by dividing targeted phosphorylated peptide peak area (sum of three to four transitions) by BSA peptide peak areas (sum of three transitions).
Concentration–response curves were generated by analyzing each concentration point (five replicate LC–MS injections) on an LTQ Velos linear ion trap using pSRM. For each spiked peptide, extracted ion chromatograms (XICs) for three to four transitions were chosen based on stability (low variability in peak area), sequence, or modification-specific transitions (when possible) and strong transition signals. Figure 2 outlines the MS1 and product ion filtering feature in Skyline showing chromatographic profiles for the high (2.0 fmol ng–1 BSA) and low (0.02 fmol ng–1 BSA) concentration of phosphorylated peptide spiked into BSA. This figure clearly demonstrates the advantage of the pSRM over MS1 signal extraction to quantify at lower concentrations due to the increased specificity leading to a greater signal-to-noise. We also acquired these data using an LTQ-Orbitrap with the tandem MS collected on the LTQ portion of the experiment and the MS1 collected in the Orbitrap portion of the instrument. The MS1 signal in the Orbitrap was significantly improved in the Orbitrap and the pSRM results were essentially the same (data not shown). The peptide sequences, precursor m/z and specific transitions extracted are listed in Table S41 (Supporting Information). The sum of transition peak areas for phosphopeptides was divided either by (a) the sum of transition peak areas for individual reference BSA peptides or by (b) the sum of the transition peak areas for all reference BSA peptides. To assess the ability to use MS3 measurements for quantification of protein modifications, MS3 of the neutral loss ion [M + 3H – H3PO4]3+ of phosphopeptide IKNLQpSLDPSH was also measured.
MS/MS and MS3 data from five replicate LC–MS analyses of BSA digests spiked with both phosphopeptides were normalized by the IRP method and concentration response curves are shown in Figure S3 (Supporting Information). Concentration–response curve slopes, correlation coefficients (r2), and coefficients of variation (CV) for all reference peptides are presented in Table 1. Individual plots for all of the measured peptides are shown in Figures S5–S7 (Supporting Information) and plots of the median CVs for all replicates are in Figure 3. Despite the fact that all of the normalization peptides were derived from an equal amount of BSA in the sample, values for r2, slope, and CV for normalization varied. CV values ranged from 7.3 to 15.7% (median 10%). The the utilization of the BSA reference peptide YICDNQDTISSK for quantation of the phosphorylated peptides yielded the highest r2 values (≥0.96), lowest slope, and lowest median CV (≤10.8%) compared to the other reference peptides. Similar values for r2, slope, and CV were obtained for both MS/MS and MS3 measurements. The highest median CV was observed at the lowest phosphopeptide spike amount (0.128 fmol) for both phosphopeptides (MS/MS and MS3 data; Figure 3, Supporting Information). Plots derived using single BSA reference peptides and using the sum of all BSA reference peptides are presented in Figures S8–S10 (Supporting Information). These experiments were performed on a linear ion trap with automatic gain control (AGC), which limits filling of the trap at higher ion currents, thus potentially limiting linear dynamic range. In these studies, IRP-normalized signals appeared linear over the 200-fold concentration range examined, which suggests that AGC has little impact on response under the conditions of our analyses.
Table 1. Phosphopeptides and Corresponding Reference Peptides Used for Normalization: r2 Value, Slope, and CV Are Calculated for Five Technical Replicates.
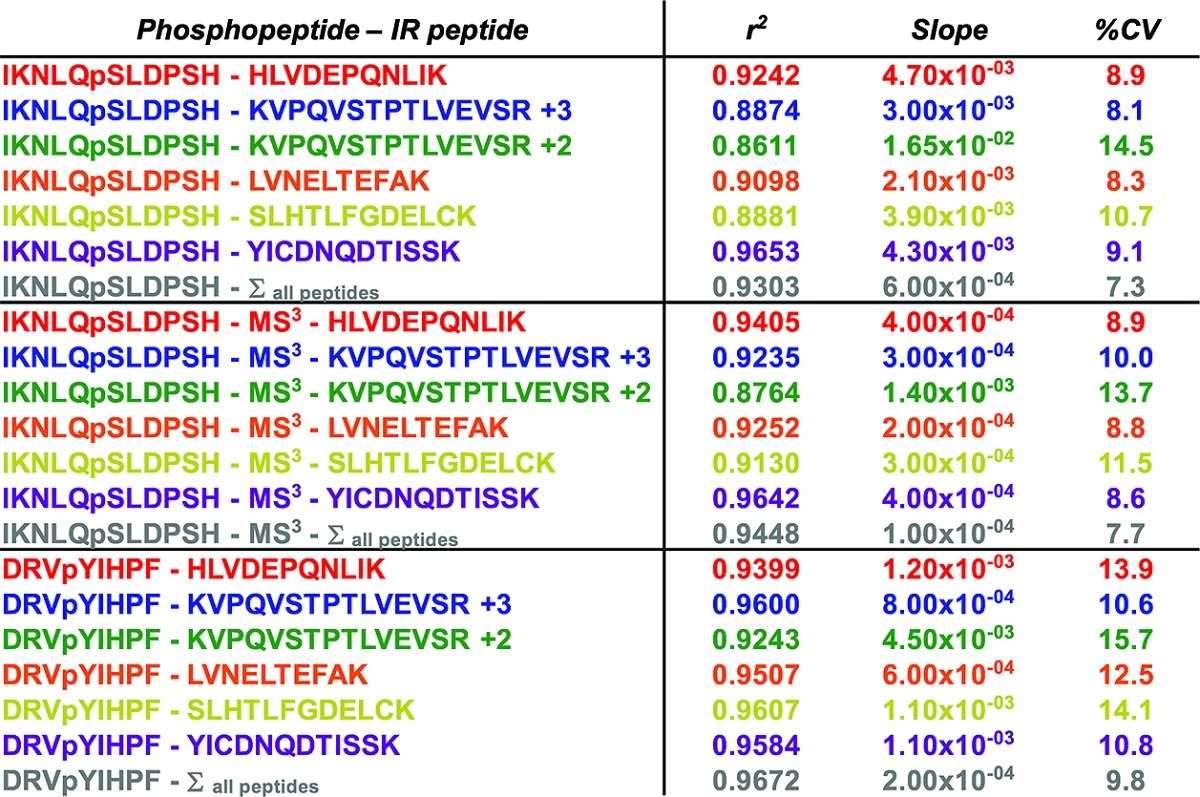
Figure 3.

Median CV across technical replicates plotted against amount of spiked in phosphorylated peptide standards. Data point colors correspond to reference peptide used for normalization. The median CVs decrease as the amount of phosphopeptide spiked in background (BSA digest) increases.
Comparison of IRP Method and SID-Based Quantitation of Site-Specific Phosphorylation in EGFR
To evaluate the performance of the IRP method for relative quantification of specific protein phosphorylation sites, we examined the changes in phosphorylation levels in EGFR regulated by EGF stimulation and inhibition. An EGFR overexpressing human epithelial carcinoma cell line, A431, was harvested (1) prior to any cell treatment (proliferating cells), (2) after serum starvation overnight and stimulation with EGF, (3) after cotreatment with 10 μg mL–1 cetuximab (monoclonal antibody inhibitor of EGFR) and EGF, and (4) after cotreatment with 500 nM gefitinib (small molecule EGFR tyrosine kinase inhibitor) and EGF.
Immunoblot analyses were performed pre- and post IP for each treatment group for total EGFR and specific pY sites Y998 and Y1172. EGFR specific pY sites Y998 and Y1172 were chosen for immunoblot analysis because both sites have high-quality, commercially available site-specific antibodies. Phosphorylation at both residues has been linked to pertinent EGFR biology with Y998 representing a phosphorylation site implicated in receptor endocytosis and Y1172 representing a site of autophosphorylation. The purpose of these studies was not to produce equal levels of inhibition but to produce detectable differences in phosphorylation between stimulated and inhibited states using at least two known inhibitors of EGFR. The amount of receptor phosphorylation at sites Y998 and Y1172 in A431 cells (Figure 5) was significantly elevated in EGF treated samples over proliferating controls. As expected, both cetuximab and gefitinib inhibitor treatments decreased the amount of tyrosine phosphorylation detected when compared to EGF treatment alone. The EGFR tyrosine kinase inhibitor gefitinib at 500 nM decreased tyrosine phosphorylation below basal levels at both sites, whereas at a dose of 10 μg mL–1, cetuximab was not as effective at inhibiting EGFR phosphorylation.
Figure 5.
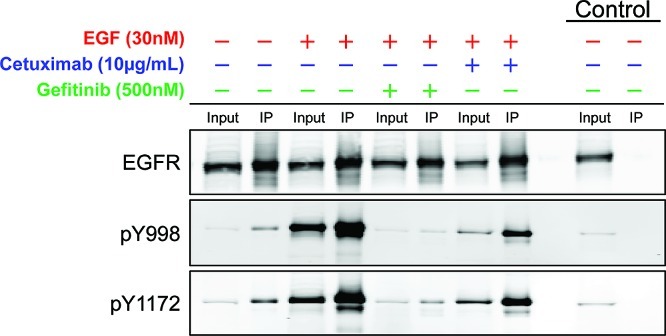
A431 cells untreated, modulated with EGF, or cotreated with inhibitor (cetuximab or gefitinib) followed by EGF exhibit different EGFR activation statuses. Immunoblot showing EGFR activation prior to and after treatment(s) (phosphorylation at Y998 and Y1172). Both phosphorylated forms of the receptor were targeted in the pSRM-MS method. Input lane is 5% of total protein load, and IP lane is post-immunoprecipitation. Control lanes show the IP performed using mouse IgG. All treated cells were serum-starved overnight prior to any treatment.
For quantitative LC–MS/MS experiments, EGFR was immunoprecipitated from the A431 cells with cetuximab in the presence of protease and phosphatase inhibitors, separated on an SDS-PAGE gel, and the EGFR band was excised and digested in-gel with trypsin (Figure 4). Modified peptides corresponding to phosphorylation at sites Y998 (MHLPSPTDSNFpYR), Y1110 (RPAGSVQNPVpYHNQPLNPAPSR), Y1172 (GSHQISLDNPDpYQQDFFPK), Y1197 (GSTAENAEpYLR), S991 (MHLPpSPTDSNFYR), and S1166 (GSHQIpSLDNPDYQQDFFPK) within EGFR were targeted for quantification using pSRM. Figure 6 shows the extracted ion chromatograms using Skyline for Y1197 for each treatment type. Phosphoserine sites (S991 and S1166) also were monitored using MS3 of the 98 Da neutral loss ion corresponding to the neutral loss of phosphoric acid. Stable isotope-labeled peptides corresponding to sites Y998, Y1110, Y1172, and Y1197 were spiked in prior to pSRM analysis to permit comparison of the IRP and SID methods for quantitation. Five unmodified peptides from EGFR were selected for normalization using the IRP method. The location and domain position (extracellular, juxtamembrane, tyrosine kinase or cytoplasmic) of each reference and phosphorylated peptide in EGFR is presented in Figure S11 (Supporting Information). Internal reference peptides were selected based on high signal stability and a wide range of elution times (see Figure S12, Supporting Information). For each targeted peptide monitored, XICs were selected for three to five transitions that indicate modification specificity (when possible) and that generated strong pSRM transitions signals. Although modification site-specific transitions do not always produce sufficient signal for quantitation, they frequently can be used to verify the site of modification. In the case of Y998 vs S991 phosphorylation, we were able to verify the site not only with modification site-specific fragment ions but also with the comparison to the Y998 phosphorylated synthetic peptide. Extracted ion chromatograms for peptides Y998 and S991 (MHLPSPTDSNFpYR and MHLPpSPTDSNFYR, respectively; shown in Figure S2, Supporting Information) demonstrate baseline separation of these species under our experimental conditions. Since only one or two modification site-specific transitions were detected, these ions were used primarily to distinguish the two distinct phosphorylated peptide signals. We utilized a few nonspecific transitions for quantitation since baseline separation was achieved. It is possible that the digestion of this peptide may be hindered when the tyrosine is phosphorylated (given its proximity to the tryptic cleavage site); we assumed that the relative amounts of both peptides (MHLPSPTDSNFpYR and MHLPpSPTDSNFYR) with respect to treatment should remain unaffected and digestion should be reproducible, thus the conclusion is the same. We believe that this assumption is reasonable since we are not comparing the absolute amount of these two peptides and our data was consistent among the three biological replicates. The absolute amount of the Y998 peptide estimated by SID, however, may be affected by this potential for missed cleavage. The peptide sequences, precursor m/z, and specific transitions are listed in Table S13, Supporting Information. Peak areas were calculated from the sum of transitions for the phosphopeptides and then divided by the peak areas for EGFR internal reference peptides (for IRP) or its stable isotope-labeled standards (for SID). Three biological replicates were performed for each treatment group and three LC–pSRM–MS injections for each sample.
Figure 4.

(A) Illustration of the immunoprecipitation (IP) method for EGFR and treatment groups utilized in these experiments. After IP, the EGFR corresponding band on SDS PAGE gel was excised and targeted analysis performed on an LTQ Velos mass spectrometer. (B) Representation of the analytical approach for normalizing six EGFR phosphorylated peptides to internal reference peptides (IRPs). IRPs are unmodified peptides within the protein of interest, in these experiments, EGFR.
To evaluate the performance of the IRP method, we compared CV values for measurements using different IRP peptides together with SID analyses for each of the six EGFR phosphorylation sites analyzed (Table 2). Plots of CVs for technical replicate analyses from each of three biological replicate experiments are presented in Figures S14–S19 (Supporting Information). Median CV values varied considerably for IRP measurements with different normalization peptides. Normalization to the EGFR peptide IPLENLQIIR yielded the lowest global CV (median 22%), whereas the other normalization peptides NLQEILHGAVR (median 27%), EISDGDVIISGNK (median 27%), GLWIPEGEK (median 26%), and ITDFGLAK (median 32%) displayed modestly greater variation. CV values differed between distinct biological replicate experiments. In our studies, biological replicate experiments 1 and 2 displayed lower variability, with median CVs from different IRP peptides averaging approximately 30%, whereas biological replicate experiment 3 yielded more variation. This higher variation was caused by individual technical replicate runs (individual injections on the mass spectrometer using the same sample), some of which produced low signal across the chromatogram. Because these pSRM analyses employed ion trap analyzers, we were able to compare ion injection times for low-signal versus high-signal runs. Technical replicate runs with low-signal displayed considerably longer ion injection times and correspondingly low signal for summed MRM transitions (compare Figures S20–21 (low-signal run) with Figures S22–23 (high-signal run), Supporting Information. This phenomenon was most likely due to instrumental issue, such as an incomplete injection or some other signal failure in the mass spectrometer. In all of the experiments, the SID method yielded significantly greater measurement precision with a global median CV of 15%.
Table 2. Phosphopeptides and Corresponding Reference Peptides Used for Normalization–CV Range and Median CV Is Calculated Across Technical Replicates (Three Total) for Each Treatmenta.
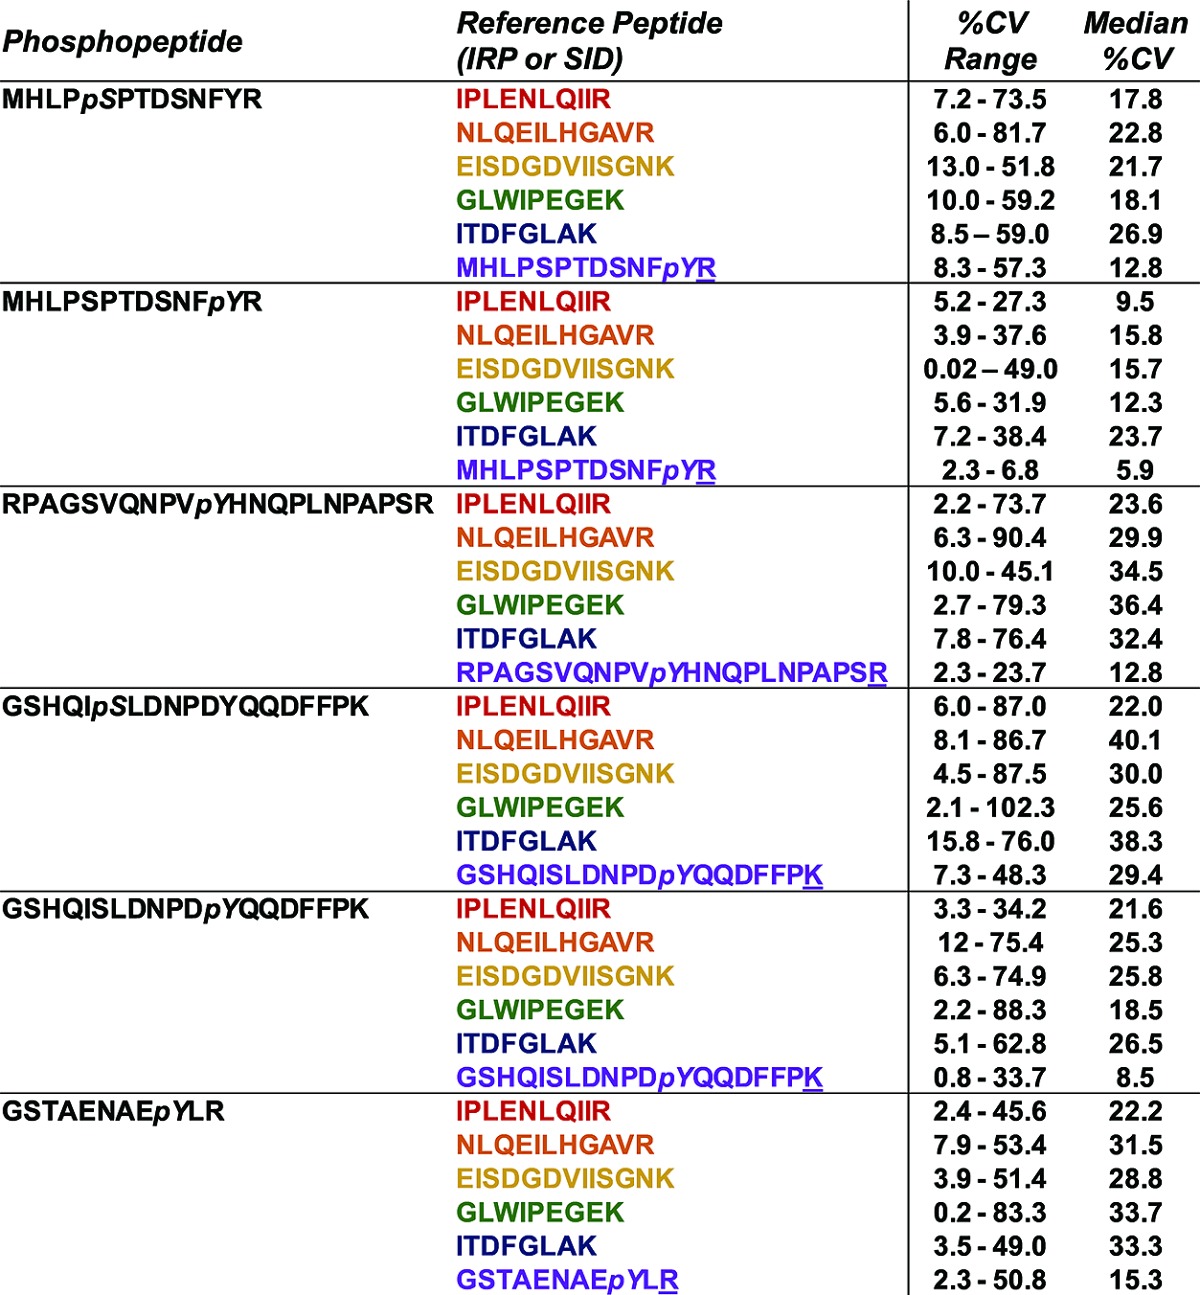
This data encompasses all three biological replicates. The underlined amino acid indicates which amino acid was stable isotope-labeled.
The data generated by analyses of immunoprecipitated EGFR from biological experiment 1 by the IRP and SID methods are shown in Figure 7. Both methods yielded similar measures of phosphorylation at Y1172 (GSHQISLDNPDpYQQDFFPK), its stimulation by EGF, and inhibition by cetuximab and gefitinib (Figure 7A,B). The IRP method produced similar results to SID for all four phosphotyrosine sites (Y998, Y1110, Y1172, and Y1197) (Figure 7C and Figures S24–S27, Supporting Information). These results are also consistent with the immunoblot analysis for Y1172 shown in Figure 5. EGF-treated stimulation produced the highest normalized pSRM signal, whereas samples cotreated with 500 nM gefitinib showed profound decreases in Y1172 phosphorylation to below basal (proliferating) levels. Co-treatment with cetuximab produced less inhibition in Y1172 phosphorylation to near basal levels. Figure 7C represents the degree of site-specific phosphorylation relative to that for EGF stimulation by a phosphorylation index, which was calculated as the ratio of the proliferating (P), gefitinib (G+E), or cetuximab (C+E) normalized pSRM signal to the EGF stimulated normalized pSRM signal (eq 1). Although we monitored the corresponding peptides without phosphorylation (data not shown), we did not see any appreciable changes in the quantitation of these peptides, most likely due to the low stoichiometry of the phosphorylation (data not shown).
| 1 |
Figure 7.

Treatment groups show the same trends when pY peptides are normalized to an internal reference peptide or its stable isotope labeled counterpart. EGFR peptide pY1172 (GSHQISLDNPDpYQQDFFPK) normalized to an (A) internal reference peptide (IPLENLQIIR) and (B) its pY SID peptide standard. (C) Phosphorylation index for each EGFR pY peptide and cell treatment group. Similar trends are observed for each pY targeted peptide after normalization to an IRP (red) or its stable isotope labeled counterpart (purple). The phosphorylation index is normalized to EGF (100%) stimulated cells. These data represent three technical LC–pSRM–MS injections of biological replicate 1. ND, not detected in LC–pSRM–MS experiments. The underlined amino acid indicates which amino acid was stable isotope-labeled. For biological replicate 1, CV values ranged between 9.8–47% and 7.3–32% for the IRP and SID method, respectively. The higher CV values were generated from Geftinib + EGF samples, and the median CV values ranged were 21% and 24%, respectively.
Both IRP (IPLENLQIIR) and SID methods yielded similar results and consistently detected similar phosphorylation status differences among the four treatment groups.
Analysis of EGFR Phosphoserine Modifications Using MS3 Measurements
For pS and pT peptides whose MS/MS spectra are dominated by neutral loss of H3PO4, measurements based on MS3 fragmentation of the neutral loss ion may offer higher confidence sequence-specific detection. MS3 measurements for relative quantification of phosphoserine modifications were performed on peptides for EGFR sites S991 (MHLPpSPTDSNFYR) [M + 2H – H3PO4]2+ and S1166 (GSHQIpSLDNPDYQQDFFPK) [M + 3H – H3PO4]3+. Peak areas from MS3 measurements were normalized to MS/MS-derived peak areas for the 5 EGFR IRP sequences described above, as well as to the MS/MS-derived peak areas for the isotope-labeled pY peptide standards used for SID analyses of the pY forms of these sequences (see above). Median CV plots using the IRP method for S991 and S1166 phosphopeptides (Figures S18 and S19, Supporting Information) indicate that normalization to the IPLENLQIIR peptide produced the smallest measurement variation, which was comparable to that achieved with normalization to the synthetic pY SID peptide sequence analogs. Both analysis methods yielded similar estimates of phosphorylation changes induced by EGF and the effects of cetuximab and gefitinib (Figure 8 and Figures S28 and S29, Supporting Information).
Figure 8.

MS3 trend plots for two phosphoserine modified peptides based on treatment group. Phosphopeptide pS991 (MHLPpSPTDSNFYR) normalized to an (A) IRP or (B) pY SID peptide standard (MHLPSPTDSNFpYR) shows similar trends. These data are similar to trends observed for pY peptide MHLPSPTDSNFpYR. Phosphopeptide pS1166 (GSHQIpSLDNPDYQQDFFPK) normalized to an (C) IRP or (D) pY SID peptide standard (GSHQISLDNPDpYQQDFFPK) show similar trends. These data show that MS3 measurements can be used for quantification of protein modifications. These data represent three technical injects of biological replicate 2. The underlined amino acid indicates which amino acid was stable-isotope labeled.
Phosphorylation levels for S991 display a pattern similar to that for the four phosphotyrosines described above. Phosphorylation at S991 increased after EGF treatment compared to basal (proliferating) levels and were reversed, although not completely, by both inhibitors. This result differs somewhat from the near complete reversal of phosphotyrosine modification we observed above for gefitinib. Similar results for S991 phosphorylation were reported by Stover et al.,26 who used mass spectrometry analyses to detect S991 phosphorylation induced by EGF stimulation and inhibited by the EGFR inhibitor PK166.
In contrast, similar analyses of phosphorylation at S1166 (GSHQIpSLDNPDYQQDFFPK) using both methods indicated a very different pattern. EGF treatment produced little or no S1166 phosphorylation, although gefitinib further decreased phosphorylation at this site. The lack of significant EGF-induced phosphorylation at S1166 is consistent with a previous study that employed a mass spectrometry method.16 On the other hand, combined cetuximab and EGF produced the highest amount of phosphorylation at S1166.
Discussion
Our major goal in this work was to evaluate the IRP method for quantifying changes in protein PTM and to demonstrate the utility of pSRM for quantification. Although we have previously reported a similar approach,22,23 we describe here the performance characteristics of the method in comparison to SID. We further describe the implementation of MS/MS and MS3-based pSRM measurements on an LTQ Velos ion trap instrument. The pSRM transitions can be extracted from MS/MS and MS3 data, normalized to peak areas from reference peptides within the same protein, thus affording relative quantification of protein modifications. Unlike MRM data, pSRM data records a full MS/MS spectrum for each monitored peptide, which allows for spectrum verification by visual inspection as well as the ability to choose different ions to extract based on PTM site (e.g., pS, pT vs pY) (see Figure 2 and Figures S1 and S2, Supporting Information). As with other MS-based methods, the IRP method can measure multiple site-specific phosphorylation sites in parallel without the need for site-specific antibodies and without potential concerns about antibody cross-reactivity and lack of phospho-site specificity. Although the method lacks the analytical precision of SID, the needless requirement for labeled internal standards, the ease of implementation and the suitability for typical quantitative comparisons, as illustrated with our analyses of EGFR phosphorylation, make this method suitable for broad application in protein biochemistry.
Previous label-free quantitation approaches have utilized estimated stoichiometry (ES), flyability ratios, the native reference peptide (NRP) method or the selected ion tracing method to quantify post-translational modifications.12,16−21 In all of these methods, XICs (ion currents) at the MS1 level are generated for each site specific modification as well as its unmodified peptide complement or an unmodified reference peptide. These methods calculate the stoichiometry (or site abundance) of individual post-translationally modified sites by taking the modified peptide peak area and normalizing to the sum of modified and unmodified peak area,21 to an unmodified reference peptide peak area18−20 or to the sum of unmodified peak area plus the peak area of any other possible sites of modification on the target peptide.16 A key difference between our approach and previous methods is the use of MS/MS extracted ion chromatograms rather than MS1 data for each modified and reference peptide. Unlike the ES method and other MS1-based methods, the pSRM utilizes MS/MS and MS3 data to obtain peptide sequence and site specific localization data, thus allowing not only verification of the site of modification but also site-specific quantitation even when peptide peaks cannot be resolved (see Figure 2 and Figure S1, Supporting Information).
Our initial proof-of-principle experiment analyzed two phosphopeptides spiked at increasing concentrations into a BSA digest. The simulated IRP method by pSRM achieved a linear response on the LTQ Velos ion-trap mass spectrometer across 2 orders of magnitude for all normalization peptides examined (Figure S3, Supporting Information). Some normalizing peptides produced a more consistent response, which correlated to lower variability (<10% CV, see Table 1). Although the higher end of the standard curve may exceed the concentration of modified peptide that would typically occur in a protein, we examined higher concentrations to determine whether the automatic gain control (AGC) affected linearity of response. Even at higher concentrations, where ion injection times were shortened by AGC (to limit the ions according to the set target intensity value), the detected response remained linear (see r2 values in Table 1) using these instrument settings. As expected, lower phosphopeptide concentrations yielded greater measurement variability, as indicated by higher median CV measurements (>30% median CV for 0.13 fmol (0.01 fmol ng–1 of BSA) phosphopeptide (Figure 3). Higher CV values are typical for peptide concentrations at or near the limit of detection due to the decreased signal-to-noise that is typically observed. It should be noted in these types of experiments there needs to be a balance between the approapriate maximum target intensity value and the ion injection time settings for AGC. We observed linearity in our proof-of-principle experiment despite a nearly 1000-fold difference between the reference peptide and modified peptide concentrations (lowest point modeled 0.12% stoichiometry). Large differences in signal intensities of the reference peptides and modified peptides may still create nonlinearity and space charging in ion traps may also affect quantitation, so this should be considered in instrument acquisition settings. Median CVs showed lower variations (≤20%) as phosphopeptide analyte concentration increased from 0.13 to 25.6 fmol (0.01 fmol ng–1 of BSA up to 2.00 fmol ng–1 of BSA) (Figure 3). Elevated CVs for both SID and IRP methods also were obtained in gefitinib- and EGF-treated samples, which typically had low levels of phosphorylated peptides and where signals approached the limit of detection (Figures S14–S19, Supporting Information).
In the BSA spike model, standard curves for the pS peptide IKNLQpSLDPSH (MS3 data) had r2 values, slopes, and CVs similar to or better than those obtained from MS/MS data when using the same normalizing peptide (Table 1). Although ion intensity for the MS3 spectra were approximately 10-fold lower than the MS/MS data, the MS3 data typically had better signal-to-noise ratios and thus similar or better CVs. MS3 data thus can be used for relative quantification of protein modifications, especially when MS/MS data of pS or pT containing peptides do not provide adequate fragment ion data for site-specific modification mapping or sequence determination. Higher order tandem MS experiments such as the MS3 measurements demonstrated here cannot be obtained in quadrupole mass analyzers traditionally used for quantification, but can be performed on ion trap instruments.
In the EGFR phosphorylation studies, internal reference peptides were chosen such that (1) they were known to be unmodified, (2) eluted across the chromatogram, (3) displayed consistent signal stability, (4) were observed in previous data dependent LC-MS/MS data, and (5) contained between 7 and 20 amino acids and preferably lacked methionine and cysteine residues. In these studies, we did not identify any other measures (e.g., location in LC elution time, similarity in peptide length/sequence, etc.) to predict the best IRP to use. Phosphopeptides were normalized individually to the each of the five internal reference peptides (ITDFGLAK, IPLENLQIIR, GLWIPEGEK, NLQEILHGAVR, and EISDGDVIISGNK). Individual analyses of the internal reference peptides indicated that some internal reference peptides showed large differences in the range and median CV plots (Figures S14–S19, Supporting Information). Our results show that multiple IRPs should be evaluated to optimize the performance of the IRP method and to ensure that any given reference peptide does not conflict with the results of the others. Ultimately, we chose the internal reference peptide with the lowest median CV (highest signal stability) in the data set, unless there were clear contradictory results to the other reference peptides (as was the case for the GLWIPEGEK reference peptide described below).
We studied biological variations of EGFR phosphorylation in A431 cells under four treatment conditions. Analyses with the IRP method using all internal reference peptides (except GLWIPEGEK) detected the same differences between treatments as did SID analyses. This demonstrates that moderate differences in measurement variation do not significantly impact the biological conclusions drawn from these studies. In our SID analysis of 4 analyzed phosphotyrosine sites in EGFR, median CVs ranged from 5 to 15%, whereas analyses with the IRP method (using reference peptide IPLENLQIIR) of the same four sites had median CVs around 20% (Figures S14–S19, Supporting Information). Although the median CV for the IRP method was greater than the SID method, the interpretation of phosphorylation differences with both methods is the same. We also monitored phosphorylation sites Y998 and Y1172 with commercially available antibodies and these analyses confirmed the mass spectrometry results (Figure 5). By all three methods (immunoblot, SID and IRP), gefitinib was a more potent inhibitor of EGFR than cetuximab at indicated concentrations; immunoblot analyses for Y998 and Y1172 were barely above background and both SID and IRP methods for sites Y998, Y1110, Y1172, and Y1197 were calculated to have a phosphorylation index <10% when compared to EGF treated cells. The corresponding nonphosphorylated peptides did not appear to significantly change in response to treatment. This is most likely due to the very low stoichiometry of these phosphorylations, consistent with previous studies.12
Analysis using MS3 spectra for two pS containing peptides in EGFR, MHLPpSPTDSNFYR (S991), and GSHQIpSLDNPDYQQDFFPK (S1166) yielded results consistent with previous literature reports.16,26 Phosphoserine peptide S991 follows the same overall changes as the four EGFR pY sites (Y998, Y1110, Y1172, and Y1197); with the exception that gefitinib was not a more potent inhibitor than cetuximab (i.e., at the concentrations used gefitinib and cetuximab have similar inhibitory effects on S991). Trends across the different treatment groups were consistent whether the MS3pS peptides were normalized to the isotope-labeled pY SID peptide standard or to the internal reference peptide with the lowest median CV (IPLENLQIIR). The effect of EGFR inhibitors on phosphorylation at site S1166 and site S991 has not previously been reported.
In these experiments, the SID and IRP methods were analyzed on a linear ion trap mass spectrometer (LTQ Velos), which can monitor ≤20 peptides in a single LC–pSRM–-MS experiment. While pSRM measurements do not provide the same throughput as triple quadrupole based MRM analyses (>30 peptides can be measured with four transitions in a single, unscheduled LC–triple quadrupole MRM analysis), the added benefit of the peptide sequence confirmation from the full MS/MS spectrum and the ability to acquire higher order tandem MS data are significant advantages. The pSRM approach also allows selection of the transition after MS/MS analysis as well as quantitation using fragment ions when MS1 data is poor (see Figure 2). Having the tandem MS spectrum enables quantitative extension of modification mapping experiments without transferring methods to another platform. Our results suggest several precautions that can improve the reliability of pSRM analyses. First, multiple technical replicate injections enable assessment of instrument performance-based variation due to chromatography, detectors, ion injection times, and signal intensity. Second, an IRP method should incorporate multiple internal reference peptides to provide confirmatory results, to identify peptides with the lowest variation and to minimize error due to ion suppression effects, and coeluting interferences. In our studies, we observed a consistently poor performing internal reference peptide, GLWIPEGEK, which generated large variations in CV for normalized pSRM signal (Figures S14–S19, Supporting Information) and also generated EGF- and inhibitor-related phosphorylation differences inconsistent with analyses using the other internal reference peptides (i.e., S1166, see Figure S29, Supporting Information). The GLWIPEGEK internal reference peptide may perform poorly due to inconsistent digestion resulting in a C-terminal missed cleavage (see Figure S11, Supporting Information) or due to some interfering ions of similar m/z adding to the noise of the signal or causing signal suppression. If the inconsistency is due to similar m/z adding to the noise, this could potentially be resolved using a higher resolution instrument for this approach. Arbitrary selection of a single reference peptide would not have detected this poor perfoming peptide. Theoretical prediction of optimal internal reference peptides may not be adequate and may require the examination of multiple internal reference peptide signals in a biological matrix to ensure consistency.
We employ the IRP method for analyses of modifications on individual proteins in relatively simple samples, such as immunoprecipitated proteins or proteins isolated from SDS–PAGE gel bands. We have not considered and do not recommend the IRP method for global analyses of modified proteins in complex proteomes. In the appropriate context, the IRP method is intended to estimate differences in protein modifications between similar samples. The data are comparable in measurement variation to immunoblot analyses (CVs up to 40%). MS-based analyses, such as the IRP and SID methods, are able to selectively measure many site-specific changes for which reliable antibody reagents are unavailable. The IRP method displays lower precision than SID, but it is useful in many applications where high precision is not required. IRP-based methods also do not use labeled peptide standards, which significantly increases analysis costs. In the context of targeted biochemical analyses, the IRP method accounts for variations in immunoprecipitation or affinity capture efficiency and gel fractionation. By utilizing multiple peptides for normalization, we account for variable digestion or other unknown modification of the normalization peptides. The IRP method also accounts for variability in both biological and technical replicates. These features make the IRP method a flexible, general approach for comparative analysis of protein modifications which can find widespread application in biochemical analyses.
Acknowledgments
We thank Dean D. Billheimer (Department of Agricultural and Biosystems, University of Arizona) for sharing the statistical model and program used in these studies. This work was supported by NIH Grant No. U24CA126479 from the National Cancer Institute Clinical Proteomic Technologies Assessment for Cancer program.
Supporting Information Available
Skyline screen captures for MS/MS transition settings, XICs for Y998 and S991, combined and individual standard curves for BSA spiked-in experiments, table of BSA and EGFR peptides (phosphorylated and nonphosphorylated) with precursors and product m/z used in these analyses, median CV plots for BSA spiked-in and EGFR experiments (MS2 and MS3 data), hEGFR primary amino acid sequence and domains, retention time graphs for EGFR reference and phosphopeptides, time vs ion injection time plots and XICs for EGFR technical replicate experiments, normalized pSRM plots for EGFR experiments. This material is available free of charge via the Internet at http://pubs.acs.org.
The authors declare no competing financial interest.
Author Present Address
⊥ Department of Pharmaceutical, Social and Administrative Sciences, College of Pharmacy, Belmont University, Nashville, TN 37212
Funding Statement
National Institutes of Health, United States
Supplementary Material
References
- Zhang G.; Spellman D. S.; Skolnik E. Y.; Neubert T. A. J. Proteome Res. 2006, 5, 581. [DOI] [PMC free article] [PubMed] [Google Scholar]
- Kruger M.; Kratchmarova I.; Blagoev B.; Tseng Y.-H.; Kahn C. R.; Mann M. Proc. Nat. Acad. Sci. U.S.A. 2008, 105, 2451. [DOI] [PMC free article] [PubMed] [Google Scholar]
- Luo W.; Slebos R. J.; Hill S.; Li M.; Brabek J.; Amanchy R.; Chaerkady R.; Pandey A.; Ham A.-J. L.; Hanks S. K. J. Proteome Res. 2008, 7, 3447. [DOI] [PMC free article] [PubMed] [Google Scholar]
- Spellman D. S.; Deinhardt K.; Darie C. C.; Chao M. V.; Neubert T. A. Mol. Cellular Proteomics 2008, 7, 1067. [DOI] [PMC free article] [PubMed] [Google Scholar]
- Ow S. Y.; Salim M.; Noirel J.; Evans C.; Rehman I.; Wright P. C. J. Proteome Res. 2009, 8, 5347. [DOI] [PubMed] [Google Scholar]
- Lill J. Mass Spectrom. Rev. 2003, 22, 182. [DOI] [PubMed] [Google Scholar]
- Kirkpatrick D. S.; Gerber S. A.; Gygi S. P. Methods 2005, 35, 265. [DOI] [PubMed] [Google Scholar]
- Zhang H.; Liu Q.; Zimmerman L. J.; Ham A.-J. L.; Slebos R. J. C.; Rahman J.; Kikuchi T.; Massion P. P.; Carbone D. P.; Billheimer D.; Liebler D. C. Mol. Cellular Proteomics 2011, 10. [DOI] [PMC free article] [PubMed] [Google Scholar]
- Rust M. J.; Markson J. S.; Lane W. S.; Fisher D. S.; O’Shea E. K. Science 2007, 318, 809. [DOI] [PMC free article] [PubMed] [Google Scholar]
- Rikova K.; Guo A.; Zeng Q.; Possemato A.; Yu J.; Haack H.; Nardone J.; Lee K.; Reeves C.; Li Y.; Hu Y.; Tan Z.; Stokes M.; Sullivan L.; Mitchell J.; Wetzel R.; MacNeill J.; Ren J. M.; Yuan J.; Bakalarski C. E.; Villen J.; Kornhauser J. M.; Smith B.; Li D.; Zhou X.; Gygi S. P.; Gu T.-L.; Polakiewicz R. D.; Rush J.; Comb M. J. Cell 2007, 131, 1190. [DOI] [PubMed] [Google Scholar]
- Liu H.; Sadygov R. G.; Yates J. R. Anal. Chem. 2004, 76, 4193. [DOI] [PubMed] [Google Scholar]
- Zhang G.; Fang B.; Liu R. Z.; Lin H.; Kinose F.; Bai Y.; Oguz U.; Remily-Wood E. R.; Li J.; Altiok S.; Eschrich S.; Koomen J.; Haura E. B. J. Proteome Res. 2010, 10, 305. [DOI] [PMC free article] [PubMed] [Google Scholar]
- Bantscheff M.; Schirle M.; Sweetman G.; Rick J.; Kuster B. Anal. Bioanal. Chem. 2007, 389, 1017. [DOI] [PubMed] [Google Scholar]
- Nita-Lazar A.; Saito-Benz H.; White F. M. Proteomics 2008, 8, 4433. [DOI] [PMC free article] [PubMed] [Google Scholar]
- MacLean B.; Tomazela D. M.; Shulman N.; Chambers M.; Finney G. L.; Frewen B.; Kern R.; Tabb D. L.; Liebler D. C.; MacCoss M. J. Bioinformatics 2010, 26, 966. [DOI] [PMC free article] [PubMed] [Google Scholar]
- Wu S.-L.; Kim J.; Bandle R. W.; Liotta L.; Petricoin E.; Karger B. L. Mol. Cellular Proteomics 2006, 5, 1610. [DOI] [PubMed] [Google Scholar]
- Wu H.-Y.; Tseng V. S.; Chen L.-C.; Chang H.-Y.; Chuang I. C.; Tsay Y.-G.; Liao P.-C. J. Proteome Res. 2010, 9, 4102. [DOI] [PubMed] [Google Scholar]
- Steen H.; Jebanathirajah J. A.; Springer M.; Kirschner M. W. Proc. Natl. Acad. Sci. U.S.A. 2005, 102, 3948. [DOI] [PMC free article] [PubMed] [Google Scholar]
- Ruse C. I.; Willard B.; Jin J. P.; Haas T.; Kinter M.; Bond M. Anal. Chem. 2002, 74, 1658. [DOI] [PubMed] [Google Scholar]
- Willard B. B.; Ruse C. I.; Keightley J. A.; Bond M.; Kinter M. Anal. Chem. 2003, 75, 2370. [DOI] [PubMed] [Google Scholar]
- Tsay Y.-G.; Wang Y.-H.; Chiu C.-M.; Shen B.-J.; Lee S.-C. Anal. Biochem. 2000, 287, 55. [DOI] [PubMed] [Google Scholar]
- Falin R. A.; Morrison R.; Ham A.-J. L.; Strange K. J. Gen. Physiol. 2009, 133, 29. [DOI] [PMC free article] [PubMed] [Google Scholar]
- Erickson J. R.; Joiner M.-l. A.; Guan X.; Kutschke W.; Yang J.; Oddis C. V.; Bartlett R. K.; Lowe J. S.; O’Donnell S. E.; Aykin-Burns N.; Zimmerman M. C.; Zimmerman K.; Ham A.-J. L.; Weiss R. M.; Spitz D. R.; Shea M. A.; Colbran R. J.; Mohler P. J.; Anderson M. E. Cell 2008, 133, 462. [DOI] [PMC free article] [PubMed] [Google Scholar]
- Licklider L. J.; Thoreen C. C.; Peng J.; Gygi S. P. Anal. Chem. 2002, 74, 3076. [DOI] [PubMed] [Google Scholar]
- Addona T. A.; Abbatiello S. E.; Schilling B.; Skates S. J.; Mani D. R.; Bunk D. M.; Spiegelman C. H.; Zimmerman L. J.; Ham A.-J. L.; Keshishian H.; Hall S. C.; Allen S.; Blackman R. K.; Borchers C. H.; Buck C.; Cardasis H. L.; Cusack M. P.; Dodder N. G.; Gibson B. W.; Held J. M.; Hiltke T.; Jackson A.; Johansen E. B.; Kinsinger C. R.; Li J.; Mesri M.; Neubert T. A.; Niles R. K.; Pulsipher T. C.; Ransohoff D.; Rodriguez H.; Rudnick P. A.; Smith D.; Tabb D. L.; Tegeler T. J.; Variyath A. M.; Vega-Montoto L. J.; Wahlander A.; Waldemarson S.; Wang M.; Whiteaker J. R.; Zhao L.; Anderson N. L.; Fisher S. J.; Liebler D. C.; Paulovich A. G.; Regnier F. E.; Tempst P.; Carr S. A. Nat. Biotechnol. 2009, 27, 633. [DOI] [PMC free article] [PubMed] [Google Scholar]
- Stover D.; Caldwell J.; Marto J.; Root K.; Mestan J.; Stumm M.; Ornatsky O.; Orsi C.; Radosevic N.; Liao L.; Fabbro D.; Moran M. Clin. Proteomics 2004, 1, 69. [Google Scholar]
Associated Data
This section collects any data citations, data availability statements, or supplementary materials included in this article.