

Abstract
Two calcium-sensitive guanylyl cyclase activating proteins (GCAP1 and GCAP2) activate cGMP synthesis in photoreceptor by retinal membrane guanylyl cyclase isozymes (RetGC1 and RetGC2) to expedite recovery, but calcium-insensitive constitutively active GCAP1 mutants cause photoreceptor degeneration in human patients and transgenic mice. Although GCAP1 and GCAP2 can both activate RetGC1 and RetGC2 in vitro, we find that GCAP1 selectively regulates RetGC1 in vivo. Furthermore, elimination of RetGC1 but not RetGC2 isozyme reverses abnormal calcium sensitivity of cGMP synthesis and rescues mouse rods in transgenic mice expressing GCAP1 mutants causing photoreceptor disease. Rods expressing mutant GCAP1 not only survive in the absence of RetGC1 but also remain functional, albeit with reduced electroretinography (ERG) amplitudes typical of RetGC1−/− genotype. The rod ERG recovery from a strong flash, only slightly affected in both RetGC1−/− and RetGC2−/− mice, becomes very slow in RetGC1−/− but not RetGC2−/− mice when GCAP2 is not available to provide Ca2+ feedback to the remaining RetGC isozyme. The intrinsic biochemical properties of RetGC and GCAP determined in vitro do not explain the observed phenomena. Instead, our results argue that there must be a cellular mechanism that limits GCAP1 access to RetGC2 and makes RetGC1 isozyme a preferential target for the disease-causing GCAP1 mutants. A more general conclusion from our findings is that nondiscriminatory interactions between homologous effector enzymes and their regulatory proteins permitted by their intrinsic biochemical properties can be effectively restricted in a living photoreceptor.
Introduction
Guanylyl cyclase activating proteins (GCAPs) (Dizhoor et al., 1994, 1995; Gorczyca et al., 1994; Palczewski et al., 1994) are Ca2+ sensors regulating retinal guanylyl cyclase (RetGC) in photoreceptor membranes (Fig. 1). Mutations in GCAP1 cause congenital cone and cone-rod degenerations in humans (Wilkie et al., 2001; Michaelides et al., 2005; Sokal et al., 2005; Kitiratschky et al., 2009), and constitutively active mutations, Y99C (Payne et al., 1998) and E155G (Wilkie et al., 2001), destroy rods in transgenic mice by altering Ca2+ sensitivity of the cGMP synthesis (Olshevskaya et al., 2004; Woodruff et al., 2007).
Figure 1.

The diagram of cGMP synthesis regulation by a negative Ca2+ feedback and the role of constitutively active GCAP1 mutants linked to human blindness. Left, Photoreceptors activate cGMP hydrolysis by the light-dependent PDE6 and close the cGMP gated channels (CNG). In the absence of the influx through the channels, free Ca2+ in the cytoplasm of the ROS is rapidly depleted by Na+/Ca2+, K+-exchanger, and this converts GCAPs to their activator state (GCAP1* and GCAP2*). GCAP1* and GCAP2* activate two isozymes of retinal guanylyl cyclase (RetGC1* and RetGC2*) and allow rods to reopen the CNG channels and recover from excitation. Middle, In the dark, when PDE6 activity is suppressed, a fraction of the CNG channels opens, and the influx of Ca2+ converts GCAPs into their inhibitory Ca2+-liganded state. Consequently, the rate of cGMP synthesis remains low in the dark so that only enough CNG channels would remain open to maintain the intracellular Ca2+ near the levels at which GCAP1 and GCAP2 stay in their Ca2+-bound form (∼250 μm Ca2+; Woodruff et al., 2002). Right, The Y99C (or E155G) GCAP1 mutant requires much higher Ca2+ concentrations to stop RetGC activation. As a result, cGMP synthesis activated by the Y99C GCAP1 in the dark continues until a larger fraction of CNG channels opens and Ca2+ rises to the higher than normal levels (Olshevskaya et al., 2004; Woodruff et al., 2007).
The rates of cGMP synthesis by RetGC versus decay by phosphodiesterase (PDE6) control the Na+ and Ca2+ influx in the rod outer segment (ROS), and GCAPs accelerate cGMP synthesis via negative calcium feedback (Pugh et al., 1997, 1999; Fu and Yau, 2007; Dizhoor et al., 2010). In the light, when cGMP hydrolysis blocks Ca2+ influx through the cGMP-gated channels, Ca2+ dissociates from GCAPs, which enables them to stimulate RetGC and speed up the recovery. Once the influx of Ca2+ through the channels reopens and its submicromolar concentrations (Gray-Keller and Detwiler, 1994; Woodruff et al., 2002) in ROS are restored, GCAPs rebind Ca2+ and decelerate RetGC activity. In contrast, Y99C (or E155G) GCAP1 is insensitive to the normal dark intracellular Ca2+ levels (Dizhoor et al., 1998; Sokal et al., 1998) and continues to accelerate cGMP synthesis, resulting in elevation of free cGMP and Ca2+ in transgenic mouse rods (Olshevskaya et al., 2004; Woodruff et al., 2007). The abnormal sensitivity of cGMP synthesis is the primary cause of the photoreceptor death, which can be averted by increased cGMP hydrolysis (Woodruff et al., 2007; Liu et al., 2009).
Using shRNA suppression of the Y99C GCAP1 activity was successful at moderate levels but not at higher levels of Y99C GCAP1 expression (Jiang et al., 2011). Perhaps the cyclase activity itself also needs to be partially suppressed to treat more severe forms of degeneration, but the actual isozyme—RetGC1 or RetGC2 (Lowe et al., 1995; Yang et al., 1995)—targeted by the mutant GCAP1 has to be first identified.
In vitro, GCAP1 and GCAP2 activate both isozymes with only slightly different affinities and sensitivity to Ca2+ (Hwang et al., 2003; Peshenko and Dizhoor, 2004; Peshenko et al., 2011). Biochemical isolation of RetGC/GCAP complexes directly from the normal and diseased photoreceptors remains technically impossible, because they are unstable in detergents (Koch, 1991). Therefore, we tested possible selectivity in GCAP/RetGC interactions in vivo by studying retinal degeneration caused by constitutively active GCAP1 and Ca2+ sensitivity of the endogenous GCAP/RetGC complexes in mouse retinas genetically lacking RetGC1 or RetGC2. We also compared the speed of rod recovery in transgenic models expressing only GCAP1 isoform and one of the cyclase isozymes. We find a strong GCAP1 selectivity toward RetGC1 in vivo that cannot be explained by their general biochemical properties and must be imposed at the cellular level, thus making RetGC1 the preferred target for the GCAP1 mutants causing retinal disease in humans.
Materials and Methods
Mouse genetic models.
All animal procedures were approved by Salus University Institutional Animal Care and Use Committee protocol in compliance with the National Institutes of Health guidelines. Mice of either sex were used for each genotype presented in the study (Table 1). Retinal degeneration models transgenically overexpressing Y99C (line 53) or E155G (line 541) GCAP1 under control of rod opsin promoter were described in previous publications (Olshevskaya et al., 2004; Woodruff et al., 2007). Wild-type (WT) C57BL/6 mice originated from Taconic Farms. The GCAP1,2−/− line, produced by simultaneous deletion of the neighboring GUCA1A and GUCA1B genes (Mendez et al., 2001), was a gift from Dr. Jeannie Chen (University of South California, Los Angeles, CA). The GCAP2−/− mouse model developed by selective disruption of GUCA1B gene was described in detail previously (Makino et al., 2008). The RetGC1−/− (line GC-E null) produced by the disruption of a mouse GUCY2E gene (Yang et al., 1999) was a gift from Dr. David Garbers (University of Texas, Dallas, TX), and RetGC2−/− mice produced by disruption of GUCY2F gene (Baehr et al., 2007) were provided by Dr. Wolfgang Baehr (University of Utah, Salt Lake City, UT). The RetGC1 or RetGC2 knock-outs were bred with the other genotypes to produce Y99C+RetGC1−/−; Y99C+RetGC2−/−; E155G+RetGC1−/−; RetGC1−/−GCAP1,2−/−; RetGC2−/−GCAP1,2−/−; RetGC1−/−GCAP2−/−; and RetGC1−/− GCAP2−/− genotypes. The WT, RetGC1−/−, RetGC2−/−, Y99C+, Y99C+RetGC1−/−, Y99C+RetGC2−/−, and E155G+RetGC1−/− were used in degeneration studies; unlike Y99C+RetGC2−/−, selected as the control line for the degeneration studies, we were unable to breed enough E155G+RetGC2−/−. The nondegenerating WT; RetGC1−/−, RetGC2−/−; RetGC1−/−GCAP1,2−/−; RetGC2−/−GCAP1,2−/−; RetGC1−/−GCAP2−/−; and RetGC1−/−GCAP2−/− lines were used in electroretinography (ERG) paired-flashes experiments.
Table 1.
Mouse genotypes used in the studya
| Genotype | Phenotype | Total | Results presented |
|---|---|---|---|
| WT | Nondegenerating | 27 | Morphology, ERG, paired-flashes ERG, RetGC activity, IF, TUNEL |
| Y99C+ (line 53; Olshevskaya et al., 2004) | Fast-degenerating | 23 | Morphology, ERG, RetGC activity, TUNEL |
| E155G+ (line 541; Woodruff et al., 2007) | Fast-degenerating | 13 | Morphology, ERG, RetGC activity |
| RetGC1−/− (line GCE null; Yang et al., 1999) | No cone function, rods are preserved | 44 | Morphology, ERG, RetGC activity, IF |
| RetGC2−/− (GC2 knock-out; Baehr et al., 2007) | Nondegenerating | 16 | Morphology, ERG, RetGC activity paired-flashes ERG |
| Y99C+RetGC1−/−b | No cone function, most of the rods are preserved | 46 | Morphology, ERG, RetGC activity, IF, TUNEL |
| Y99C+RetGC2−/−b | Fast-degenerating | 12 | Morphology, ERG, RetGC activity, TUNEL |
| E155G+RetGC1−/−b | No cone function, most of the rods are preserved | 29 | Morphology, ERG, RetGC activity, IF |
| RetGC1−/−GCAP2−/−c | Slow recovery | 16 | Paired-flashes ERG |
| RetGC1−/−GCAP1,2−/−d | Slow recovery | 12 | Paired-flashes ERG |
| RetGC2−/−GCAP2−/−e | Fast recovery | 11 | Paired-flashes ERG |
| RetGC2−/−GCAP1,2−/−f | Slow recovery | 16 | Paired-flashes ERG |
aMice of either sex were used.
The new genotypes were bred for this study as follows:
bfrom fast degenerating lines 53 (Olshevskaya et al., 2004) and 541 (Woodruff et al., 2007) and rod nondegenerating GC-E null (Yang et al., 1999) or GC2 knock-out (Baehr et al., 2007) lines.
cfrom nondegenerating GCAP2−/− (Makino et al., 2008) and rod nondegenerating GC-E null (Yang et al., 1999) lines.
dfrom nondegenerating GCAP1,2−/− double knock-out (Mendez et al., 2001) and rod non-degenerating GC-E null (Yang et al., 1999) lines.
efrom nondegenerating GC2 knock-out (Baehr et al., 2007) and nondegenerating GCAP2−/− (Makino et al., 2008).
ffrom nondegenerating GC2 knock-out (Baehr et al., 2007) and nondegenerating GCAP1,2−/− double knock-out (Mendez et al., 2001) lines.
Electroretinography.
Mice were dark-adapted under vented hood overnight and anesthetized by intraperitoneal injection of 20 μg/g ketamine, 8 μg/g xylazine, and 800 μg/g urethane. Scotopic ERG was recorded according to the protocol of Lyubarsky and Pugh (1996) with minor modifications described previously (Woodruff et al., 2007). The saturating ERG responses were evoked by a 1 ms white flash delivering ∼106 photon/μm−2 at the cornea. Rod recovery speed in different genotypes was compared using paired-flashes ERG according to the protocol of Lyubarsky and Pugh (1996) with minor modifications.
Retinal histology and fluorescence microscopy.
Mice killed by lethal injection of anesthetic were perfused through the heart with PBS and then with either freshly prepared 4% paraformaldehyde in PBS or 2.5% glutaraldehyde in 0.1 m cacodylate buffer, and the enucleated eyes were then additionally fixed for 4 h on ice in the respective fixative solution and processed for histological sectioning. The paraformaldehyde-fixed eyes were washed with PBS, impregnated with 30% sucrose in PBS, and frozen embedded in OCT medium (Electron Microscopy Sciences). Cryosections were taken using a Hacker-Bright OTF5000 microtome and probed with the polyclonal anti-GCAP1 antibody as described previously (Makino et al., 2008), and the immunofluorescence (IF) images were recorded using an Olympus FV1000 Spectral confocal system. For the in situ apoptosis analysis, mice were killed and perfused with PBS and 4% paraformaldehyde on postnatal day 28, and the apoptotic DNA fragmentation in retinal cryosections was detected by terminal deoxynucleotidyl transferase-mediated biotinylated UTP nick end labeling (TUNEL) method using a TMR Red In Situ Cell Death Detection kit (catalog #12156792910; Roche Applied Science) according to the protocol of the manufacturer; the nuclei were counterstained with DAPI. The tetramethylrhodamine (TMR) red-labeled nuclei were photographed using an Olympus Magnafire imaging system integrated with BX51 microscope with a 20× objective. For histological analysis, glutaraldehyde-fixed retinas were washed in PBS, dehydrated in ethanol solutions, embedded, sectioned, stained, and photographed as described previously (Olshevskaya et al., 2004; Woodruff et al., 2007).
Guanylyl cyclase assays.
Mice were dark-adapted overnight and killed under infrared illumination, and the retinas were extracted and assayed for RetGC activity in the dark using [α-32P]GTP as a substrate using a previously described protocol (Olshevskaya et al., 2004; Peshenko et al., 2011). The assay mixture (25 μl) contained 30 mm 3-(N-morpholino)-propanesulfonic acid–KOH, pH 7.2, 60 mm KCl, 4 mm NaCl, 1 mm DTT, 2 mm Ca2+/EGTA buffer, 1 mm free Mg2+, 0.3 mm ATP, 4 mm cGMP, 1 mm GTP, 1 μCi of [α-32P]GTP, 0.1 μCi of [8-3H]cGMP (PerkinElmer Life and Analytical Sciences), and PDE6 inhibitors zaprinast and dipyridamole. In some series, 10 mm creatine phosphate and 0.5 U of creatine phosphokinase were added to better maintain the linear time course of the reaction. The resultant [32P]cGMP product was analyzed using fluorescently backed polyethyleneimine cellulose TLC, as described previously (Olshevskaya et al., 1997).
Ca2+/EGTA buffers containing calibrated free Ca2+ and Mg2+ concentrations were prepared using the method by Tsien and Pozzan (1989) and verified by fluorescent Ca2+ indicator dyes as described previously (Peshenko et al., 2006).
Recombinant Y99C GCAP1.
The Y99C GCAP1 was expressed from pET11d vector in a BLR(DE3) Escherichia coli strain harboring yeast N-myristoyltransferase as described previously (Dizhoor et al., 1998) with modifications described by Peshenko et al. (2006).
Statistical test.
When indicated, one-way ANOVA with Bonferroni's post hoc test for all-pairs comparison was performed using Kaleidagraph 4 (Synergy Software).
Results
Elimination of RetGC1 effectively preserves rods in Y99C and E155G mice
Rods in mouse retinas expressing Y99C GCAP1 under control of rod opsin promoter (line 53) (Olshevskaya et al., 2004) progressively degenerate, and scotopic ERG a-wave in these mice disappears by the age of 4–6 months, concomitant with the loss of the outer nuclear layer. Even faster progressing degeneration occurs in rods overexpressing E155G GCAP1 mutant, line 541 (Woodruff et al., 2007). In sharp contrast to the Y99C+ and the E155G+ mice that express the mutant GCAP1 in RetGC1+/+RetGC2+/+ background and lose the entire rod population between 4 and 6 months of age (Fig. 2), most of the rods survive and retain the outer segment layer in the Y99C+RetGC1−/− and E155G+RetGC1−/− retinas (Fig. 2Ad,Af). Compared with the parental Y99C+ line 53 lacking photoreceptor outer nuclear layer, the rescue of rods in the Y99C+RetGC1−/− mice was robust and fairly uniform in different parts of the retina, typically within 60–80% normal linear nuclei density (Fig. 2Ba,Bb). On average, rod preservation in Y99C+RetGC1−/− mice at the age of 5–6 months was near 72%. Likewise, there was a dramatic (∼56%) preservation of rods in E155G+RetGC1−/− retinas when the parental E155G+ line had virtually no photoreceptor nuclei left at that age (Fig. 2C).
Figure 2.
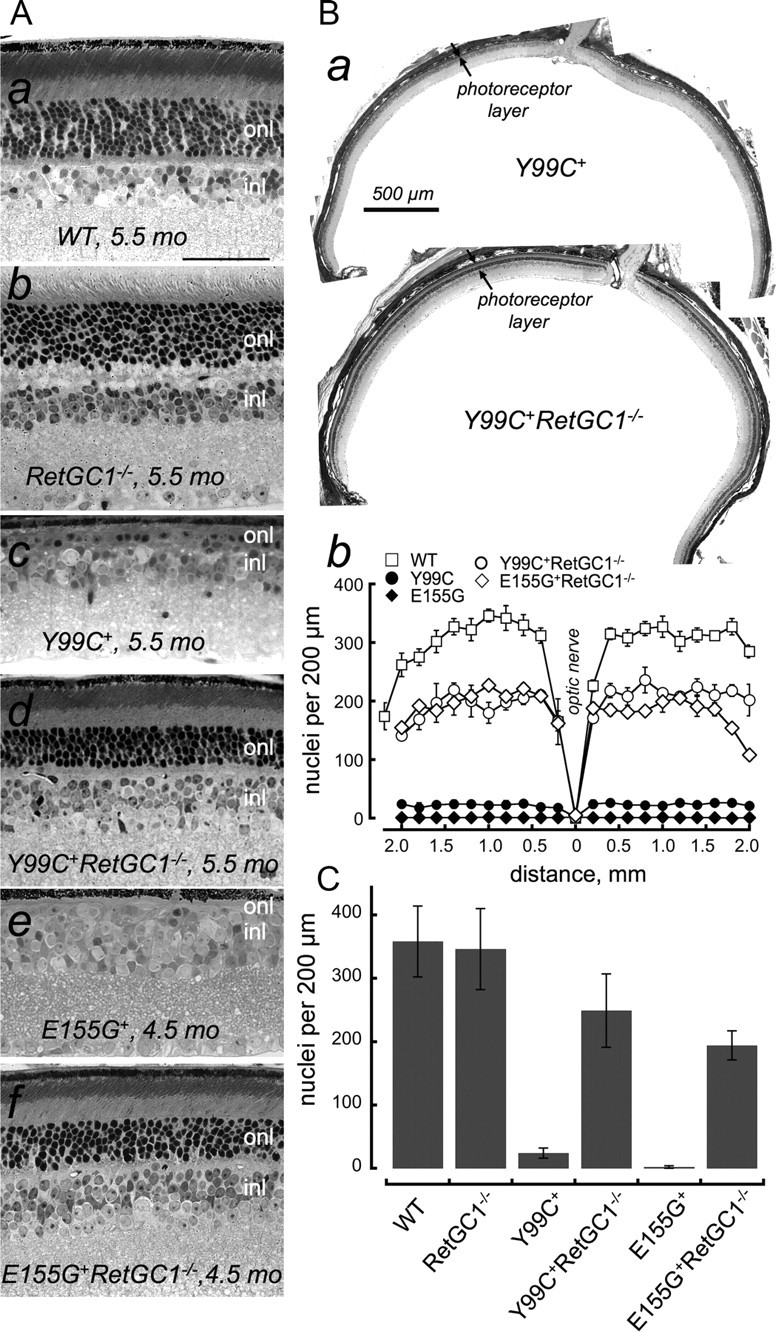
The lack of RetGC1 preserves photoreceptors in mice expressing Y99C or E155G GCAP1. A, Cross-sections of glutaraldehyde-fixed retinas from WT (a), RetGC1−/− (b), Y99C+ (c), and Y99C+RetGC1−/−(d) mice aged 5.5 months and E155G+ (e) or E155G+RetGC1−/− (f) mice aged 4.5 months; methylene blue/azur stain; 40× objective. Scale bar, 50 μm. For additional details, see Materials and Methods. Notice that, in contrast to the WT (a), the Y99C+ (c) and E155G+ (e) retinas demonstrate typical obliteration of the outer nuclear layer caused by constitutively active GCAP1 (Woodruff et al., 2007), whereas in RetGC1−/− retinas (b), the outer nuclear layer remains primarily intact, consistent with the original report by Yang et al. (1999). Most of the rods survive in Y99C+RetGC1−/− (d) and E155G+RetGC1−/− (f) retinas and retain clearly identifiable layer of outer segments. onl, Outer nuclear layer; inl, inner nuclear layer. B, Preservation of photoreceptors in different areas of the retina. Full-size retinas section of the Y99C+ and Y99C+RetGC1−/− retinas at 5.5 months of age (a), with area between the arrows marking the thickness of the photoreceptor layer showing that the outer nuclear layer of photoreceptors is mostly eliminated in the Y99C+ retinas but remains uniformly well detectable in all parts of the retina outside the optic nerve; each photograph is a composite of a series of micrographs taken with 10× objective. Scale bar, 500 μm. The distribution of the photoreceptor nuclei along the retina (b) was quantified in WT (□), Y99C+ (●), E155G+(♦), Y99C+RetGC1−/− (○), and E155G+RetGC1−/− (♢) by counting identifiable photoreceptor nuclei per 200 μm increment distances, on both sides from the optic nerve (0 mm on the diagram), averaged from three sections in each retina. C, Nuclei density per 200 μm length in the mid-portion of the retina (0.5–1.5 mm from the optic nerve) averaged from random sampling of 40× objective frames from five different WT, RetGC1−/−, Y99C+, Y99C+RetGC1−/− (aged 5–6 months), and E155G+ and E155G+RetGC1−/− (aged 4.5–5 months) retinas: 358 ± 56 (mean ± SD), n = 11; 346 ± 64, n = 16; 24 ± 8, n = 17; 249 ± 58, n = 20; 2 ± 2, n = 10; and 194 ± 23, n = 10, respectively.
Along with the robust preservation of the retinal morphology, the rescued Y99C and E155G rods remained functional when tested by scotopic ERG (Fig. 3). Although the scotopic ERG is a sum of both rod and cone activity, only 3% of total photoreceptors in a mouse retina are cones (Jeon et al., 1998), so the mass cone hyperpolarization signal is rather minuscule compared with that of rods and is hard to detect in WT mouse retinas (Sakurai et al., 2011). Therefore, we here refer to the scotopic a-wave as primarily rod ERG. In RetGC1−/− mice, there are no functional cones and their ERG originates exclusively from rods (Yang et al., 1999; Baehr et al., 2007). The lack of RetGC1 is known to strongly reduce the amplitude of the rod ERG a-wave without causing rods to degenerate (Yang et al., 1999; Baehr et al., 2007). Consequently, the amplitude of the rod ERG a-wave in RetGC1−/− mice expressing Y99C or E155G GCAP1 in our experiments was also reduced (Fig. 3A). However, both the a-wave (Fig. 3A–C) and the b-wave (Fig. 3A,D) remained clearly defined in mice who expressed the mutated GCAP1 in RetGC1−/− background, at the age when the a-wave was no longer detectable and only low-amplitude residual b-wave was occasionally present in the degenerated parental Y99C+ or E155G+ mice. The average a-wave amplitudes in WT, RetGC1−/−, Y99C+RetGC1−/−, and E155G+RetGC1−/− mice were ∼430, 127, 220, and 160 μV, respectively. The a-wave exceeded 100 μV in two Y99C+RetGC1−/− mice tested as late as 13 months of age (data not shown). The ANOVA/Bonferroni's all-pairs comparison test performed on genotypes summarized in Figure 3, C and D, indicated high statistical significance (p < 0.0001) at α = 0.01 of ERG rescue in Y99C+ or E155G+ mice after elimination of RetGC1. We emphasize that the rescue effect in that case needs to be compared against the parental RetGC1−/− genotype rather than WT mice, because RetGC1 knock-out itself strongly diminishes the ERG (Yang et al., 1999). Compared with RetGC1−/−, there was even a small increase of the average a-wave amplitude in Y99C+RetGC1−/− mice (by ∼93 μV), which was statistically significant (at α = 0.01), and in E155G+RetGC1−/− mice (by ∼33 μV), which was not statistically significant (at α = 0.05).
Figure 3.
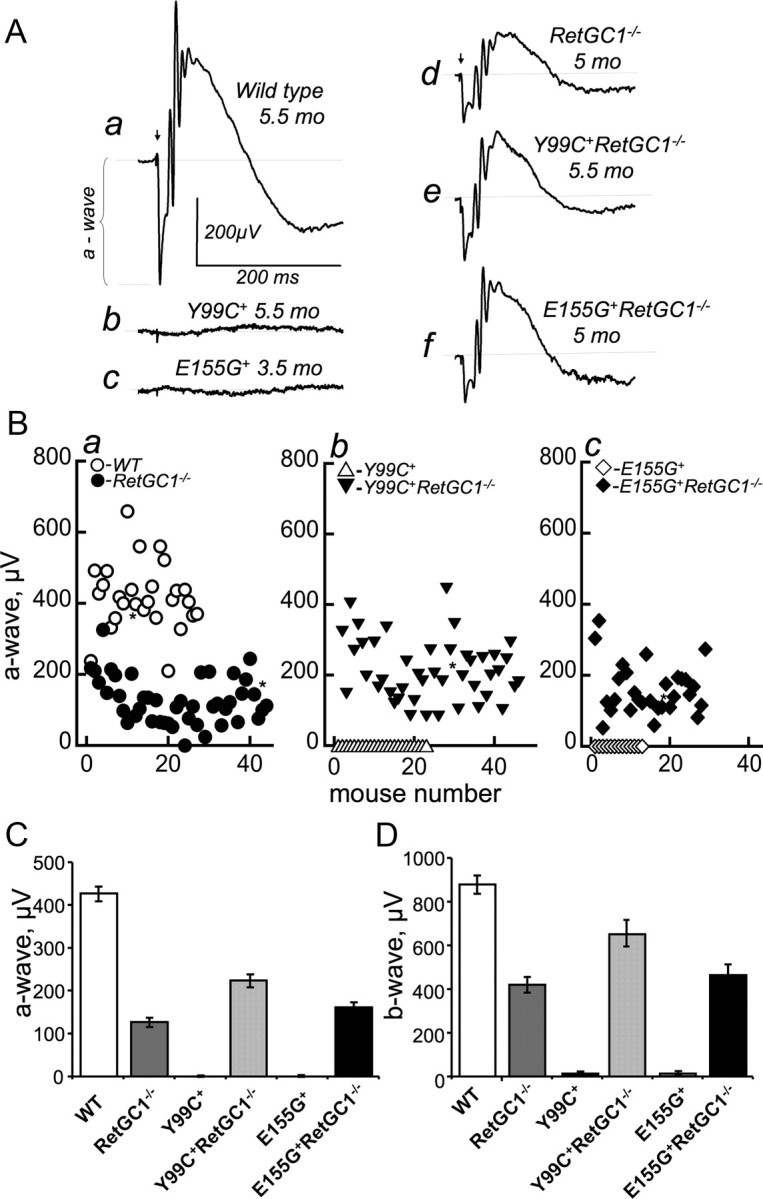
The Y99C+ and E155G+ rods rescued by RetGC1 gene knock-out remain functional. A, Representative scotopic ERG responses to a saturating flash: a, WT (5.5 months of age); b, Y99C+ mice (5.5 months); c, E155G+ (3.5 months); d, RetGC1−/− (5 months); e, Y99C+RetGC1−/− (5.5 months); f, E155G+RetGC1−/− (5 months). B, Scotopic ERG a-wave amplitudes (saturating flash) in mice of different genotypes: a, WT (○) and RetGC1−/−(●); b, Y99C+ (▵) and Y99C+RetGC1−/−(▾); c, E155G+ (♢) and E155G+RetGC1−/−(♦). Each data point represents a separate mouse from the 4–6 month age group. The asterisks correspond to those mice whose ERG represent close to the average amplitude for the respective genotype and are shown in A. C, Scotopic a-wave amplitude (mean ± SEM) in WT, RetGC1−/−, Y99C+RetGC1−/−, and E155G+RetGC1−/− mice was 430 ± 17 μV, n = 27; 127 ± 10 μV, n = 44; 220 ± 15 μV, n = 46; and 160 ± 13 μV, n = 29, respectively. No measurable a-wave was recorded from 23 Y99C+ and 13 E155G+ mice. D, Scotopic b-wave amplitudes (mean ± SEM) in WT, RetGC1−/−, Y99C+, Y99C+RetGC1−/−, E155G+, and E155G+RetGC1−/−: 880 ± 40 μV, n = 27; 423 ± 36 μV, n = 38; 10 ± 5 μV, n = 23; 658 ± 61 μV, n = 40; 14 ± 8 μV, n = 13; and 465 ± 50 μV, n = 27, respectively. For additional details, see Materials and Methods.
In contrast, RetGC2−/− rods harboring constitutively active GCAP1 degenerated in a rapid progressive manner (Fig. 4). Compared with the Y99C+RetGC1−/− mice, the Y99C+RetGC2−/− photoreceptor nuclei in most parts of the retina after 5 months were reduced to less than one full layer (Fig. 4Aa–Ac), although in some regions there were short clusters in which the residual nuclei were more abundant (Fig. 4Ac, bottom). The average linear nuclei density in the Y99C+RetGC2−/− retinas (Fig. 4Bd) was therefore slightly elevated compared with the Y99C+ mice (44 vs 24 per 200 μm retina length). However, in ANOVA/Bonferroni's all-pairs comparison test applied to the group (Y99C+RetGC2−/−, Y99C+RetGC1−/−, Y99C+, and WT), those two genotypes were not different at α = 0.05. In contrast, the difference from both Y99C+RetGC1−/− (249 per 200 μm) and the WT (358 per 200 μm) was highly significant for both Y99C+ and the Y99C+RetGC2−/− mice (p < 0.0001 at α = 0.01). Evidently, a small increase in linear nuclei density in Y99C+RetGC2−/− retinas did not constitute a substantial rescue effect.
Figure 4.
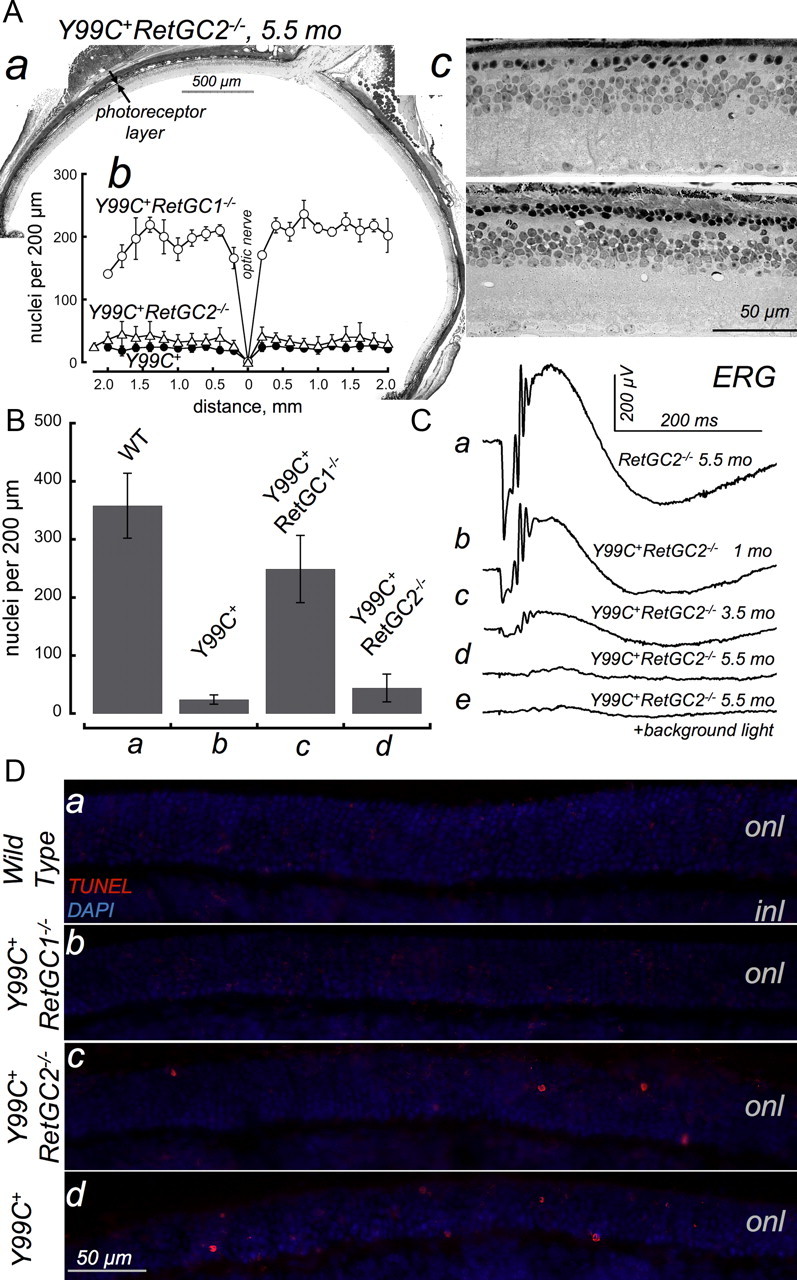
RetGC2 knock-out does not prevent rod degeneration in Y99C+ mice. A, Retinal histology: a, full cross-section of Y99C+RetGC2−/− retina aged 5 months (a composite from a series of photographs taken with 10× objective; scale bar, 500 μm; the space between the arrows marks the thickness of the photoreceptor layer); b, a typical distribution of the photoreceptor nuclei in the Y99C+RetGC2−/− retina (▵) compared with that of Y99C+(●) and Y99C+RetGC1−/− (○), analyzed as described in Figure 2; c, representative cross-sections of the Y99C+RetGC2−/− retinas (40× objective). The most typical pattern was elimination of the outer nuclear layer to less than one complete row of photoreceptor nuclei (top), with occasional clusters containing up to two rows of nuclei but without identifiable ROSs (bottom). B, The density of randomly sampled photoreceptor nuclei per 200 μm retina length within 0.5–1.5 mm eccentricity in five Y99C+RetGC2−/− mice aged 5 to 6 months was strongly reduced (44 ± 24 SD per 200 μm, n = 19) compared with the Y99C+RetGC1−/− retinas (249 ± 58, n = 20) and close to that of the Y99C+ genotype (24 ± 8, n = 17). C, Scotopic ERG in 5.5-month-old RetGC2−/− (a) and in Y99C+RetGC2−/− (b–d) mice at 1 month (b), 3.5 months (c), and 5.5 months (d) of age. A low-amplitude b-wave (∼30 μV) (d) was detected in one of eight tested Y99C+RetGC2−/− mice; it remained in the presence of a 30 lux background incandescent light (e). There was no measurable a-wave in eight Y99C+RetGC2−/− mice aged 5–6 months, similarly to the parental Y99C+ line (Fig. 3). D, Photoreceptor apoptotic nuclei are detectable by TMR red TUNEL in Y99C+RetGC2−/− mice but not in Y99C+RetGC1−/− mice. Paraformaldehyde-fixed cryosections of WT (a), Y99C+RetGC1−/− (b), Y99C+RetGC2−/− (c), and Y99C+ (d) retinas (postnatal day 28) were probed for DNA fracture using TUNEL reaction (red fluorescence) in the same experiment; the nuclei were counterstained with DAPI (blue). Scale bar, 50 μm. onl, Outer nuclear layer. For additional details, see Materials and Methods.
The RetGC2−/− mice retain near-normal ERG responses (Baehr et al., 2007) (Fig. 4Ca). In contrast to that, Y99C+RetGC2−/− mice continue to demonstrate typical for Y99C+ rapid decline of scotopic ERG within the first 4 months of age (Fig. 4Cb,Cc). Concomitant with the progressive obliteration of the outer nuclear layer, the a-wave became undetectable in eight mice tested between 5 and 6 months of age (Fig. 4Cd), and only one of them demonstrated a small identifiable b-wave (Fig. 4Cd). That low-amplitude b-wave sustained a 30 lux background and therefore was likely a residual cone activity, occasionally detectable at that age in the parental Y99C+ line (Olshevskaya et al., 2004; Woodruff et al., 2007). Overall, retinal degeneration pattern in Y99C+ in RetGC2−/− genetic background was similar to that originally reported for Y99C+ mice (Olshevskaya et al., 2004; Woodruff et al., 2007).
Deregulation of cGMP synthesis by Y99C GCAP1 leading to a progressive apoptotic cell death is accompanied by DNA fragmentation in matured photoreceptors (Dizhoor et al., 2006). We could not confidently identify apoptotic signals in differentiated WT and Y99C+RetGC1−/− retinas at 1 month of age (Fig. 4D), and what we could regard as possible occurrence of TUNEL-positive nuclei was no higher than 1 per 2000 μm of the retina section length in both cases. We could, however, quite clearly observe TUNEL-positive nuclei scattered in the layer of differentiated photoreceptors in both Y99C+RetGC2−/− and Y99C+ age-matched retinas (Fig. 4Dc,Dd). When randomly sampled in three sets of retinas (two of each genotype per experiment), the difference was significant (ANOVA/Bonferroni's test, α = 0.01, p < 0.0001) between Y99C+RetGC2−/− (linear density of 4.8 ± 2 SD per 400 μm, n = 9) and Y99C+RetGC1−/− (0.2 ± 0.4 SD per 400 μm, n = 5) retinas but not between the Y99C+RetGC2−/− and Y99C+ (5.1 ± 2.3 per 400 μm, n = 7) retinas. A relatively modest frequency of the apoptotic nuclei in the Y99C+ outer nuclear layer at that stage does not appear particularly surprising considering that it takes their photoreceptors several months to completely degenerate (Olshevskaya et al., 2004; Dizhoor et al., 2006).
Ca2+ sensitivity of cGMP synthesis does not change in Y99C or E155G GCAP1 rods lacking RetGC1
A strong decrease in Ca2+ sensitivity of the retinal guanylyl cyclase shown in Figure 5A, shifted outside the normal intracellular range of Ca2+ concentrations ([Ca]½ > 0.2 μm vs 0.06 μm in WT), is the hallmark of the rods expressing Y99C or E155G GCAP1 transgene (Olshevskaya et al., 2004; Makino et al., 2006; Woodruff et al., 2007). It is technically impossible to accurately quantify the absolute activity of RetGC in normal and degenerating rods, because the severe early degeneration in Y99C+ and E155G+ retinas eliminates most of the activity simply because of the photoreceptor loss (Olshevskaya et al., 2004; Woodruff et al., 2007). However, the experiments presented in Figure 5 argue that the protective effect caused by the RetGC1 isozyme deletion coincides with a dramatic reversal of the abnormal Ca2+ sensitivity of the cGMP synthesis in transgenic mice (Fig. 5B). When Y99C or E155G GCAP1 is expressed in RetGC1−/− background, the cyclase sensitivity to Ca2+ becomes virtually the same as in WT or RetGC1−/− retinas ([Ca]½ of ∼0.06 μm) (Fig. 5B). In other words, RetGC2 isozyme remaining in the RetGC1−/− retinas is not affected by the constitutively active GCAP1 expressed in their rods. If there is any interaction between RetGC2 and the mutated GCAP1, it is too weak to be detected by our method. In contrast, elimination of RetGC2 isozyme does not reverse the abnormal sensitivity of the cGMP synthesis caused by the transgenic expression of the Y99C GCAP1 ([Ca]½ of ∼0.3 μm) (Fig. 5C).
Figure 5.
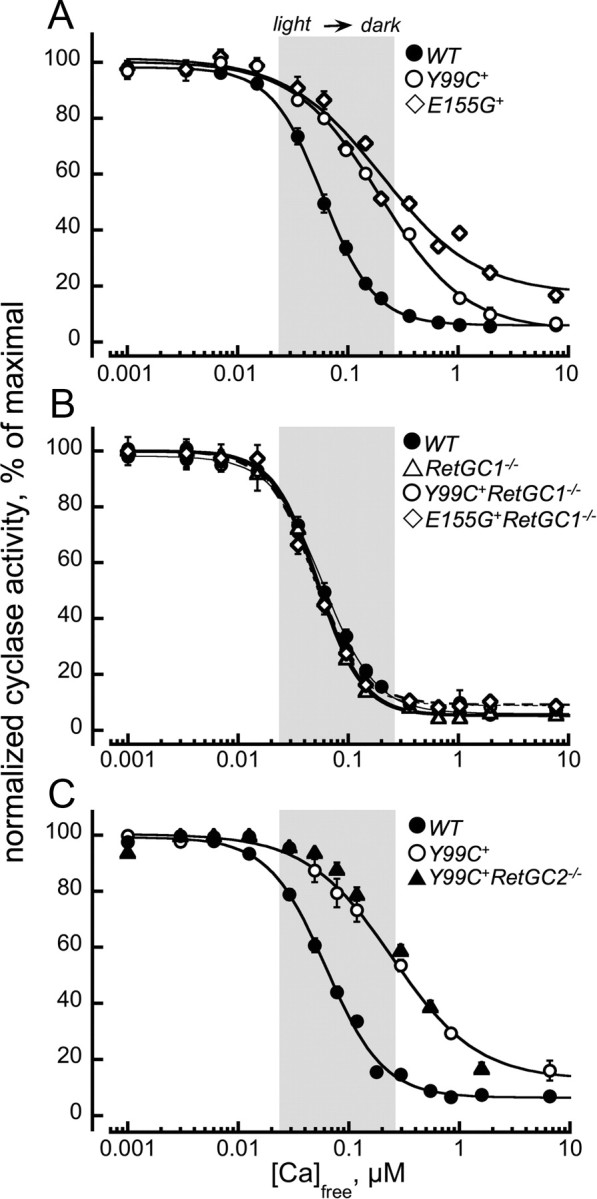
Calcium sensitivity of cGMP synthesis in mouse retinas expressing Y99C or E155G GCAP1 varies depending on the RetGC isozymes present in rods. A, In WT retinas (●), cGMP synthesis is sensitive to Ca2+ within the normal range (shadowed) of free Ca2+ between the light and the dark (Woodruff et al., 2002), but in Y99C+ (○) and E155G (♢) retinas, the sensitivity shifts outside the upper limit of the normal Ca2+ range. B, Ca2+ sensitivity of guanylyl cyclase in Y99C+RetGC1−/− (♢) or E155G+RetGC1−/− (♢) retinas becomes indistinguishable from that of the WT (●) or RetGC1−/− (▵). C, Ca2+ sensitivity of retinal guanylyl cyclase in Y99C+RetGC2−/− retinas (▴) remains right-shifted compared with the WT (●), just like in Y99C+ (○) mice. The cyclase activity was assayed as described in Materials and Methods. For comparison on the same scale, the activities in each series were normalized by the corresponding maximal RetGC activity measured in each genotype. The data were fitted by the equation A = (Amax − Amin)/(1+([Ca]/[Ca]½)h) + Amin, where Amax and Amin are the maximal and the minimal activity of guanylyl cyclase, respectively, [Ca]½ is the concentration of Ca2+ producing 50% inhibition, and h is a Hill coefficient.
The recombinant Y99C GCAP1 constitutively activates RetGC2 in vitro but not in a living retina
Both GCAP1 and GCAP2 efficiently activate mouse RetGC1 and RetGC2 isozymes in vitro (Peshenko et al., 2011). Therefore, it was surprising to find that the Ca2+ sensitivity of RetGC2 in the retinas expressing Y99C or E155G GCAP1 remained essentially normal. This could indicate that GCAP1 altered by the constitutive mutation has lost its ability to interact with RetGC2 as a result of the mutation per se. Alternatively, RetGC2 could be modified in vivo in such a manner that it no longer recognizes the mutated GCAP1. However, the results presented in Figure 6 reject both possibilities and argue that RetGC2 isozyme in the Y99C+RetGC1−/− retinas can bind Y99C GCAP1 if such opportunity is presented. When the assay mixture containing Y99C+RetGC1−/− retinal sample ([Ca]½ of ∼0.077 μm) was supplemented by purified Y99C GCAP1, the sensitivity of the endogenous RetGC2 was shifted far outside the normal range ([Ca]½ > 0.6 μm) (Fig. 6A). Essentially the same effect occurred in E155G+RetGC1−/− retinas: the [Ca]½ value measured directly in the retinal homogenate (0.05 μm) increased almost 10-fold (0.49 μm) when purified recombinant E155G+GCAP1 was added in the assay (Fig. 6B).
Figure 6.

RetGC2 reacts with the purified Y99C or E155G GCAP1 in vitro but is insensitive to the Y99C or E155G GCAP1 transgenically expressed in the rods. A, The cyclase activity was assayed at different free Ca2+ concentrations in the retinas obtained from the WT (●), RetGC1−/− (■), and Y99C+RetGC1−/− (○) mice; the Y99C+RetGC1−/− retinas were also assayed in the presence of 10 μm purified Y99C GCAP1 (♢). B, The cyclase activity was assayed at different free Ca2+ concentrations in the retinas obtained from the WT (●), RetGC1−/− (■), and E155G+RetGC1−/− (⊙) mice; the E155G+RetGC1−/− retinas were also assayed in the presence of 10 μm purified E155G GCAP1 (▵).
Constitutively active GCAP1 remains expressed in RetGC1−/− rods
Another possibility that needs to be addressed is the reduction of GCAP1 expression typically observed in RetGC1−/− but not RetGC2−/− background (Baehr et al. 2007). Indeed, if the mutated GCAP1 were merely not expressed in the RetGC1−/− background, there would be no reason to expect the remaining RetGC2 to alter its Ca2+ sensitivity. However, in contrast to the endogenous GCAP1, the Y99C mutant, whose transgenic expression is driven by rod opsin promoter, robustly accumulates in RetGC1−/− rods (Fig. 7A). There was also the anticipated loss of RetGC1 but not RetGC2 or GCAP2 expression in the Y99C+RetGC1−/− retinas (Fig. 7Aa,Ab). The total expression level of GCAP1 was not only well detectable but was also markedly higher than normal. Similar to the original Y99C+ line 53 (Olshevskaya et al., 2004), the transgene expression exceeded more than fivefold the level of the endogenous WT GCAP1 (note that the transgenic Y99C migrates in SDS gel as the upper band) (for details, see Olshevskaya et al., 2004). Furthermore, anti-GCAP1 IF in the outer segments of RetGC1−/− mice was noticeably dimmer compared with the WT rods, as described previously by Baehr et al. (2007), yet it was well detectable in RetGC1−/− rods expressing the transgenic mutants of GCAP1 (Fig. 7B). The overall brightness of the anti-GCAP1 fluorescence in Y99C+RetGC1−/− rods (Fig. 7Bc) was visibly increased compared with the WT. Likewise, E155G+RetGC1−/− mice under the same conditions displayed a robust GCAP1 IF in rods, brighter than in the WT (Fig. 7Bd). Evidently, the normal Ca2+ sensitivity of RetGC2 in Y99C+RetGC1−/− or E155G+RetGC1−/− retinas (Fig. 5) cannot be explained by a lack of mutant GCAP1 expression in their rods.
Figure 7.
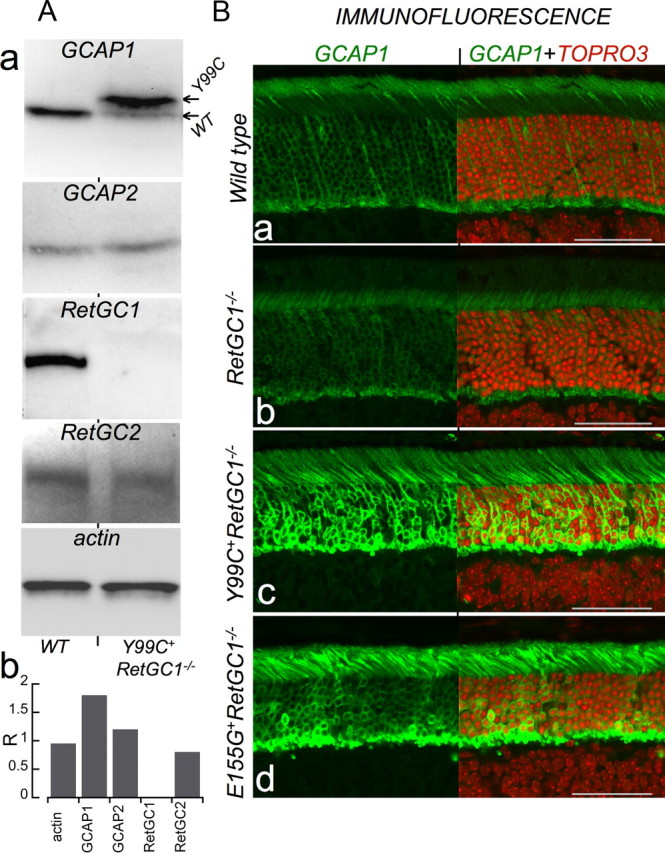
Constitutively active GCAP1 transgene is strongly expressed in RetGC1−/− rods. A, Immunoblotting of retina samples from WT and Y99C+RetGC1−/− mice (a), from top to bottom: GCAP1, the arrows indicate the position of the transgenic Y99C GCAP1 (top band) and the endogenous WT GCAP1 (bottom band (for details, see Olshevskaya et al., 2004); GCAP2; RetGC1; RetGC2; β-actin; and their respective semiquantitative comparison (b) by the relative chemiluminescence intensity (R) to the WT. B, FITC anti-GCAP1 IF (left). The cryosections from WT (a), RetGC1−/− (b), Y99C+RetGC1−/− (c), and E155G+RetGC1−/− (d) retinas at 1 month of age were probed with anti-GCAP1 antibody as described in Materials and Methods. In the right portion of each image, the nuclei counterstained with TO-PRO-3 (red) are also shown in the same frame to mark the histological layers. Scale bar, 50 μm. The eyes were fixed and processed using the same protocol, and the GCAP1 fluorescence images were acquired using identical settings for excitation and image acquisition. The staining in a–c was processed simultaneously and in d under identical conditions using the same reagents and staining procedure.
GCAP2 gene knock-out has different effect on rod recovery in RetGC1−/− and RetGC2−/− mice
One could argue that the in vivo selectivity between RetGC1 and RetGC2 exists only for the two tested constitutively active GCAP1 mutants, not necessarily for the normal GCAP1. To evaluate the general possibility that GCAP1 selectively targets RetGC1 in vivo, we compared the rates of rod recovery using gene knock-out hybrids that expressed only one of the RetGC isozymes and only GCAP1 to mediate the Ca2+ feedback. To produce those hybrids, RetGC1−/− or RetGC2−/− mice were crossed with GCAP2−/− mice, which have a disrupted GUCA1B gene but continue to express GCAP1, RetGC1, and RetGC2 (Makino et al., 2008). For the comparison with the mice completely lacking Ca2+ feedback to the particular cyclase isozyme, we also combined either RetGC1 or RetGC2 gene knock-out with the GCAP1,2−/− double knock-out, in which a portion of the chromosome containing the adjacent GUCA1A and GUCA1B genes was deleted (Mendez et al., 2001). The GCAP1,2−/− retinas express normal complement of RetGC isozymes but recover very slowly, because their basal activity is not accelerated after photoexcitation (Mendez et al., 2001; Burns et al., 2002).
The RetGC1−/− or RetGC2−/− mice bred into GCAP1,2−/− or GCAP2−/− background were tested for their mass rod response recovery after a bright flash using a paired-flashes ERG paradigm (Lyubarsky and Pugh, 1996) (Fig. 8). It needs to be emphasized that RetGC1−/− a-wave recovers slightly slower than in the WT in paired-flashes ERG experiments, despite its amplitude being greatly diminished (Yang et al., 1999; Baehr et al., 2007). The amplitudes of the test flash response varied between different genotypes (380, 98, 137, 47, 224, 320, and 171 μV in WT, RetGC1−/−, RetGC1−/−GCAP2−/−, RetGC1−/−GCAP1,2−/−, RetGC2−/−, RetGC2−/−GCAP2−/−, and RetGC2−/−GCAP1,2−/− mice, respectively). Note that, although WT rods would recover faster from “test” flashes of lower amplitude (which is, by decreasing the flash strength), the average “test ” a-wave amplitude and the speed of the recovery among the genotypes in our experiments (0.6, 0.7, 1.2, 1.4, 0.65, 0.7, and 1.8 s half-recovery time, respectively) did not correlate. The strength of the flashes was always standard and the difference was only in genotype. Consistent with previous reports (Yang et al., 1999; Baehr et al., 2007), rod responses in RetGC1−/− and RetGC2−/− mice were markedly different from each other in their a-wave amplitudes, but in both they recovered only slightly behind the WT. Likewise, in both RetGC1−/− and RetGC2−/−, the recovery became very sluggish after elimination of the two GCAPs together (Fig. 8B,C). However, elimination of GCAP2 alone affected the speed of recovery in RetGC1−/− versus RetGC2−/− mice in a very different manner. Whereas RetGC2−/−GCAP2−/− recovered at nearly the same rate as RetGC2−/−, the recovery in RetGC1−/−GCAP2−/− was strongly delayed compared with RetGC1−/− (Fig. 8A). These results argue that, in the absence of GCAP2, the RetGC1 isozyme of the cyclase can and the RetGC2 isozyme cannot effectively receive Ca2+ feedback through the remaining GCAP1.
Figure 8.

Scotopic ERG recovery of RetGC1−/− and RetGC2−/− retinas in GCAP1,2−/− and GCAP2−/− backgrounds. A, Rod recovery was assessed by paired-flashes scotopic ERG a-wave using a white “probe” flash (∼500 × 103 photons/μm−2 at cornea), delivered at different interstimulus time intervals (IST) after the conditioning test flash suppressing the circulating current (510 nm, ∼5 × 10³ photons/μm−2 at cornea). Two sets of representative raw traces for RetGC1−/− (a) and RetGC1−/−GCAP2−/− (b) mice, respectively, are shown as an example; note the delayed recovery of the probe flash ERG (arrows) in the RetGC1−/−GCAP2−/− genotype. B, C, Average fractional recovery (r) in 16 WT (○), 10 RetGC1−/− (▵), 16 RetGC1−/−GCAP2−/− (▴), 12 RetGC1−/−GCAP1,2−/− (●), 13 RetGC2−/− (□), 11 RetGC2−/−GCAP2−/− (■), and 16 RetGC2−/−GCAP1,2−/− (♦) mice aged 2 months. The lack of GCAP2 markedly extends the recovery in RetGC1−/− mice (B) but not in RetGC2−/− mice (C). The probe flash a-wave amplitude at indicated interstimulus intervals was normalized by that of a probe flash response amplitude delivered without the test flash. The time for a 50% recovery in WT, RetGC1−/−, RetGC1−/−GCAP2−/−, RetGC1−/−GCAP1,2−/−, RetGC2−/−, RetGC2−/−GCAP2−/−, and RetGC2−/−GCAP1,2−/− mice was 0.6, 0.7, 1.2, 1.4, 0.65, 0.7, and 1.8 s, respectively.
Discussion
Two photoreceptor calcium-sensor proteins, GCAP1 and GCAP2, activate membrane guanylyl cyclase in a “relay” manner (Makino et al., 2008), but mutations in GCAP1 cause photoreceptor degeneration in humans. Ca2+-insensitive GCAP1 mutants causing the disease trigger apoptotic photoreceptor death in transgenic mice by deregulating cGMP synthesis (Olshevskaya et al., 2004; Woodruff et al., 2007). Because GCAP1 effectively regulates both RetGC1 and RetGC2 in vitro (Peshenko et al., 2011), the goal of our study was to identify the target isozyme for the mutant GCAP1 in vivo (Fig. 1). GCAP and RetGC cannot interact in the presence of detergents required for extraction of RetGC from the membrane (Koch, 1991), which makes biochemical isolation of GCAP/RetGC complexes (e.g., by coimmunoprecipitation) impossible. Instead, we used a comparative study of retinal degeneration and cyclase regulation in transgenic mice expressing a constitutively active GCAP1 but lacking one of the RetGC isozymes. We reasoned that, in the absence of the target isozyme, the Ca2+ sensitivity of cGMP synthesis would return to the normal Ca2+ range even in the presence of Ca2+-insensitive GCAP1.
Transgenic expression of constitutively active GCAP1 in the absence of RetGC1 provides massive rescue of rod photoreceptors—both morphological (Fig. 2) and functional (Fig. 3). In contrast, no evidence for similar rescue was found in mice lacking RetGC2 isozyme (Fig. 4). Last, transgenically expressed constitutively active GCAP1 fails to shift Ca2+ sensitivity of cGMP synthesis in RetGC1−/− but not RetGC2−/− retinas (Fig. 5). These findings implicate RetGC1 as a preferential target for the mutant GCAP1 in vivo.
It is not completely clear why most, but not all, RetGC1−/− rods expressing mutant GCAP1 were rescued (Fig. 2). Inactivation and rapid loss of RetGC1−/− cones (Yang et al., 1999) could only account for ∼3% reduction of photoreceptor nuclei count in Y99C+RetGC1−/− retinas, which leaves >25% photoreceptors unaccounted for. As a likely reason, the levels of the transgenic overexpression, which usually varies between different cells, may become high enough in some of them to provoke protein overload response, thus eliminating such cells before their complete differentiation. The rest of the RetGC1−/− rods evidently tolerate high levels of the mutant GCAP1 expression—they escape early death and mature by 1 month of age (Fig. 7). It is particularly important to reiterate that the cyclase sensitivity to Ca2+ in the matured Y99C+RetGC1−/− or E155G+RetGC1−/− rods overexpressing mutant GCAP1 becomes normal (Fig. 5B), and this can explain why TUNEL does not reveal apoptotic activity in the differentiated Y99C+RetGC1−/− rods (Fig. 4D). In contrast, mutant GCAP1 still causes abnormal regulation of the cyclase (Fig. 5C) and continues to exert apoptotic DNA fracture in mature RetGC2−/− photoreceptors (Fig. 4D).
RetGC2 activity in Y99C+RetGC1−/− or E155G+RetGC1−/− rods is sufficient to preserve their photoresponse, albeit at lower than WT levels (Fig. 3). It is important to note that full restoration of this function could not be expected even if all rods were rescued from degeneration, because the parental RetGC1−/− genotype per se has diminished rod ERG, a previously established phenomenon, which appears paradoxical considering the near-normal single rod responses in this genotype (Yang et al., 1999; Baehr et al., 2007). Taking this into account, the functional rescue of Y99C+RetGC1−/− and E155G+RetGC1−/− rods appears quite efficient. The average a-wave amplitude in the Y99C+RetGC1−/− ERG was even slightly larger than in the parental RetGC1−/− mice (Fig. 3C), perhaps as a result of outcrossing of a highly inbred RetGC1−/− line.
The most unexpected biochemical finding from this study is that only RetGC1 and not RetGC2 becomes deregulated by the constitutively active GCAP1 (Figs. 5, 6). Evidently, this difference cannot be explained by much higher intrinsic binding affinity of GCAP1 to RetGC1, because mouse GCAP1 activates both native isozymes with fairly similar apparent affinities in purified mouse outer segment membranes (Peshenko et al., 2011). As we discussed above, the RetGC/GCAP complex cannot be directly isolated from the retina but can be detected functionally, based on the Ca2+ sensitivity of the cyclase, because in the absence of GCAPs both RetGC isozymes are completely insensitive to Ca2+ (Peshenko et al., 2011). The normal Ca2+ sensitivity of the cyclase in the Y99C+RetGC1−/− and E155G+RetGC1−/− retinas argues that mutated GCAP1 in living rods can form a stable complex with RetGC1 but not with RetGC2 (Fig. 5). Based on the study by Hwang et al. (2003), we can expect (Peshenko et al., 2011) that GCAP concentrations in mouse rods are as high as 7–9 μm, which would nearly saturate RetGC activity in vitro. Consistent with this, 10 μm purified recombinant Y99C or E155G GCAP1 added to the cyclase assay containing Y99C+RetGC1−/− or E155G+RetGC1−/− retina drastically shifts its Ca2+ sensitivity curve (Fig. 6). Hence, the mutated GCAP1 can effectively form a complex with RetGC2 when this isozyme becomes accessible to GCAP1 in retinal homogenate. However, no such shift occurs because of the transgenically expressed GCAP1. This indicates that not the intrinsic binding affinities of RetGC and GCAPs are at play, but rather presently unknown spatial organization or assembly processes in vivo preclude RetGC2 from tight association with the mutant GCAP1.
Is such restriction only characteristic of the Y99C and E155G GCAP1 or does it reflect a more general rule? This is a principal question, because multiple mutations in GCAP1 have already been linked to human retinal diseases, and it would be important to find whether or not mutations making GCAP1 into a constitutive activator would likely act via RetGC1 isozyme. The data in Figure 8 argue that, in contrast to the nearly indiscriminate RetGC/GCAP interactions in vitro, there is a strong selectivity imposed on GCAP1 interactions in vivo. RetGC1 can account for ∼70% and RetGC2 nearly 30% of the total maximal cGMP production in mouse rods (Peshenko et al., 2011), and each isozyme alone is evidently able to support their timely, almost as quickly as the WT, recovery (Yang et al., 1999; Baehr et al., 2007). However, elimination of GCAP2 causes rod ERG in the RetGC1−/− mice to recover much slower—nearly as slow as in a complete absence of the Ca2+ feedback (Fig. 8B). This indicates that even the normal endogenous GCAP1 has limited access to the remaining RetGC2 isozyme and regulates it with a very low efficiency (if any). At the same time, the absence of GCAP2 has little effect on RetGC2−/− rod recovery (Fig. 8C), so GCAP1 in these rods evidently continues to regulate the remaining RetGC1 isozyme in a normal manner. Consequently, from the general ability of GCAP1 to effectively activate only RetGC1 in vivo, we should expect that not just Y99C or E155G but other disease-related GCAP1 as well would also selectively target RetGC1.
GCAP1 fails to provide efficient Ca2+ feedback to RetGC2 in vivo not because its intrinsic binding affinity or the extent of RetGC2 activation are too low—they are both comparably high when tested at physiological concentrations in vitro (Peshenko et al., 2011). The selectivity would rather come from structural and/or spatial organization of the RetGC/GCAP complexes in living rods, limiting GCAP1 access to RetGC1. It could be imposed by a presently unidentified sorting mechanism that allows RetGC1/GCAP1 but not RetGC2/GCAP1 complex into the outer segment. GCAP1 localization in the inner segment and cell body of the RetGC1−/− rods (Fig. 7B) supports such a possibility. Whereas the endogenous GCAP1 and the Y99C mutant transgenically expressed in mouse rods both tend to accumulate in the outer segment (Olshevskaya et al., 2004), the Y99C GCAP1 is instead accumulated in the cell body and inner segment in nondegenerating RetGC−/−, Y99C+RetGC1−/−, and E155G+RetGC1−/− rods (Fig. 7B). Evidently, accumulation in the cell body per se does not reflect the events leading to rod degeneration but rather suggests that RetGC1 is needed to guide GCAP1 to the outer segment. Alternatively (or additionally), factor(s) destabilizing GCAP1 complex with RetGC2 or hampering their mutual access may be present directly in the outer segment, because some of the mutant GCAP1 likely diffuses into the Y99C+RetGC1−/− outer segment (Fig. 7B) but nonetheless does not affect Ca2+ sensitivity of the remaining RetGC2 isozyme (Fig. 5). Only future studies could identify cellular factors involved in the GCAP1 selectivity, but we can already rule out an irreversible posttranslational modification of RetGC2 as one of them, because native RetGC2 binds purified normal GCAP1 (Peshenko et al., 2011) and constitutively active GCAP1 (Fig. 6) in crude retinal homogenates.
The absence of a major effect of GCAP2 knock-out in RetGC2−/− ERG recovery (Fig. 8C) could make it tempting to speculate that GCAP2 does not provide Ca2+ feedback to RetGC1 in vivo. However, we should emphasize that such speculation cannot be derived from the present study, because it is quite possible that GCAP2 and GCAP1 compete for RetGC1 in RetGC2−/− rods and that, in the absence of GCAP2, the cyclase regulation can be taken over by the remaining GCAP1. This uncertainty could only be resolved by using RetGC1−/− and RetGC2−/− mice lacking GCAP1.
Footnotes
This work was supported by National Institutes of Health Grant EY11522 and a Pennsylvania Department of Health Formula Grant. We thank Ronald Barrett for help with histological sectioning. A.M.D. is the Martin and Florence Hafter Professor of Pharmacology.
References
- Baehr W, Karan S, Maeda T, Luo DG, Li S, Bronson JD, Watt CB, Yau KW, Frederick JM, Palczewski K. The function of guanylate cyclase 1 and guanylate cyclase 2 in rod and cone photoreceptors. J Biol Chem. 2007;282:8837–8847. doi: 10.1074/jbc.M610369200. [DOI] [PMC free article] [PubMed] [Google Scholar]
- Burns ME, Mendez A, Chen J, Baylor DA. Dynamics of cyclic GMP synthesis in retinal rods. Neuron. 2002;36:81–91. doi: 10.1016/s0896-6273(02)00911-x. [DOI] [PubMed] [Google Scholar]
- Dizhoor AM, Lowe DG, Olshevskaya EV, Laura RP, Hurley JB. The human photoreceptor membrane guanylyl cyclase, RetGC, is present in outer segments and is regulated by calcium and a soluble activator. Neuron. 1994;12:1345–1352. doi: 10.1016/0896-6273(94)90449-9. [DOI] [PubMed] [Google Scholar]
- Dizhoor AM, Olshevskaya EV, Henzel WJ, Wong SC, Stults JT, Ankoudinova I, Hurley JB. Cloning, sequencing, and expression of a 24-kDa Ca2+-binding protein activating photoreceptor guanylyl cyclase. J Biol Chem. 1995;270:25200–25206. doi: 10.1074/jbc.270.42.25200. [DOI] [PubMed] [Google Scholar]
- Dizhoor AM, Boikov SG, Olshevskaya EV. Constitutive activation of photoreceptor guanylate cyclase by Y99C mutant of GCAP-1. Possible role in causing human autosomal dominant cone degeneration. J Biol Chem. 1998;273:17311–17314. doi: 10.1074/jbc.273.28.17311. [DOI] [PubMed] [Google Scholar]
- Dizhoor AM, Olshevskaya EV, Peshenko IV. Calcium sensitivity of photoreceptor guanylyl cyclase (RetGC) and congenital photoreceptor degeneration: modeling in vitro and in vivo. In: Philippov PP, Koch KW, editors. Neuronal calcium sensor proteins. Hauppauge, NY: Nova Science Publishers; 2006. pp. 203–219. [Google Scholar]
- Dizhoor AM, Olshevskaya EV, Peshenko IV. Mg2+/Ca2+ cation binding cycle of guanylyl cyclase activating proteins (GCAPs): role in regulation of photoreceptor guanylyl cyclase. Mol Cell Biochem. 2010;334:117–124. doi: 10.1007/s11010-009-0328-6. [DOI] [PMC free article] [PubMed] [Google Scholar]
- Fu Y, Yau KW. Phototransduction in mouse rods and cones. Pflugers Arch. 2007;454:805–819. doi: 10.1007/s00424-006-0194-y. [DOI] [PMC free article] [PubMed] [Google Scholar]
- Gorczyca WA, Gray-Keller MP, Detwiler PB, Palczewski K. Purification and physiological evaluation of a guanylate cyclase activating protein from retinal rods. Proc Natl Acad Sci U S A. 1994;91:4014–4018. doi: 10.1073/pnas.91.9.4014. [DOI] [PMC free article] [PubMed] [Google Scholar]
- Gray-Keller MP, Detwiler PB. The calcium feedback signal in the phototransduction cascade of vertebrate rods. Neuron. 1994;13:849–861. doi: 10.1016/0896-6273(94)90251-8. [DOI] [PubMed] [Google Scholar]
- Hwang JY, Lange C, Helten A, Höppner-Heitmann D, Duda T, Sharma RK, Koch KW. Regulatory modes of rod outer segment membrane guanylate cyclase differ in catalytic efficiency and Ca2+-sensitivity. Eur J Biochem. 2003;270:3814–3821. doi: 10.1046/j.1432-1033.2003.03770.x. [DOI] [PubMed] [Google Scholar]
- Jeon CJ, Strettoi E, Masland RH. The major cell populations of the mouse retina. J Neurosci. 1998;18:8936–8946. doi: 10.1523/JNEUROSCI.18-21-08936.1998. [DOI] [PMC free article] [PubMed] [Google Scholar]
- Jiang L, Zhang H, Dizhoor AM, Boye SE, Hauswirth WW, Frederick JM, Baehr W. Long-term RNA interference gene therapy in a dominant retinitis pigmentosa mouse model. Proc Natl Acad Sci U S A. 2011;108:18476–18481. doi: 10.1073/pnas.1112758108. [DOI] [PMC free article] [PubMed] [Google Scholar]
- Kitiratschky VB, Behnen P, Kellner U, Heckenlively JR, Zrenner E, Jägle H, Kohl S, Wissinger B, Koch KW. Mutations in the GUCA1A gene involved in hereditary cone dystrophies impair calcium-mediated regulation of guanylate cyclase. Hum Mutat. 2009;30:E782–E796. doi: 10.1002/humu.21055. [DOI] [PubMed] [Google Scholar]
- Koch KW. Purification and identification of photoreceptor guanylate cyclase. J Biol Chem. 1991;266:8634–8637. [PubMed] [Google Scholar]
- Liu X, Pawlyk BS, Adamian M, Olshevskaya EV, Dizhoor AM, Makino CL, Li T. Increased light exposure alleviates one form of photoreceptor degeneration marked by elevated calcium in the dark. PLoS One. 2009;4:e8438. doi: 10.1371/journal.pone.0008438. [DOI] [PMC free article] [PubMed] [Google Scholar]
- Lowe DG, Dizhoor AM, Liu K, Gu Q, Spencer M, Laura R, Lu L, Hurley JB. Cloning and expression of a second photoreceptor-specific membrane retina guanylyl cyclase (RetGC), RetGC-2. Proc Natl Acad Sci U S A. 1995;92:5535–5539. doi: 10.1073/pnas.92.12.5535. [DOI] [PMC free article] [PubMed] [Google Scholar]
- Lyubarsky AL, Pugh EN., Jr Recovery phase of the murine rod photoresponse reconstructed from electroretinographic recordings. J Neurosci. 1996;16:563–571. doi: 10.1523/JNEUROSCI.16-02-00563.1996. [DOI] [PMC free article] [PubMed] [Google Scholar]
- Makino CL, Wen XH, Michaud N, Peshenko IV, Pawlyk B, Brush RS, Soloviev M, Liu X, Woodruff ML, Calvert PD, Savchenko AB, Anderson RE, Fain GL, Li T, Sandberg MA, Dizhoor AM. Effects of low AIPL1 expression on phototransduction in rods. Invest Ophthalmol Vis Sci. 2006;47:2185–2194. doi: 10.1167/iovs.05-1341. [DOI] [PubMed] [Google Scholar]
- Makino CL, Peshenko IV, Wen XH, Olshevskaya EV, Barrett R, Dizhoor AM. A role for GCAP2 in regulating the photoresponse. Guanylyl cyclase activation and rod electrophysiology in GUCA1B knock-out mice. J Biol Chem. 2008;283:29135–29143. doi: 10.1074/jbc.M804445200. [DOI] [PMC free article] [PubMed] [Google Scholar]
- Mendez A, Burns ME, Sokal I, Dizhoor AM, Baehr W, Palczewski K, Baylor DA, Chen J. Role of guanylate cyclase-activating proteins (GCAPs) in setting the flash sensitivity of rod photoreceptors. Proc Natl Acad Sci U S A. 2001;98:9948–9953. doi: 10.1073/pnas.171308998. [DOI] [PMC free article] [PubMed] [Google Scholar]
- Michaelides M, Wilkie SE, Jenkins S, Holder GE, Hunt DM, Moore AT, Webster AR. Mutation in the gene GUCA1A, encoding guanylate cyclase-activating protein 1, causes cone, cone-rod, and macular dystrophy. Ophthalmology. 2005;112:1442–1447. doi: 10.1016/j.ophtha.2005.02.024. [DOI] [PubMed] [Google Scholar]
- Olshevskaya EV, Hughes RE, Hurley JB, Dizhoor AM. Calcium binding, but not a calcium-myristoyl switch, controls the ability of guanylyl cyclase-activating protein GCAP-2 to regulate photoreceptor guanylyl cyclase. J Biol Chem. 1997;272:14327–14333. doi: 10.1074/jbc.272.22.14327. [DOI] [PubMed] [Google Scholar]
- Olshevskaya EV, Calvert PD, Woodruff ML, Peshenko IV, Savchenko AB, Makino CL, Ho YS, Fain GL, Dizhoor AM. The Y99C mutation in guanylyl cyclase-activating protein 1 increases intracellular Ca2+ and causes photoreceptor degeneration in transgenic mice. J Neurosci. 2004;24:6078–6085. doi: 10.1523/JNEUROSCI.0963-04.2004. [DOI] [PMC free article] [PubMed] [Google Scholar]
- Palczewski K, Subbaraya I, Gorczyca WA, Helekar BS, Ruiz CC, Ohguro H, Huang J, Zhao X, Crabb JW, Johnson RS, Walsh KA, Gray-Keller MP, Detwiller PB, Baehr W. Molecular cloning and characterization of retinal photoreceptor guanylyl cyclase-activating protein. Neuron. 1994;13:395–404. doi: 10.1016/0896-6273(94)90355-7. [DOI] [PubMed] [Google Scholar]
- Payne AM, Downes SM, Bessant DA, Taylor R, Holder GE, Warren MJ, Bird AC, Bhattacharya SS. A mutation in guanylate cyclase activator 1A (GUCA1A) in an autosomal dominant cone dystrophy pedigree mapping to a new locus on chromosome 6p21.1. Hum Mol Genet. 1998;7:273–277. doi: 10.1093/hmg/7.2.273. [DOI] [PubMed] [Google Scholar]
- Peshenko IV, Dizhoor AM. Guanylyl cyclase-activating proteins (GCAPs) are Ca2+/Mg2+ sensors: implications for photoreceptor guanylyl cyclase (RetGC) regulation in mammalian photoreceptors. J Biol Chem. 2004;279:16903–16906. doi: 10.1074/jbc.C400065200. [DOI] [PubMed] [Google Scholar]
- Peshenko IV, Dizhoor AM. Ca2+ and Mg2+ binding properties of GCAP-1. Evidence that Mg2+-bound form is the physiological activator of photoreceptor guanylyl cyclase. J Biol Chem. 2006;281:23830–23841. doi: 10.1074/jbc.M600257200. [DOI] [PubMed] [Google Scholar]
- Peshenko IV, Olshevskaya EV, Savchenko AB, Karan S, Palczewski K, Baehr W, Dizhoor AM. Enzymatic properties and regulation of the native isozymes of retinal membrane guanylyl cyclase (RetGC) from mouse photoreceptors. Biochemistry. 2011;50:5590–5600. doi: 10.1021/bi200491b. [DOI] [PMC free article] [PubMed] [Google Scholar]
- Pugh EN, Jr, Duda T, Sitaramayya A, Sharma RK. Photoreceptor guanylate cyclases: a review. Biosci Rep. 1997;17:429–473. doi: 10.1023/a:1027365520442. [DOI] [PubMed] [Google Scholar]
- Pugh EN, Jr, Nikonov S, Lamb TD. Molecular mechanisms of vertebrate photoreceptor light adaptation. Curr Opin Neurobiol. 1999;9:410–418. doi: 10.1016/S0959-4388(99)80062-2. [DOI] [PubMed] [Google Scholar]
- Sakurai K, Chen J, Kefalov VJ. Role of guanylyl cyclase modulation in mouse cone phototransduction. J Neurosci. 2011;31:7991–8000. doi: 10.1523/JNEUROSCI.6650-10.2011. [DOI] [PMC free article] [PubMed] [Google Scholar]
- Sokal I, Li N, Surgucheva I, Warren MJ, Payne AM, Bhattacharya SS, Baehr W, Palczewski K. GCAP1 (Y99C) mutant is constitutively active in autosomal dominant cone dystrophy. Mol Cell. 1998;2:129–133. doi: 10.1016/s1097-2765(00)80121-5. [DOI] [PubMed] [Google Scholar]
- Sokal I, Dupps WJ, Grassi MA, Brown J, Jr, Affatigato LM, Roychowdhury N, Yang L, Filipek S, Palczewski K, Stone EM, Baehr W. A novel GCAP1 missense mutation (L151F) in a large family with autosomal dominant cone-rod dystrophy (adCORD) Invest Ophthalmol Vis Sci. 2005;46:1124–1132. doi: 10.1167/iovs.04-1431. [DOI] [PMC free article] [PubMed] [Google Scholar]
- Tsien R, Pozzan T. Measurement of cytosolic free Ca2+ with quin2. Methods Enzymol. 1989;172:230–262. doi: 10.1016/s0076-6879(89)72017-6. [DOI] [PubMed] [Google Scholar]
- Wilkie SE, Li Y, Deery EC, Newbold RJ, Garibaldi D, Bateman JB, Zhang H, Lin W, Zack DJ, Bhattacharya SS, Warren MJ, Hunt DM, Zhang K. Identification and functional consequences of a new mutation (E155G) in the gene for GCAP1 that causes autosomal dominant cone dystrophy. Am J Hum Genet. 2001;69:471–480. doi: 10.1086/323265. [DOI] [PMC free article] [PubMed] [Google Scholar]
- Woodruff ML, Sampath AP, Matthews HR, Krasnoperova NV, Lem J, Fain GL. Measurement of cytoplasmic calcium concentration in the rods of wild-type and transducin knock-out mice. J Physiol. 2002;542:843–854. doi: 10.1113/jphysiol.2001.013987. [DOI] [PMC free article] [PubMed] [Google Scholar]
- Woodruff ML, Olshevskaya EV, Savchenko AB, Peshenko IV, Barrett R, Bush RA, Sieving PA, Fain GL, Dizhoor AM. Constitutive excitation by Gly90Asp rhodopsin rescues rods from degeneration caused by elevated production of cGMP in the dark. J Neurosci. 2007;27:8805–8815. doi: 10.1523/JNEUROSCI.2751-07.2007. [DOI] [PMC free article] [PubMed] [Google Scholar]
- Yang RB, Foster DC, Garbers DL, Fülle HJ. Two membrane forms of guanylyl cyclase found in the eye. Proc Natl Acad Sci U S A. 1995;92:602–606. doi: 10.1073/pnas.92.2.602. [DOI] [PMC free article] [PubMed] [Google Scholar]
- Yang RB, Robinson SW, Xiong WH, Yau KW, Birch DG, Garbers DL. Disruption of a retinal guanylyl cyclase gene leads to cone-specific dystrophy and paradoxical rod behavior. J Neurosci. 1999;19:5889–5897. doi: 10.1523/JNEUROSCI.19-14-05889.1999. [DOI] [PMC free article] [PubMed] [Google Scholar]