Background: Unpredictable clinical behavior of glioblastoma multiforme suggests distinct molecular subtypes.
Results: Metabolic profiles of different glioblastoma lines indicate distinct subtypes correlated with gene expression differences.
Conclusion: A subset of metabolites can be used to distinguish between four subtypes of glioblastomas.
Significance: Metabolic profiling of cancers provides a way for subtype determination with possible diagnostic and prognostic applications.
Keywords: Bioinformatics, Glioblastoma, Metabolomics, Transcriptomics, Tumor Metabolism
Abstract
Glioblastoma multiforme (GBM) is the most common form of malignant glioma, characterized by unpredictable clinical behaviors that suggest distinct molecular subtypes. With the tumor metabolic phenotype being one of the hallmarks of cancer, we have set upon to investigate whether GBMs show differences in their metabolic profiles. 1H NMR analysis was performed on metabolite extracts from a selection of nine glioblastoma cell lines. Analysis was performed directly on spectral data and on relative concentrations of metabolites obtained from spectra using a multivariate regression method developed in this work. Both qualitative and quantitative sample clustering have shown that cell lines can be divided into four groups for which the most significantly different metabolites have been determined. Analysis shows that some of the major cancer metabolic markers (such as choline, lactate, and glutamine) have significantly dissimilar concentrations in different GBM groups. The obtained lists of metabolic markers for subgroups were correlated with gene expression data for the same cell lines. Metabolic analysis generally agrees with gene expression measurements, and in several cases, we have shown in detail how the metabolic results can be correlated with the analysis of gene expression. Combined gene expression and metabolomics analysis have shown differential expression of transporters of metabolic markers in these cells as well as some of the major metabolic pathways leading to accumulation of metabolites. Obtained lists of marker metabolites can be leveraged for subtype determination in glioblastomas.
Introduction
Tumor cells have a remarkably different metabolism than the tissues they derive from. Many key oncogenic signaling pathways converge to create this change to support growth and survival of cancer cells (1). The unique metabolic phenotype associated with cancer is in general characterized by (a) high glucose uptake; (b) increased glycolytic activity; (c) decreased mitochondrial activity for energy production; (d) low bioenergetic expenditure; (e) increased phospholipid turnover, altered lipid profile, and increase of de novo lipid synthesis; (f) increased amino acid transport along with elevated protein and DNA synthesis; (g) increased hypoxia; and (h) increased tolerance to reactive oxygen species (1, 2). However, these general characteristics differ widely across cancer types and subtypes (1, 2). Understanding how cancer subtypes derive energy and necessary building blocks, even from a nutrient-depleted environment, is of fundamental importance for the development of appropriate therapies and diagnostic approaches (2–4). Cancer metabolic phenotype has been explored for several years in cancer diagnostics performed by magnetic resonance spectroscopy as well as PET scanning. With better description of metabolic differences among tumor subtypes, these methods can be used for noninvasive subtyping of tumors and thus improved patient stratification. One of the major applications of noninvasive diagnosis and follow-up is in brain tumors. Metabolic profiling of brain normal and tumor samples has been performed for a number of years with early studies published more than three decades ago (Ref. 5 and references therein). Recent studies have further highlighted the possibility of diagnosing major brain tumor types in a noninvasive manner (6, 7).
Glioblastoma multiforme (GBM)4 is the most common form of malignant brain cancer in adults with very poor prognosis and a dire need for improvement in patient stratification and treatment. Several groups have turned to high dimensional profiling studies to better describe GBMs. Recent work performed as part of the Cancer Genome Atlas Network has analyzed genomic abnormalities in GBM samples (8). This analysis has identified four clinically relevant subtypes of GBMs that were characterized by abnormalities in PDGFRA, IDH1, EGFR, and NF1 among other alterations. Platelet-derived growth factor receptors (PDGFRs) are catalytic receptors that have intracellular tyrosine kinase activity. They regulate many biological processes including embryonic development, angiogenesis, cell proliferation, and differentiation. Isocitrate dehydrogenases (IDHs) function at a crossroad of cellular metabolism and are involved in lipid synthesis, cellular defense against oxidative stress, oxidative respiration, and oxygen-sensing signal transduction. IDHs catalyze the oxidative decarboxylation of isocitrate to α-ketoglutarate and the reduction of NAD(P)+ to NAD(P)H. Mutated IDH1 and IDH2 possess a different active site that appears to promote metabolism of α-ketoglutarate (product of wild-type IDH1 and IDH2) into the oncometabolite 2-hydroxyglutarate. Epidermal growth factor receptor (EGFR) is a transmembrane glycoprotein that binds to epidermal growth factor. Among its many functions, EGFR has been linked to the mechanism that reduces cell membrane permeability to choline (9, 10). One of the most common oncogenic events observed in GBMs is the amplification and overexpression of EGFR kinase that occurs in 40–60% of primary GBMs (11). Furthermore, a truncated version of this kinase (EGFRvIII) is expressed in 20–30% of GBM patients and results in constitutive activation of this signaling pathway (12). The neurofibromin 1 (NF1) gene is suggested to act as a negative regulator of the Ras signaling transduction pathway (13). Gain of function for Ras, among other oncogenes, induces HIF-1 expression by deregulation of the mammalian target of rapamycin (mTOR) pathway (1). Abnormalities in all four of the aforementioned molecular targets can influence brain tumor cell metabolism, and this can possibly be observed through analysis of metabolic profiles.
High throughput metabolite profiling (metabolomics) provides unbiased analysis of metabolic differences. Metabolomics is particularly important in the search for biomarkers that can eventually be used for in vivo diagnosis and prognosis with methods such as magnetic resonance spectroscopy. Currently, magnetic resonance spectroscopy is the only available method for in vivo molecular analysis of brain tumors and is gaining an increasing role in clinical assessment of patients (6). The first step toward devising a metabolite-based noninvasive glioblastoma subtyping method is to identify metabolite-based subtypes and to determine major metabolic markers in cancer subtypes. Cell culture analysis provides an excellent, controlled, homogeneous setting for initial identification of metabolic profiles and is a prerequisite to the analysis of more complex tumor tissue or biopsy samples.
NMR analysis of brain tumor cell cultures has been performed for number of years with some of the first detailed studies appearing in the early 1990s (14). Brain tumor cell cultures provide a way for creating a sufficient amount of sample through passaging of cells while avoiding problems caused by heterogeneity and confounders. In 1995, Florian et al. (7, 15) used in vitro 1H NMR spectroscopy and chromatographic analyses to compare metabolic properties of three types of human brain and nervous system tumor cell lines. Obtained spectra from meningiomas (six lines), neuroblastomas (three lines), and glioblastomas (five lines) displayed some similarities such as the presence of signals from leucine-, isoleucine-, valine-, threonine-, lactate-, acetate-, glutamate-, glycine-, and choline-containing compounds. Meningioma spectra featured relatively high signals from alanine. Intense signals from creatine were present in neuroblastoma but not in glioblastoma spectra. Statistically significant differences were found in the amounts of alanine, glutamate, creatine, phosphorylcholine, and threonine among the types of tumors examined. Overall, it has been observed that neuroblastoma, glioma, and meningioma cells display a low concentration of normal neural metabolites, such as N-acetylaspartate, γ-amino butyrate (GABA), and taurine. The most discriminatory metabolites for tumor cell types include total creatine (creatine and phosphocreatine), total choline (phosphocholine, glycerophosphocholine, and choline), alanine, taurine, and glutamate.
In this work, we have included nine different glioblastoma cell lines and explored the hypothesis that GBM subtypes can be determined from metabolic profiles. To this end, we have analyzed in detail the specific metabolic characteristics of different glioblastoma cell lines and determined significant metabolic differences among metabolically resolved GBM subtypes. Metabolic profiles were compared with publicly available gene expression data to determine relationships between metabolic and gene expression differences among proposed subtypes of GBMs.
EXPERIMENTAL PROCEDURES
Cell Lines and in Vitro Culture Conditions
Human glioma cells A172, BS149, Hs683, LN18, LN229, LN319, LN405, U343MG, and U373 were maintained in DMEM supplemented with 10% fetal bovine serum (FBS) and antibiotics (Invitrogen). The “BS” series was generated at the University of Basel, whereas the “LN” series was generated by Erwin Van Meir in Lausanne, Switzerland. All cell lines were a kind gift of Adrian Merlo (Laboratory of Molecular Neuro-oncology, University of Basel, Basel, Switzerland). Prior to metabolite isolation, 1 × 10⁶ cells were seeded in quintuplicate in 10-cm culture dishes and incubated for 48 h at 37 °C and 5% CO2. Cells were then harvested by scraping and rinsed with 5 ml of PBS. The mixture was centrifuged at 4,000 relative centrifugal force for 1 min. Supernatant was discarded, and the cell pellet was again rinsed with 5 ml of PBS. Upon centrifugation at 4,000 relative centrifugal force for 1 min, cell pellets were kept on ice for 5 min before being resuspended in 1 ml of ice-cold 50% acetonitrile. Cell suspensions were kept on ice for 10 min before centrifugation at 16,000 relative centrifugal force for 10 min at 4 °C. The aqueous acetonitrile extract solutions were dried down under a stream of N2.
Total RNA Isolation and PCR Amplification
Total RNA isolation and subsequent cDNA synthesis from GBM cell lines were performed as described previously (16). The primers listed in Table 1 were designed and synthesized by Integrated DNA Technologies (Coralville, IA) (Table 1). PCR was conducted using the EconoTaq PLUS (Lucigen, Middleton, WI) reagents as per the manufacturer's instructions. Cycles performed for amplification consisted of an initial step of 5 min at 94 °C followed by the amplification steps of 94 °C for 30 s, 56 °C (EGFR, PDGFRA, and GAPDH) or 60 °C (NF1 and IDH) for 30 s, and 72 °C for 30 s (PDGFRA, NF1, IDH1, and GAPDH) or 90 s (EGFR); the final step was 72 °C for 5 min. PCR products were separated on a 1% agarose gel. Fragments of ∼100–280 bp (PDGFRA, NF1, IDH1, and GAPDH) and ∼1000 bp (EGFR) corresponding to the expected fragment length were obtained.
TABLE 1.
PCR primers for measurement of gene expression values for marker genes
| Gene | Forward primer | Reverse primer |
|---|---|---|
| EGFR | 5′-ATGCGACCCTCGGGGACG-3′ | 5′-GAGTATGTGTGAAGGAGT-3′ |
| PDGFRA | 5′-AGCTGATCCGTGCTAAGGAA-3′ | 5′-ATCGACCAAGTCCAGAATGG-3′ |
| NF1 | 5′-TTGGTTATAAGCGGCCTCAC-3′ | 5′-TTTCTGGCAGCAACTGTTTG-3′ |
| IDH1 | 5′-TGGGCCTGGAAAAGTAGAGA-3′ | 5′-CAAAGGCCAACCCTTAGACA-3′ |
| GAPDH | 5′-CGGGTGATGCTTTTCCTAGA-3′ | 5′-GACAAGCTTCCCGTTCTCAG-3′ |
NMR Experimentation
The residue obtained after drying was dissolved in 0.6 ml of deuterium oxide (Aldrich, 99.96 atom % 2H), pipetted into a 5-mm NMR tube for NMR analysis. All 1H NMR measurements were performed on a Bruker Avance III 400 MHz spectrometer at 298 K. One-dimensional spectra were obtained using a gradient water presaturation method with 512 scans (pulse sequence zgesgp). NMR spectra were processed using Mnova with exponential apodization (exponent 1); global phase correction; Bernstein-Polynomial baseline correction; Savitzky-Golay line smoothing; and normalization using total spectral area as provided in Mnova. Spectral regions from 0 to 9 ppm were included in the normalization and analysis. Two-dimensional spectra including TOCSY, two-dimensional JRES, and HMQC using standard methods provided in TopSpin software (Bruker) were performed on one sample of each explored cell type with 70, 32, and 1,000 scans (number of transients per free induction decay, i.e. number of free induction decay acquired for each t1 data point), respectively. Mixing times for TOCSY experiments were adjusted to 80 ms. For precision and reproducibility, a total of 45 NMR experiments were carried out in quintuplicate (n = 5) on nine cell lines. Metabolite assignments were performed using two-dimensional measurements as well as one-dimensional 1H spectral data in comparison with metabolites database data and literature information.
Data Analysis
Data preprocessing including data organization, removal of undesired areas, and binning as well as data presentation was performed with Matlab vR2010b (MathWorks). Minor adjustments in peak positions (alignment) between different samples were performed using in-house alignment software.5 Principal component analysis (PCA) as well as fuzzy K-means cluster analysis were done using the Matlab platform as described previously (18). Feature selection was done with the significance analysis for microarrays (SAM) method (19). Peak assignment was performed using several methods developed in our group and elsewhere and was based on metabolic NMR databases (20–22). Spectra for 41 metabolites used in quantification were obtained from the Human Metabolome Database or Biological Magnetic Resonance Databank and further analyzed visually and compared with the obtained spectra.
Metabolite Quantification
An automated method for quantification based on multivariable linear regression of spectra with appropriately aligned metabolite data from databases was developed and utilized in the study. The assumption behind this approach is that the spectrum of a mixture is the same as the combination (sum) of spectra of individual components measured under the same conditions. If there are no chemical interactions among compounds in the mixture, this assumption generally holds, and the spectra of standards can be used for assignment and quantification of spectrum of a mixture measured under the same conditions (pH, temperature, etc.) and with the same NMR pulse sequence. Here relative metabolite concentrations were estimated using nonlinear curve fitting with the multivariate least squares approach. The linear regression result was used as the starting point, and the model was constrained to concentrations: c ± 0. NMR spectra of the mixtures (samples) are modeled as a sum of spectra for components (metabolites) in the mixture, i.e.
where cn is the concentration of the component, v is the spectral frequency point, and Ln(v) is the spectrum of metabolite n at v. Each compound can result in many peaks within spectra of mixtures thus having extensive overlapping of peaks. The deconvolution of spectra of mixtures, such as in metabolomics, with many strongly overlapping lines, possibly with an unknown number of lines and atomic groups, each with a different line width, is extremely difficult, and thus, it is important to determine an optimal solver for this problem. Generally, the solution is found by minimizing the square root of difference between the model and real spectrum ‖I − ¯I‖2 while using cn and possibly minor frequency change as variables or by solving the Equation 1 for cn. Several different methods for multivariate regression analysis provided in Matlab vR2010b were tested including partial least squares regression, robust fit, Levenberg-Marquardt curve fitting, and linear programming. The best result, i.e. the model with the minimal error determined as ‖I − ¯I‖2, was obtained with the Levenberg-Marquardt curve fitting, and this method was used for quantification of metabolic data used in further analysis. The Levenberg-Marquardt method is specifically designed for solving nonlinear curve fitting problems in the least squares sense and additionally allows the inclusion of constraint that concentrations have to be non-negative.
Quantification error is estimated by performing the multivariate linear regression analysis as described above but with one metabolite at the time removed from the analysis. In this way, we are estimating errors caused by omitting metabolites from the analysis and the uniqueness of spectral features for metabolite quantification. From quantitative values for each metabolite recalculated for each n − 1 metabolite subgroup, error is calculated as
 |
where n = 41 is the number of metabolites; ¯LF̄i is the mean value of concentration for metabolite i across all samples obtained when the complete set of metabolites is analyzed; and ¯LF̄̄Mi,k is the same concentration but when metabolite k is excluded from the analysis.
Microarray Data Analysis
Microarray datasets used in this work were previously published and validated for accuracy in RNA expression measurements (Ref. 16; available from GEO Databases in MIAMI format ID: GSE 15824). The description of methods used for sample processing, microarray experimentation, and validation is given in the original publication. These microarray data were analyzed using TMeV2.2 and Pathway Studio 8.0 (Ariadne Inc.). TMeV is the general data analysis software that includes many features such as normalization, clustering, classification, and statistical analysis. Pathway Studio is the commercial software that determines relationships among different types of biological molecules as well as biomedical terms based on extensive literature searches.
RESULTS AND DISCUSSION
NMR metabolite analysis was performed on nine GBM cell lines. Five independent (biological) replicates of cells were grown under the same optimal conditions. Selecting cell cultures with the same growth conditions ensured that there were no differences in the metabolic profiles caused by cellular environment. The metabolites were extracted from replicates of each of the nine cell lines using the procedure described under “Experimental Procedures.” One-dimensional 1H NMR spectra for 45 metabolic extracts were measured and used in the qualitative and quantitative analysis. Additionally, TOCSY, two-dimensional JRES, and HMQC spectra were obtained for one replicate of each cell type, and these two-dimensional data aided in metabolite assignment. The one-dimensional 1H NMR spectra obtained for each cell line and each replicate are shown in Fig. 1. Spectra of biological replicates show negligible differences.
FIGURE 1.
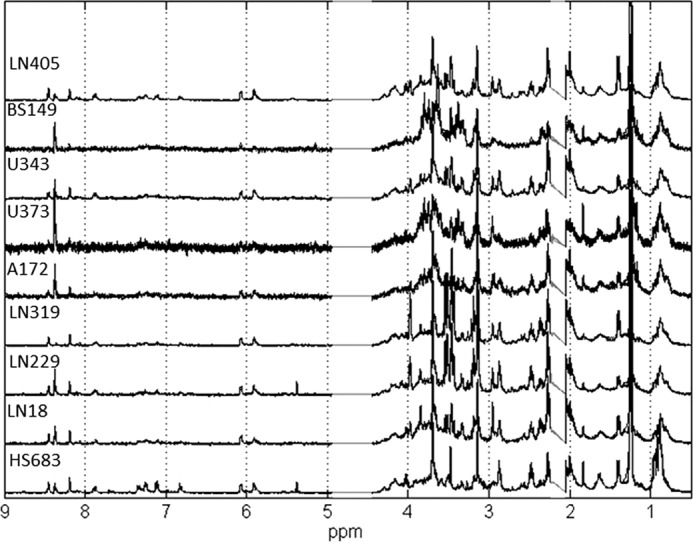
NMR spectra of five biological replicates for nine glioblastoma cell lines studied in this work. The good consistency among replicates is apparent from spectral traces. Only the spectral region between 0.5 and 9 ppm is shown. Spectral points in the region between 2.1 and 2.2 ppm contain residual hydrogen-containing solvent and are therefore removed, as well as the region of 4.5–5 ppm, which is affected by water suppression.
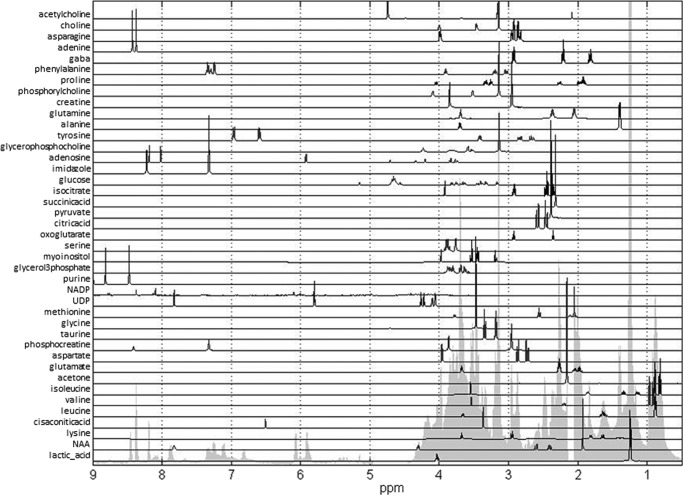
One-dimensional and two-dimensional spectra allow detailed assignment of metabolites. Metabolite assignment was based on literature data (23) and database information (20, 21) using both one-dimensional and two-dimensional measurements. Obtained metabolite assignments as well as spectra for each metabolite are shown in Fig. 2. These assignments were used for metabolite quantification described under “Experimental Procedures.”
FIGURE 2.
Spectra of metabolites used for multivariate linear regression analysis of glioblastoma spectra. Forty-one metabolites used in the analysis included all metabolites previously determined in NMR measurements of hydrophilic glioblastoma samples as well as samples of other cell lines. One-dimensional spectra of all 41 metabolites are shown in this figure along with the outline of the average spectrum for glioblastoma cell lines. Complete spectra of all metabolites were used in multivariate linear regression analysis.
Metabolic profiles analysis was performed qualitatively, directly on the spectra, as well as quantitatively, on quantified metabolic concentrations. Sample spectra and quantified metabolite concentrations were analyzed with unsupervised clustering methods to determine the similarities and differences between sample types in an unbiased fashion.
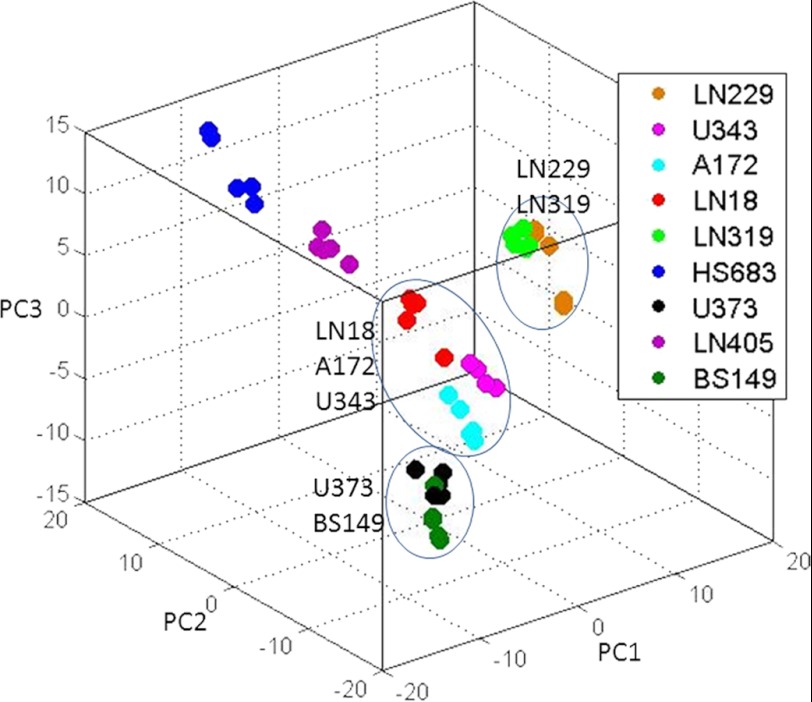
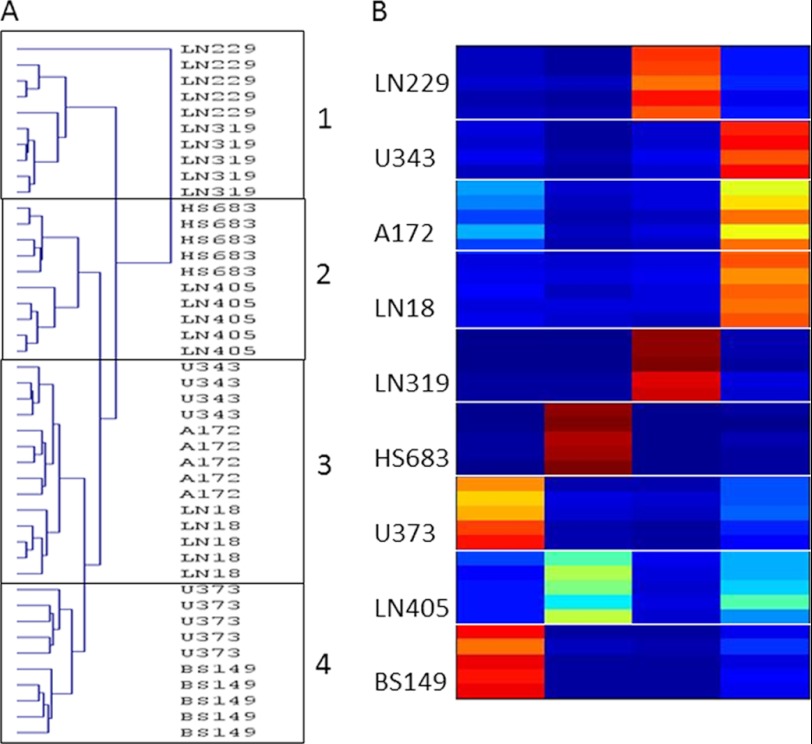
In the first level of analysis, the complete spectra were normalized using the total peak area normalization method. Experimental conditions were equalized (in terms of pH and temperature), resulting in spectra with complete chemical shift overlap that was verified using our spectral alignment tool (17). Thus, binning was not necessary, and the analysis was performed on complete spectra, ensuring that all measured spectral features were considered. The qualitative analysis of the major variances in the spectra was performed directly by using PCA (Fig. 3) as well as by clustering samples with the hierarchical clustering (HCL) (Fig. 4A) and fuzzy K-means methods (FKM) (Fig. 4B).
FIGURE 3.
Principal components analysis of spectral data for nine GBM cell lines. Metabolites were independently extracted and measured for five biological replicates corresponding to nine cell line types. The grouping of several cell types is apparent. Comparison between PCA results of spectral and quantified metabolic data is shown in supplemental Figs. 1 and 2.
FIGURE 4.
FKM and HCL clustering of spectral data. A, HCL result for cell samples. B, FKM determined membership values for each measurement, where red represents the membership value of 1, and dark blue corresponds to membership of 0. Higher membership value indicates stronger belonging to a cluster. FKM was calculated with m = 1.8. Comparison between FKM clustering of spectral and quantified metabolic data is shown in supplemental Fig. 3.
Fig. 3 shows the plot of principal components PC1, PC2, and PC3 for the five replicates of the nine cell lines studied. Grouping of replicates for each cell type is clear. In addition, there appears to be assembling of some cell types. Additional results of true clustering analysis are shown in Fig. 4. Fig. 4A presents sample clusters obtained using the HCL method. HCL allows feature grouping automatically from data without user input of cluster numbers. According to the HCL results, samples from the nine cell types can be grouped into four clusters. Finally, spectra were clustered using the FKM method, which was introduced to NMR metabolomics in Ref. 18. FKM calculates memberships or belongings of each feature (in this case sample) to each of the user-defined numbers of clusters. In this method, each feature belongs to some extent (defined by the membership value) to each group where a membership value near 1 indicates strong belonging and close to 0 indicates weak belonging or no belonging. Fig. 4B shows membership values for each sample for four clusters obtained using the FKM method. FKM memberships were calculated using the “fuzzification” factor m = 1.8 (where m = 1 defines crisp clustering), which provided the good balance between crisp and fuzzy clustering (24).
Cell replicates were co-clustered for all three methods. Although this can be expected, it still highlights the technical consistency of the experimental manipulations and, even more importantly, biological control of the metabolism performed by cells of the same type under similar conditions. Different cell lines appeared to cluster within subtypes of GBMs with four distinct groups: group 1, LN229 and LN319; group 2, HS683 and LN405; group 3, U343, A172, and LN18; and group 4, U373 and BS149. The same results were obtained with all three unsupervised methods. FKM, and to some extent PCA, showed that LN405 co-clusters mostly with HS683 but has some similarities with U343, A172 and LN18 group as well. Other samples appeared to be strongly associated with only one cluster.
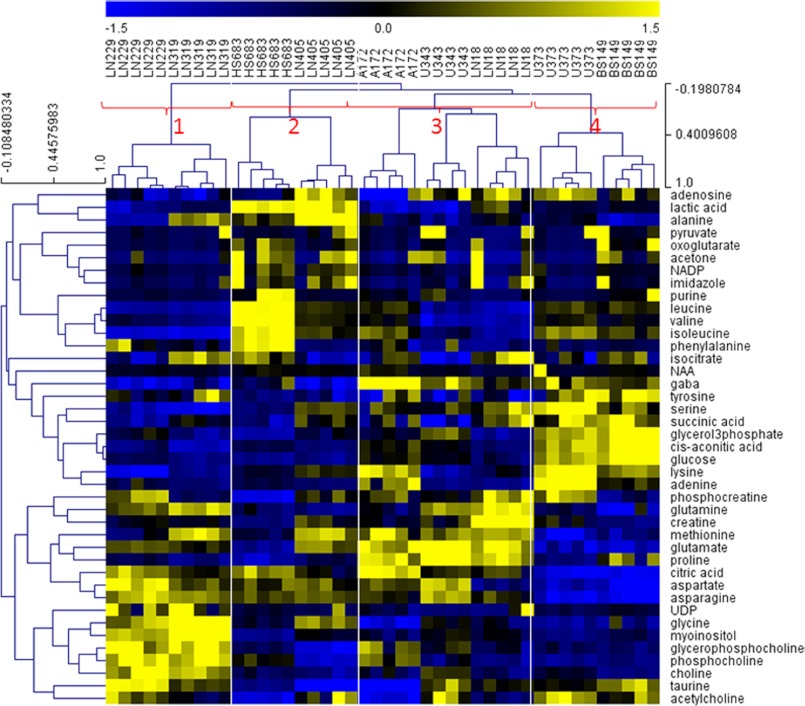
To determine specific metabolites that are distinct between these groups, we have performed metabolite quantification from spectral data. For this, we have utilized the multivariate linear regression fitting method, which tries to create models of data from metabolite (standard) spectra collected in databases. Metabolite spectra were manually aligned with the measurements to reduce errors caused by minor changes in peak positions. Relative metabolite concentrations were obtained as optimal multipliers for normalized spectra obtained in the fitting. Forty-one metabolites in total were used in the fitting. The list of analyzed metabolites and their spectra is shown in Fig. 2. Relative concentrations of each metabolite for each cell line as well as error estimates are shown in supplemental Table 1. HCL clustering of quantitative metabolic data following normalization is shown in Fig. 5. Comparison between PCA and FKM analysis for spectral and quantified data is shown in the supplemental figures. Unsupervised analysis of metabolic data leads to the same sample groups as did analysis of spectral data.
FIGURE 5.
HCL clustering of quantitative metabolite data obtained using Levenberg-Marquardt multivariate linear regression method with spectral measurements for 41 metabolites from metabolomics databases with metabolite values normalized (divided by standard deviation and mean-centered). Sample types are grouped similarly, based on these quantitative metabolic data, as they were with spectral data in Figs. 3 and 4.
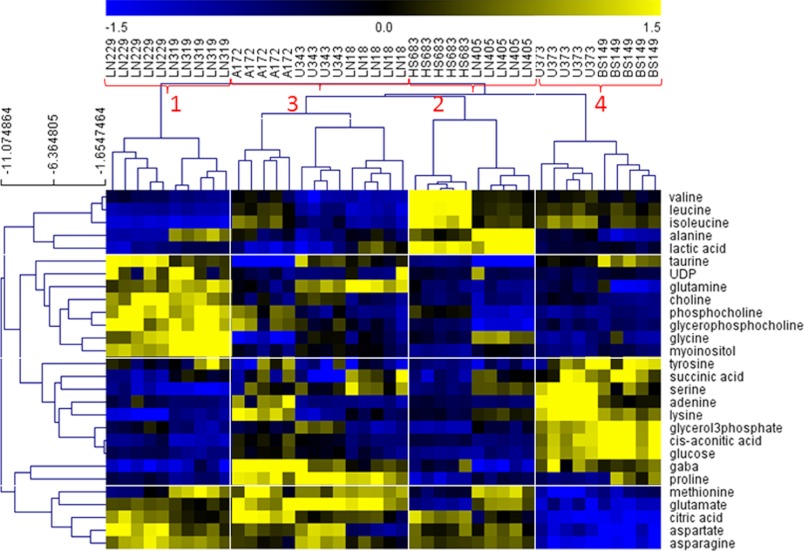
The sample clustering obtained from quantified metabolite data was exactly the same as obtained with qualitative, spectral data. This shows that significant variances for sample groupings are preserved in the metabolite quantification procedure. Although there are some clear metabolic differences between the four groups visible from analysis of all metabolites (Fig. 5), we have performed an additional step of feature selection to determine metabolites with the most significant concentration changes. A selection of the metabolites with the most significantly different concentrations among these four groups of samples was performed using the SAM method included in the TMeV gene expression analysis software package. Although both SAM and TMeV were originally developed for the analysis of gene expression data, these tools are universal data analysis methods that can be used for both qualitative, i.e. spectral, or quantitative, i.e. peak, metabolomics data. Selected metabolites are shown in Fig. 6. Table 2 presents the lists of overconcentrated metabolites for each group of samples.
FIGURE 6.
HCL clustering of metabolites selected as most differentially concentrated between the four groups. The feature selection was performed from quantitative metabolite data using SAM analysis. Prior to SAM analysis, metabolite values were normalized (divided by standard deviation and mean-centered). SAM Δ value was 0.2 with zero median number of false significant metabolites. Outlined are sample and metabolite groups, which show the metabolites that are most significant for separation of samples for each group from all the other groups.
TABLE 2.
Most significantly overconcentrated metabolites for each group of GBMs when compared with the other three groups
| Group of samples | Metabolites | |
|---|---|---|
| 1 (LN229, LN319) | Taurine | Glutamine |
| UDP | Glutamate | |
| Choline | Citric acid | |
| Phosphocholine | Aspartate | |
| Glycerophosphocholine | Asparagine | |
| Glycine | Methionine | |
| myo-Inositol | ||
| 2 (HS683, LN405) | Valine | Glutamate |
| Leucine | Citric acid | |
| Isoleucine | Aspartate | |
| Alanine | Asparagine | |
| Lactic acid | Methionine | |
| 3 (A172, U343, LN18) | GABA | Methionine |
| Proline | Citric acid | |
| Glutamine | Aspartate | |
| Glutamate | Asparagine | |
| 4 (U373, BS149) | Succinic acid | Glycerol 3-phosphate |
| Serine | Glucose | |
| Adenine | cis-Aconitic acid | |
| Taurine | GABA | |
| Lysine | Proline | |
| Tyrosine | ||
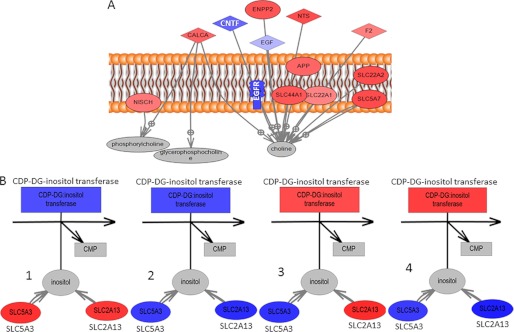
Our list of significant metabolites (Table 2) includes some of the metabolites that are known to be significantly different in cancers relative to normal cells such as cholines, creatinines, and lactic acid. It is interesting to notice, however, that there are significant differences even in these major metabolites as well as many other metabolites between the four GBM subtypes. Group 1 samples have significantly higher concentrations of choline and its derivatives than all the other sample groups. This is highly significant as choline is already widely used as marker for in vivo brain tumor diagnosis and, although it is present in all tumors, it might make a more sensitive marker for Group 1 tumors. Interestingly, GBM cell lines included in this group, LN229 and LN319, also cluster based upon their molecular footprints as they strongly express PDGFRA at the transcript levels (PDGFRA+), but have low levels of EGFR transcript (EGFR−), as shown in Fig. 7. Choline is part of several pathways, most importantly metabolism of glycerophospholipids and other lipids. The analysis of the glycerophospholipid pathway shows overexpression of several important enzymes related to choline processing as well as genes involved in choline import into cells. Fig. 8A shows molecular transport genes that are, according to a literature search provided by the Pathway Studio software, related to choline and its derivatives. Clearly, several genes previously associated with the transport of choline are overexpressed in Group 1 cells. SCL44A (intermediate-affinity choline transporter-like protein), in particular, has been indicated as a major choline transporter in breast cancers with a connection to the Hsp90 chaperone protein (25). At the same time, EGFR, which is underexpressed in Group 1 cancers based on microarray as well as RT-PCR data (Fig. 7), has been associated with reduction of monolayer permeability to choline (9). A relationship between SCL44A and EGFR and choline metabolic profile has also been shown recently in metabolomics analysis of breast cancer cell lines (10). Furthermore, it should be kept in mind that EGFR mutation was identified as one of the major genetic differences between genomically determined GBM subtypes (8).
FIGURE 7.
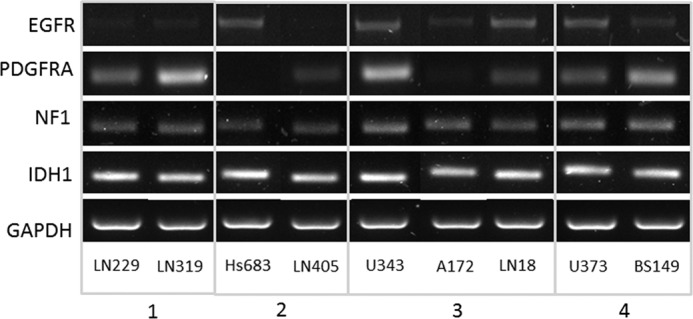
Molecular footprints of the nine GBM cell lines assessed in the current study. Selected transcripts of interest, EGFR, PDGFRA, NF1, and IDH1, were amplified in the GBM cell models by RT-PCR.
FIGURE 8.
Direct connection network between gene expression and metabolites that are overconcentrated in group 1. A, genes directly involved in the transport of choline (particularly SCL44A1) are overexpressed in group 1 cells. In the figure, genes that are overexpressed in Group 1 relative to the other groups are shown in red, and the ones that are underexpressed in group 1 are shown in blue. B, relation between inositol and its transporter genes (SLC5A3 and SLC2A13) as well as enzyme involved in its digestion (inositol transferase). In subplots B1–B4, coloring is used to describe gene expression difference across four cell line types. Subplot B1 shows expression of genes in group 1 relative to groups 2, 3 and 4; subplot B2 shows expression of genes in group 2 relative to groups 1, 3, and 4; subplot B3 shows expression of genes in group 3 relative to groups 1, 2, and 4; and subplot B4 shows expression of genes in group 4 relative to groups 1, 2, and 3. Inositol is overconcentrated in group 1, and this can be related to the overexpression of its transporters as well as underexpression of the digestion enzyme. CALCA, calcitonin-related polypeptide alpha; CNTF, ciliary neurotrophic factor; NISCH, nischarin; NTS, neurotensin; APP, amyloid beta (A4) precursor protein; CDP-DG, cytidine diphosphate-diacylglycerol.
Group 1 also shows significant overconcentration of inositol. Inositol has been suggested as an age-independent marker in prostate cancers (26). In mammalian tissues and cells, inositol exists primarily in its free form or bound covalently to phospholipid as phosphatidylinositol. myo-Inositol is elevated in gliomas relative to normal brain tissue and is involved in osmoregulation and volume regulation (6). Inositol incorporation into phosphatidylinositol is part of glycerophospholipid metabolism and is catalyzed by inositol transferase (17). At the same time, inositol is transferred to the cytoplasm by several transporters such as sodium/myo-inositol cotransporter (SLC5A3) and solute carrier family 2 (SLC2A13). Differences in inositol levels between the four GBM subgroups can result from different levels of metabolite incorporation into larger molecules (making it more challenging to detect via NMR) or from differences in transport. Genes involved in transport (SLC5A3 and SLC2A13) and metabolism (inositol transferase) of inositol are shown in Fig. 8B with color corresponding to relative gene expression in group 1 relative to groups 2, 3, and 4 (subplot B1); group 2 relative to groups 1, 3, and 4 (subplot B2); group 3 relative to groups 1, 2, and 4 (subplot B2), and group 4 relative to groups 1, 2, and 3 (subplot B4). According to gene expression data shown in Fig. 8, subplot B1, overconcentration of inositol in group 1 is due to increased metabolite transport and decreased incorporation into larger NMR “invisible” molecules. In the other three groups, inositol is underconcentrated, and this is due to: decreased transport (group 2); rapid incorporation into a large molecule (group 3); or faster incorporation into a larger molecule as well as reduced transport (group 4).
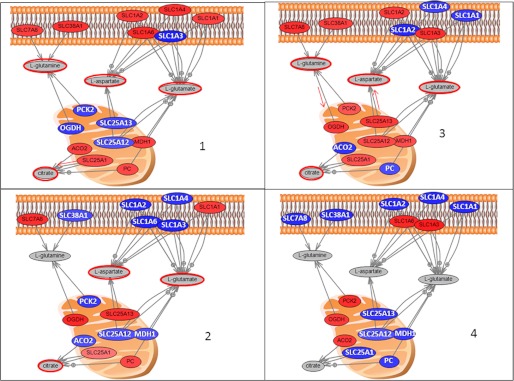
Glutamine and glutamate are overconcentrated in several groups with glutamine overconcentrated in groups 1 and 3 and glutamate overconcentrated in groups 1, 2, and 3. Increased glutamine concentration in cancers has been reviewed by Dang (27). It was proposed that glutamine is transported into the cell through glutamine/amino acid transporter and converted to glutamate by glutaminase. Glutamate is catabolized to α-ketoglutarate for further oxidation in the tricarboxylic acid cycle. In Fig. 9, we show the genes connected in the literature with aspartate, glutamine, glutamate, and citrate as these metabolites show similar behavior across the groups of samples and are metabolically connected. Fig. 9 shows some of the major transporters for these metabolites across cellular and mitochondrial membranes. In group 1, aspartate, glutamine, glutamate, and citrate are overconcentrated. Expression levels of transporter genes in group 1 relative to all the other samples suggest that overconcentration of these metabolites results from the enhanced input of glutamine into the cell (by SLC38A1 and SLC7A8) as well as glutamate and aspartate (by SLC1A type transporters) and enhanced transport of citrate out of the mitochondria, which could lead to enhanced production of citrate due to the kinetics of reversible reactions in the TCA cycle. In group 2, the concentration of glutamine is reduced and, according to gene expression investigation, this can be ascribed to reduced transport as well as increased input into mitochondria (with OGDH gene overexpressed). This group also shows reduced levels of aspartate and glutamate transporters. However, their mitochondrial production is enhanced by higher expression of OGDH and SLC25A13. In group 3, all four metabolites are once again overconcentrated, and both major glutamine transporters are clearly overexpressed, but so are mitochondrial transporters, thus leading to higher throughput and higher concentrations of glutamate and aspartate. In group 4, all four metabolites are underconcentrated, and this can be connected to the fact that both major transporters for glutamine are underexpressed. Finally, as shown in Fig. 7, group 4 cell lines, U373 and BS149, also have the common characteristic of strongly expressing PDGFRA and EGFR at the transcript levels (PDGFRA+ and EGFR+), further supporting this cluster.
FIGURE 9.
Direct connection network between gene expression and metabolites that are overconcentrated in some of the groups. Included are l-glutamine (overconcentrated in groups 1 and 3), l-glutamate (overconcentrated in groups 1, 2, and 3), l-aspartate (overconcentrated in groups 1, 2, and 3), and citrate (overconcentrated in groups 1, 2, and 3) with metabolite overconcentration highlighted in red. Genes are colored based on their expression in one group relative to all the others, i.e. panel 1 is expression in 1 relative to 2, 3, and 4; panel 2 is expression in 2 relative to 1, 3, and 4; panel 3 is expression in 3 relative to 1, 2, and 4, and panel 4 is expression in 4 relative to 1, 2, and 3. According to the changes in metabolite concentration and gene expression, we are hypothesizing major transporters for each metabolite listed, and this is outlined with red arrows on the graph. PC, phosphorylcholine.
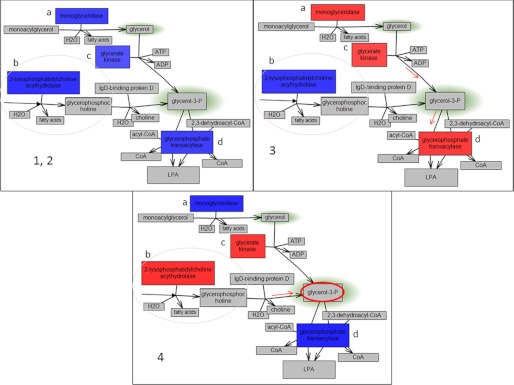
A final example of the connection between metabolic results and gene expression measurements is the analysis of glycerol 3-phosphate (G3P) metabolism and related genes. G3P is an intermediate in triacylglycerol and glycerophospholipid metabolism, both of which are known to be altered in cancers. In our comparison of GBMs, G3P is overconcentrated in Group 4 cell lines. Fig. 10 shows part of the triacylglycerol and glycerophospholipid metabolic pathways where G3P is synthesized and degraded. Once again, there are changes in relative gene expression levels in the four groups of samples. In groups 1 and 2, all enzymes in these branches of pathways are underexpressed, leading to lower G3P levels. In group 3, triacylglycerol pathway production of G3P is reduced (gene underexpression). However, glycerophospholipid metabolism is enhanced in G3P production as well as digestion, thus leading to reduction of G3P concentration as well as glycerol. Finally, in group 4, triacylglycerol and glycerophospholipid pathway production of G3P are enhanced. However, G3P digestion is reduced (by underexpression of glycerophosphate transacylase), and therefore, its concentration is increased.
FIGURE 10.
Partial representation of triacylglycerol and glycerophospholipid metabolism related to synthesis and digestion of glycerol 3-phosphate. Glycerol 3-phosphate is overconcentrated in group 4 (highlighted in red). The gene colors represent relative expression levels in: panel 1, 2, group 1 relative to groups 2, 3, and 4 and group 2 relative to groups 1, 3, and 4 (same relative expression); panel 3, group 3 relative to groups 1, 2, and 4; and panel 4, group 4 relative to groups 1, 2, and 3, where red shows overexpression and blue shows underexpression. The branch of the triacylglycerol pathway is circled. The presented genes are: a, monoglyceridase; b, 2-lysophosphatidylcholine acylhydrolase; c, glycerate kinase; d, glycerophosphate transacylase. Glycerol 3-phosphate is overconcentrated in group 4 cells, and this can be related to up-regulation of 2-lysophosphatidylcholine acylhydrolase and glycerate kinase, both involved in glycerol 3-phosphate synthesis, and down-regulation of glycerophosphate transacylase, which is involved in its digestion. LPA, lysophosphatidic acid.
Several genes known to affect cell metabolism show significantly different expression levels between the four groups of nine cell lines. Gene set enrichment analysis (28, 29) of genes that are significantly overexpressed in each group relative to the other groups pointed out several metabolic processes that could be significantly affected by overexpressed genes. For example, genes overexpressed in group 1 include fatty acid synthase as well as several other genes from the fatty acid biosynthesis pathway. Group 2 overexpressed genes are significantly prevalent members of the amino acid metabolism pathway (Ser/Gly/Thr/Cys metabolism), and indeed, the majority of overconcentrated metabolites identified in this group are branched chain amino acids. Furthermore, there are clear expression level differences in PDGFRA, IDH1, EGFR, and NF1 (8) in our four metabolic groups of samples (Fig. 7). Out of these four genes, two are directly related to metabolite concentrations (EGFR and IDH1), and all four have been shown to affect several major genes involved in control of metabolism (such as HIF1A, mTOR, HRAS, and GLRX1).
CONCLUSION
We have performed unsupervised and supervised analysis of 1H NMR measurements of nine GBM cell lines. Analysis was performed directly on spectral data and also on quantified metabolic data determined from the spectra. The presented analysis clearly shows that GBM cell lines have different metabolic profiles and that it is possible to determine groups of cell types based on NMR metabolomics. Spectral analysis established four groups of cancer types. For metabolically determined GBM subtypes, we have resolved the major metabolic differences. Metabolic markers for each group of samples were correlated with publicly available gene expression data for these cell lines. Metabolic analysis generally agrees with gene expression measurements, and it was possible to explain metabolomics results based on gene expression data. It is clear from this work that to make conclusions from gene expression analysis, it is necessary to look at networks and pathways rather than individual genes. Metabolomics thus provides an excellent way to focus on gene expression analysis and to highlight major changes in pathways that are regulating key cellular processes. Our results agree with recent studies in GBMs showing that different subtypes exist for these tumors and that they likely respond differently to treatments. This is in agreement with recent publications that have shown that glioblastomas have distinct subtypes based on both gene expression and genomics (8), and we have shown correlation between our metabolic subtypes and major genes obtained as markers for genomic subtypes. Metabolites identified can be used as noninvasive markers of these subtypes. Future work will focus on the analysis of tumor tissue samples and will investigate whether these GBM subtypes can be established there as well.
Acknowledgments
We thank M. Monette (Bruker Canada) for help in setting up NMR experiments. We acknowledge the contribution of the Canadian Foundation for Innovation (CFI), the New Brunswick Innovation Foundation (NBIF), and Université de Moncton for the acquisition of the NMR instrument. We also acknowledge the support of the CFI for the funding of a portion of operating costs and maintenance for the NMR instrument through the Infrastructure Operating Fund (IOF).

This article contains supplemental Table 1 and Figs. 1–3.
J. Hines and M. Cuperlovic-Culf, submitted.
- GBM
- glioblastoma multiforme
- PDGFR
- platelet-derived growth factor receptor
- EGFR
- epidermal growth factor receptor
- IDH
- isocitrate dehydrogenase
- TOCSY
- total correlation spectroscopy
- SAM
- significance analysis for microarrays
- PCA
- principal component analysis
- HCL
- hierarchical clustering
- FKM
- fuzzy K-means methods
- G3P
- glycerol 3-phosphate.
REFERENCES
- 1. Cairns R. A., Harris I. S., Mak T. W. (2011) Regulation of cancer cell metabolism. Nat. Rev. Cancer 11, 85–95 [DOI] [PubMed] [Google Scholar]
- 2. Kroemer G., Pouyssegur J. (2008) Tumor cell metabolism: cancer's Achilles' heel. Cancer Cell 13, 472–482 [DOI] [PubMed] [Google Scholar]
- 3. Brahimi-Horn M. C., Chiche J., Pouysségur J. (2007) Hypoxia signaling controls metabolic demand. Curr. Opin. Cell Biol. 19, 223–239 [DOI] [PubMed] [Google Scholar]
- 4. Warburg O., Posener K., Negelein E. (1924) About the metabolism of tumors. Biochem. Z. 152, 319–344 [Google Scholar]
- 5. Zaner K. S., Damadian R. (1977) NMR in cancer: VIII. Phosphorus-31 as a nuclear probe for malignant tumors. Physiol. Chem. Phys. 9, 473–483 [PubMed] [Google Scholar]
- 6. Griffin J. L., Kauppinen R. (2007) A metabolomics perspective of human brain tumors. FEBS J. 274, 1132–1139 [DOI] [PubMed] [Google Scholar]
- 7. Florian C. L., Preece N. E., Bhakoo K. K., Williams S. R, Noble M. (1995) Characteristic metabolic profiles revealed by 1H NMR spectroscopy for three types of human brain and nervous system tumors. NMR Biomed. 8, 253–264 [DOI] [PubMed] [Google Scholar]
- 8. Verhaak R. G., Hoadley K. A., Purdom E., Wang V., Qi Y., Wilkerson M. D., Miller C. R., Ding L., Golub T., Mesirov J. P., Alexe G., Lawrence M., O'Kelly M., Tamayo P., Weir B. A., Gabriel S., Winckler W., Gupta S., Jakkula L., Feiler H. S., Hodgson J. G., James C. D., Sarkaria J. N., Brennan C., Kahn A., Spellman P. T., Wilson R. K., Speed T. P., Gray J. W., Meyerson M., Getz G., Perou C. M., Hayes D. N., Cancer Genome Atlas Research Network(2010) Integrated genomic analysis identifies clinically relevant subtypes of glioblastoma characterized by abnormalities in PDGFRA, IDH1, EGFR, and NF1. Cancer Cell 17, 98–110 [DOI] [PMC free article] [PubMed] [Google Scholar]
- 9. Peter Y., Comellas A., Levantini E., Ingenito E. P., Shapiro S. D. (2009) Epidermal growth factor receptor and claudin-2 participate in A549 permeability and remodeling: implications for non-small cell lung cancer tumor colonization. Mol. Carcinog. 48, 488–497 [DOI] [PMC free article] [PubMed] [Google Scholar]
- 10. Cuperlovic-Culf M., Chute I. C., Culf A. S., Touaibia M., Ghosh A., Griffiths S., Tulpan D., Léger S., Belkaid A., Surette M. E., Ouellette R. J. (2011) 1H NMR metabolomics combined with gene expression analysis for the determination of major metabolic difference between subtypes of breast cell lines Chem. Sci. 2, 2263–2270 [Google Scholar]
- 11. Ohgaki H., Dessen P., Jourde B., Horstmann S., Nishikawa T., Di Patre P. L., Burkhard C., Schüler D., Probst-Hensch N. M., Maiorka P. C., Baeza N., Pisani P., Yonekawa Y., Yasargil M. G., Lütolf U. M., Kleihues P. (2004) Genetic pathways to glioblastoma: a population-based study. Cancer Res. 64, 6892–6899 [DOI] [PubMed] [Google Scholar]
- 12. Chakravarti A., Dicker A., Mehta M. (2004) The contribution of epidermal growth factor receptor (EGFR) signaling pathway to radioresistance in human gliomas: a review of preclinical and correlative clinical data. Int. J. Radiat. Oncol. Biol. Phys. 58, 927–931 [DOI] [PubMed] [Google Scholar]
- 13. Brennan C., Momota H., Hambardzumyan D., Ozawa T., Tandon A., Pedraza A., Holland E. (2009) Glioblastoma subclasses can be defined by activity among signal transduction pathways and associated genomic alterations. PLoS ONE 4, e7752. [DOI] [PMC free article] [PubMed] [Google Scholar]
- 14. Howells S. L., Maxwell R. J., Griffiths J. R. (1992) Classification of tumor 1H NMR spectra by pattern recognition. NMR Biomed. 5, 59–64 [DOI] [PubMed] [Google Scholar]
- 15. Florian C. L., Preece N. E., Bhakoo K. K., Williams S. R., Noble M. D. (1995) Cell type-specific fingerprinting of meningioma and meningeal cells by proton nuclear magnetic resonance spectroscopy. Cancer Res. 55,420–427 [PubMed] [Google Scholar]
- 16. Grzmil M., Morin P., Jr., Lino M. M., Merlo A., Frank S., Wang Y., Moncayo G., Hemmings B. A. (2011) MAP kinase-interacting kinase 1 regulates SMAD2-dependent TGF-β signaling pathway in human glioblastoma. Cancer Res. 71, 2392–2402 [DOI] [PubMed] [Google Scholar]
- 17. Kuksis A. (ed) (2003) Inositol Phospholipid Metabolism and Phosphatidyl Inositol Kinases, pp. 335–402, Elsevier, Elsevier Science Publishing Co., Inc., Amsterdam, New York [Google Scholar]
- 18. Cuperlović-Culf M., Belacel N., Culf A. S., Chute I. C., Ouellette R. J., Burton I. W., Karakach T. K., Walter J. (2009) NMR metabolic analysis of samples using fuzzy K-means clustering. Magn. Res. Chem. 47, Suppl. 1, S96–S104 [DOI] [PubMed] [Google Scholar]
- 19. Tusher V. G., Tibshirani R., Chu G. (2001) Significance analysis of microarrays applied to the ionizing radiation response. Proc. Natl. Acad. Sci. U.S.A. 98, 5116–5121 [DOI] [PMC free article] [PubMed] [Google Scholar]
- 20. Wishart D. S., Knox C., Guo A. C., Eisner R., Young N., Gautam B., Hau D. D., Psychogios N., Dong E., Bouatra S., Mandal R., Sinelnikov I., Xia J., Jia L., Cruz J. A., Lim E., Sobsey C. A., Shrivastava S., Huang P., Liu P., Fang L., Peng J., Fradette R., Cheng D., Tzur D., Clements M., Lewis A., De Souza A., Zuniga A., Dawe M., Xiong Y., Clive D., Greiner R., Nazyrova A., Shaykhutdinov R., Li L., Vogel H. J., Forsythe I. (2009) HMDB: a knowledgebase for the human metabolome. Nucleic Acids Res. 37, D603–D610 [DOI] [PMC free article] [PubMed] [Google Scholar]
- 21. Markley J. L., Anderson M. E., Cui Q., Eghbalnia H. R., Lewis I. A., Hegeman A. D., Li J., Schulte C. F., Sussman M. R., Westler W. M., Ulrich E. L., Zolnai Z. (2007) New bioinformatics resources for metabolomics. Pac. Symp. Biocomput. 168, 157–168 [PubMed] [Google Scholar]
- 22. Tulpan D., Léger S., Belliveau L., Culf A., Cuperlović-Culf M. (2011) MetaboHunter: an automatic approach for identification of metabolites from 1H NMR spectra of complex mixtures. BMC Bioinformatics 12, 400. [DOI] [PMC free article] [PubMed] [Google Scholar]
- 23. Govindaraju V., Young K., Maudsley A. A. (2000) Proton NMR chemical shifts and coupling constants for brain metabolites. NMR Biomed. 13, 129–153 [DOI] [PubMed] [Google Scholar]
- 24. Belacel N., Cuperlović-Culf M., Laflamme M., Ouellette R. (2004) Fuzzy J-Means and VNS methods for clustering genes from microarray data. Bioinformatics 20, 1690–1701 [DOI] [PubMed] [Google Scholar]
- 25. Brandes A. H., Ward C. S., Ronen S. M. (2010) 17-Allyamino-17-demethoxygeldanamycin treatment results in a magnetic resonance spectroscopy-detectable elevation in choline-containing metabolites associated with increased expression of choline transporter SLC44A1 and phospholipase A2. Breast Cancer Res. 12, R84. [DOI] [PMC free article] [PubMed] [Google Scholar]
- 26. Serkova N. J., Gamito E. J., Jones R. H., O'Donnell C., Brown J. L., Green S., Sullivan H., Hedlund T., Crawford E. D. (2008) The metabolites citrate, myo-inositol, and spermine are potential age-independent markers of prostate cancer in human expressed prostatic secretions. Prostate 68, 620–628 [DOI] [PubMed] [Google Scholar]
- 27. Dang C. V. (2010) Rethinking the Warburg effect with Myc micromanaging glutamine metabolism. Cancer Res. 70, 859–862 [DOI] [PMC free article] [PubMed] [Google Scholar]
- 28. Subramanian A., Tamayo P., Mootha V. K., Mukherjee S., Ebert B. L., Gillette M. A., Paulovich A., Pomeroy S. L., Golub T. R., Lander E. S., Mesirov J. P. (2005) Gene set enrichment analysis: a knowledge-based approach for interpreting genome-wide expression profiles. Proc. Natl. Acad. Sci. 102, 15545–15550 [DOI] [PMC free article] [PubMed] [Google Scholar]
- 29. Mootha V. K., Lindgren C. M., Eriksson K. F., Subramanian A., Sihag S., Lehar J., Puigserver P., Carlsson E., Ridderstråle M., Laurila E., Houstis N., Daly M. J., Patterson N., Mesirov J. P., Golub T. R., Tamayo P., Spiegelman B., Lander E. S., Hirschhorn J. N., Altshuler D., Groop L. C. (2003) PGC-1α-responsive genes involved in oxidative phosphorylation are coordinately down-regulated in human diabetes. Nat. Genet. 34, 267–273 [DOI] [PubMed] [Google Scholar]


