Abstract
Fast-scan cyclic voltammetry (FSCV) is a common analytical electrochemistry tool used to measure chemical species. It has recently been adapted for measurement of neurotransmitters such as dopamine in awake and behaving animals (in vivo). Electrode calibration is an essential step in FSCV to relate observed current to concentration of a chemical species. However, existing methods require multiple components, which reduce the ease of calibrations. To this end, a microfluidic flow cell (µFC) was developed as a simple device to switch between buffer and buffer with a known concentration of the analyte of interest – in this case dopamine - in a microfluidic Y-channel. The ability to quickly switch solutions yielded electrode calibrations with faster rise times and that were more stable at peak current values. The µFC reduced the number of external electrical components and produced linear calibrations over a range of concentrations. To demonstrate this, an electrode calibrated with the µFC was used in FSCV recordings from a rat during the delivery of food reward – a stimulus that reliably evokes a brief increase in current due to the oxidation of dopamine. Using the linear calibration, dopamine concentrations were determined from the current responses evoked during the behavioral task. The µFC is able to easily and quickly calibrate FSCV electrode responses to chemical species for both in vitro and in vivo experiments.
Keywords: electrode, calibration, dopamine, fast-scan cyclic voltammetry, y-channel
1. Introduction
Fast-scan cyclic voltammetry (FSCV) is a common analytical electrochemistry tool that has more recently been applied to investigate the role of neurotransmitters in awake and behaving subjects.1–3 Its ability to detect chemical changes with high temporal and spatial resolution accounts for its prevalence in measuring neurotransmitters such as dopamine in awake and behaving animals (in vivo).4,5 In FSCV, a voltage ramp is rapidly applied to a carbon fiber electrode causing chemical species at the electrode surface to oxidize and reduce – which is measured as current. Electroactive species are identified by their current by voltage plots; for the neurotransmitter dopamine, the current at the potential that evokes peak oxidative current is directly proportional to concentration.1 Electrodes are used acutely and must be calibrated after use to relate concentration to observed current.
Commonly, a flow injection apparatus is used to calibrate electrodes.6,7 The system consists of a syringe pump and a rotary valve loop injector preloaded with dopamine, and an electrode tip is inserted into the end of the loop injector. A buffer solution (commonly phosphate buffer or artificial cerebral spinal fluid) is continuously pumped through the flow system, and a computer triggers the release of dopamine into the buffer. Thus, the flow injection apparatus briefly exposes the electrode to a known concentration of dopamine before returning to buffer alone. The macro flow cell (mFC), another calibration device, is an adaptation of the flow injection system.8 Instead of the electrode being inserted in the injector, it is stationary in a flow cell and buffer and dopamine are sequentially passed over the electrode. Buffer is continuously pumped into the system, and an injection apparatus is preloaded with dopamine and injected into the flow cell. In addition, other calibration setups exist that are similar in design and incorporate similar equipment with subtle variations implemented by different laboratories. In all systems the electrode is briefly exposed to dopamine for calibration, but they require multiple components. Electrode placement in the flow injection apparatus is tedious and requires a micromanipulator, and there is a risk of the electrode breaking during placement. The macro flow cell simplifies the electrode placement by using an in-house manipulator that easily docks the electrode into the flow cell. However, due to the large chamber volume, the macro flow cell slowly switches between solutions, creating a slow rise time in the calibration curve, which does not stabilize at a peak current value. Microchip-based flow injectors have been developed to address the issues with conventional flow injectors.9–12 These chips commonly utilize two separate streams of the buffer and sample of interest. Off-chip switching either using electrokinetic focusing or an injection valve can determine which stream is exposed the microelectrode. The on-chip measurements improve on the previous methods since there is minimal dilution of the sample of interest. These devices however require separate equipment to drive the switching between solutions.
The microfluidic flow cell (µFC) borrows from the mFC and builds upon previous microchip-based flow injectors. The µFC houses the electrode in a plastic manipulator that is docked into a polycarbonate Y-channel allowing the electrode access into the channel. The device contains inlet and outlet ports for buffer and buffer with a known concentration of dopamine, and a reference electrode (chlorinated silver wire) is included to perform FSCV. The ability to quickly change the fluidic interface between two solutions in a Y-channel is exploited as previously demonstrated for other microfluidic applications.13–15 The electrode is exposed to quick switching between dopamine and buffer solutions creating a step-like current response. The µFC simplifies the electrode calibration while improving the rise times and its stabilization at peak current values.
2. Material and Methods
2.1 µFC Fabrication and Calibration Setup
The µFC was designed in AutoCAD and machined from two acrylic blocks measuring 2.8mm l × 5.5mm w × 1.2mm h. The top half housed the molded Y-channel and manipulator insert to allow the electrode access to fluid in the channel. A silicone rubber O-ring was placed in the insert to prevent the leaking of solution into the manipulator. Inlets and an outlet were drilled for fluid flow, and a reference electrode, composed of chlorinated silver wire (Ag/AgCl), was inserted into a hole drilled perpendicular to the outlet and sealed with epoxy. The two parts were assembled together with screws to seal the channel. Connectors (#13160; World Precision Instruments) were inserted into the inlets and outlet and connected to Tygon tubing (R-3603, ID 1/16", OD 1/8"; Cole-Parmer). The design of this channel can be easily fabricated by any machine shop with basic CNC milling machine capabilities.
Gravity perfusion was used to drive fluid through the device. Two open 60 ml syringes (BD Syringe) were hung 0.45m above the device, and flow was controlled with intravenous (IV) dial flow regulators (Wolf Medical Supply) and 1 way stopcocks (Cole-Parmer). For all experiments artificial cerebral spinal fluid (aCSF) was used as buffer and contained (in mM): 125 NaCl, 4 KCL, 1.3 CaCl2, 1 MgCl2, 0.66 NaH2PO4, 2 Na2HPO4, 1 glucose; termed buffer solution). For calibrations, dopamine hydrochloride (Sigma Aldrich) was diluted in the buffer solution (termed dopamine solution). Buffer and dopamine solutions were filled into separate syringes. A manipulator introduced the carbon-fiber electrode into the channel. Flow rate determined which input was exposed to the electrode by shifting the fluidic interface between the input streams in the channel. The buffer solution was continuously delivered at a rate of 1 ml/min, and when on, the dopamine solution was delivered at a rate of 1.5 ml/min which caused the fluidic interface to shift and exposed the electrode to the dopamine solution. All bubbles were removed before calibrations to prevent interference with the signal measured.
2.2 Voltammetric Recordings
Procedures for FSCV recordings are identical to those previously described.8,17 Briefly, electrodes were made by aspirating a carbon fiber into a glass pipette, which was pulled in a vertical micropipette puller. These electrodes, which had a length of carbon fiber protruding from the glass seal, were examined under light microscopy and the fiber was cut to 75–100 µm using a scalpel. Electrodes were then loaded into custom made manipulators (UIC Research Resources Center). Using these manipulators, which are designed to interface with the guide cannula implanted in the brain of experimental rat subjects, electrodes were lowered into the channel of the µFC. Electrodes were held at −0.4 V against Ag/AgCl between voltammetric scans and then driven to +1.3 V and back at 400 V/s. This triangle waveform causes oxidation and reduction of chemical species at the electrode resulting in a large background current. Background current is digitally subtracted so that changes in current produced by the oxidation/reduction of transient signals (e.g. neurotransmitter) can be identified. Dopamine is electroactive within this potential range and is identified by plotting current against the applied potential used to produce a background-subtracted voltammogram color plot.
2.3 Subjects
Adult male Sprague-Dawley rats (Charles River; ~350 g) were housed in plastic cages (26.5 × 50 × 20 cm) in a temperature (22°C) and humidity (30%) controlled environment on a 12/12 h light/dark cycle (lights on at 7:00 am). Rats were food restricted to ~95% of their ad libitum body weight with free access to water during training and testing but not during recovery from surgery. Animal care and use was in accordance with the National Institutes for Health Guide for the Care and Use of Laboratory Animals and approved by the Institutional Animal Care and Use Committee at the University of Illinois at Chicago.
2.4 Surgery
Surgical procedures were identical to previously described.8,17 Briefly, rats were anesthetized with ketamine hydrochloride (100 mg/kg) and xylazine hydrochloride (10 mg/kg) and mounted in a stereotaxic frame (David Kopf Instruments). A guide cannula directed at the nucleus accumbens core (mm from Bregma: +1.3 anterior, −1.5 lateral), a chlorinated silver wire reference electrode in the contralateral cortex, and a bipolar stimulating electrode in the ventral midbrain (mm from Bregma: −5.2 anterior, −1.0 lateral), were implanted and affixed to the skull using dental cement. Rats were allowed at least a week of recovery before FSCV recordings took place.
3. Results and Discussion
3.1 Minimized components for electrode calibration
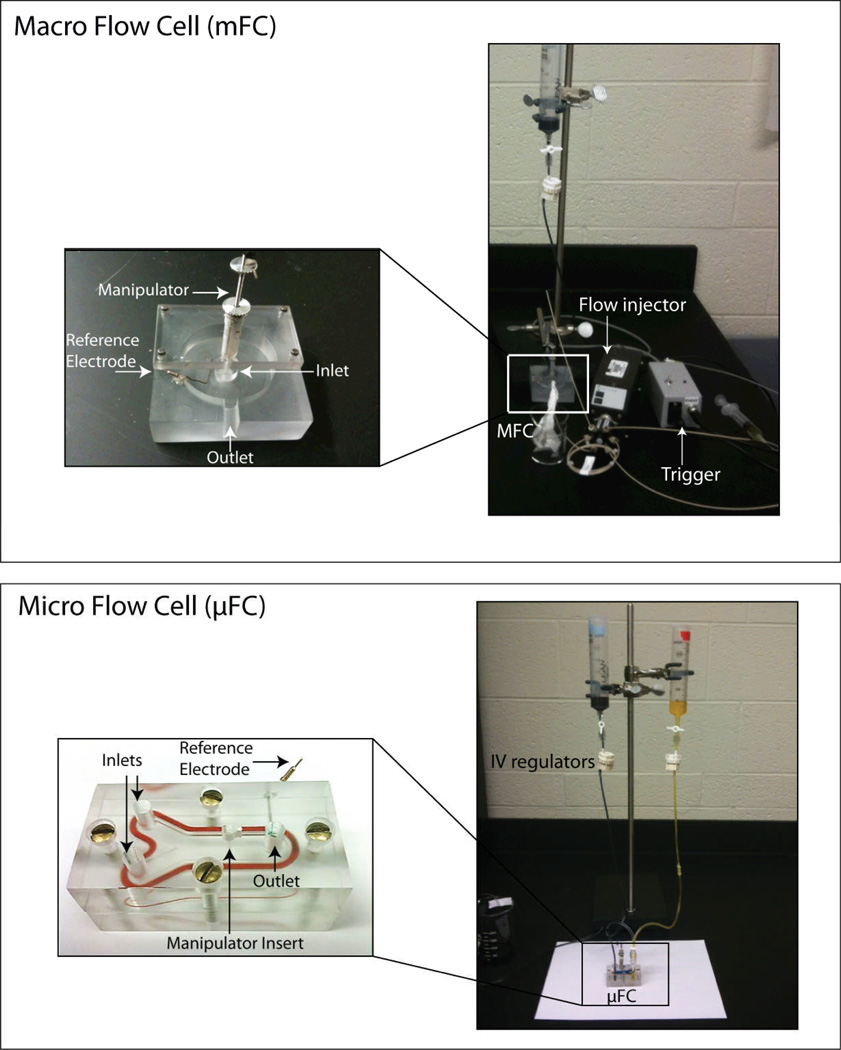
The mFC required multiple instruments for operation. Two images of the mFC and µFC calibration setup are displayed in Fig. 1. In the mFC, a gravity flow was used to continuously perfuse the buffer solution. A flow injection apparatus injected the dopamine solution into the bath where the carbon fiber electrode, housed in the manipulator, and the reference electrode, came into contact with the solution for measurements. A trigger and computer (not shown) controlled the duration the dopamine solution was introduced. Multiple calibrations were tedious since the flow injection apparatus could only preload 300 µl of dopamine solution at a time. Lastly, the additional components occupy a larger amount of bench space.
Figure 1.
The macro flow cell (mFC) requires multiple components for operation. The mFC is connected to a syringe pump which continuously perfuses buffer into a bath through the inlet. A flow injection apparatus injects buffer+dopamine into the bath where the carbon fiber electrode, housed in the manipulator, and the reference electrode come into contact with the solution for current measurements. A trigger and computer (not shown) controls the duration the buffer+dopamine is introduced into the solution. The microfluidic flow cell eliminates the need for external instruments. It consists of a Y-channel with an opening in the center of the channel to accommodate a carbon fiber-microelectrode housed in a manipulator. The electrode is lowered by the manipulator into contact with fluid flow. A gasket is placed in the insert to block fluid from entering the manipulator, and a reference electrode is placed in the side for contact with the outflow. The microelectrode and reference electrode are used in conjunction to measure the changes in current in the system.
The µFC addressed problems with the mFC by introducing the carbon fiber electrode directly in the center of a microfluidic Y-channel. As before, the electrode’s position in the channel was controlled by the manipulator it was housed in, and a reference electrode was added for current measurements. Gravity perfusion through two open syringes was used to drive the solution. Characteristics of a Y-channel were exploited to switch the electrode between the buffer and dopamine solutions. Altering the flow rate of each solution determined which input was exposed to the electrode. Additionally, the µFC removed the need for external electrical components.
3.2 Rapid switching between buffer and dopamine and reduced variability in current response
A step-like current response was achieved by rapidly switching the solution that the electrode was exposed to from buffer to dopamine. In Fig. 2, food dye was used to color each solution and shows the rapid change in fluidic interface in the device, which is achieved by altering the flow rates. Initially, the flow rate for the buffer solution (blue) was set to 1 ml/min to fill the channel. The dopamine solution (yellow) was introduced into the channel at a rate of 1.5 ml/min to displace the flow of the buffer solution and the electrode was briefly exposed to dopamine for ~5 seconds. Last, the flow of the dopamine solution was stopped and the buffer solution was returned to the electrode. Additionally, the µFC simplified multiple successive calibrations since a large reservoir of the dopamine solution was maintained allowing for many repetitions of switching between solutions, which cannot be achieved in the mFC.
Figure 2.
The µFC allows for rapid switching of fluids in the microfluidic channel. (A) Initially, only the blue fluid was flowing at 1 ml/min. (B) When on, the yellow stream filled a majority of the channel due to its faster flow rate of 1.5 ml/min. (C) The blue stream recovered when the yellow stream was off.
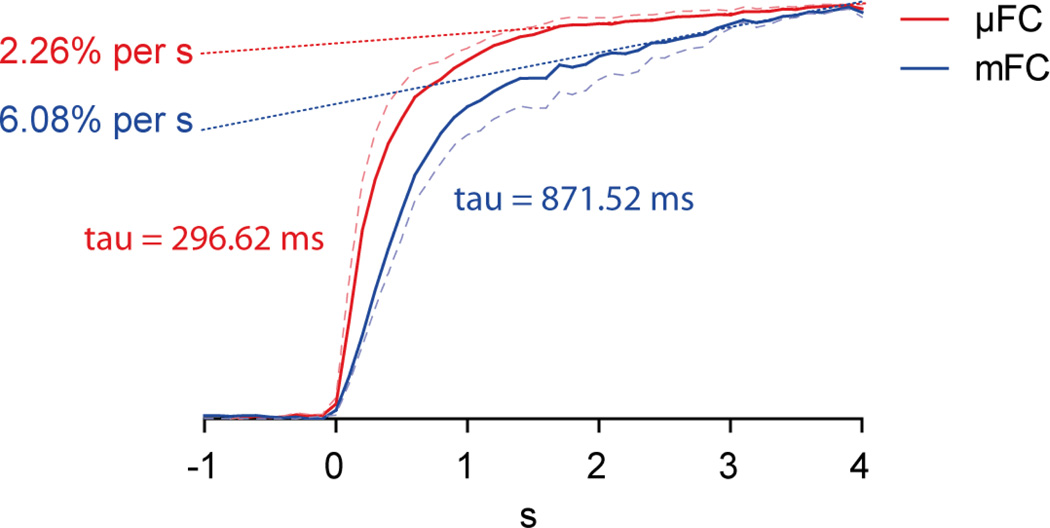
Relative to the mFC, the µFC produced current responses that exhibited faster rise times and plateaued quicker near the peak current value as displayed in Fig 3. Normalized current responses evoked by 1 µM dopamine solution were compared between the µFC and mFC. A first-order exponential was fitted to early phase of both responses and revealed that the rise time was ~3 times shorter in the µFC than the mFC (tau: 296.62 ms vs. 871.52 ms). In addition, when the late phase of the response was fitted with a linear function (dotted lines), the response in the µFC was ~2.5 times flatter than in the mFC, i.e. the slope was shallower (slope: 2.26% per s vs. 6.08% per second). The dashed lines show the upper range of the standard error for the µFC and the lower range for the mFC. The shallower slope as the µFC response reaches its maximum current value indicates that, relative to the mFC response, it is closer to stabilizing at the peak concentration; this provides more confidence when determining the corresponding current value to concentration.
Figure 3.
The current responses between the macro flow cell (mFC, blue) and µFC (red) were compared. The µFC exhibited a faster rise time and flatter peak. A standard first-order exponential was fitted to the early part of the response. Tau of the rise time, was less in the µFC (296.62 ms) than the mFC (871.52 ms). In addition, slope gradient of the late phase (dotted lines) for the µFC (2.26% per second) was less than for the mFC (6.08% per second). The dashed lines show the upper range of the standard error for the µFC and the lower range for the mFC.
A likely factor accounting for the stabilization of the current response in µFC is the constant level of dopamine solution at the electrode surface during applications. In addition, a large chamber volume in the mFC created turbulent movement in the bath. Although the electrode was in contact with the solution near the inlet, turbulent flow still dispersed the dopamine solution creating an inconsistent concentration at the electrode surface. The laminar flow in µFC allowed dopamine to near-instantaneously and continuously interact with electrode, stabilizing the peak current amplitude and producing faster rise time.
3.3 Calibration curves to determine dopamine concentrations in vivo
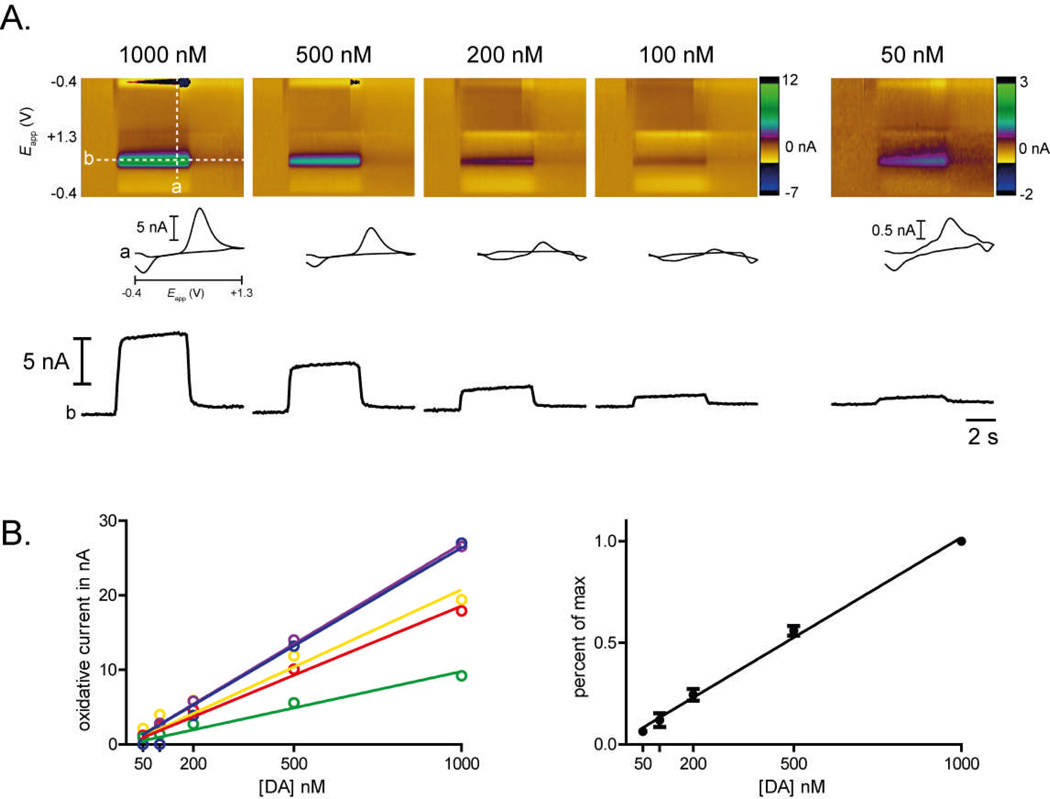
Electrode responses in the µFC to different concentrations of dopamine were measured. Fig. 4A shows the current (represented in color) plotted against the applied potential (Eapp) as a function of time for dopamine concentrations of 1000, 500, 200, 100, and 50 nM. Dopamine was detected at its peak oxidation potential of ~0.6 V (green feature). The current monitored at the peak oxidation potential for dopamine are displayed below each ‘color plot’. Both the color and current plots exhibit little noise and the current plot retains its step-like shape even at lower concentrations. Current responses were obtained from five electrodes in the µFC at concentrations of 1000, 500, 200, 100, and 50 nM. Due to differences in maximum amplitude of the electrodes, the calibration data was normalized. The electrodes exhibited linear slopes that were close to 1 (range: 0.918–1.083; mean: 0.985). The linear slopes confirm that the micro flow cell is capable of calibrating electrodes over a range of concentrations, which is important when accurately determining concentrations in vivo.
Figure 4.
Linear calibration curves. (A) We assessed electrode responses in the flow cell to a range of dopamine concentrations (1000, 500, 200, 100, and 50 nM). Shown here are color plots (top panels), cyclic voltammograms (insets) and current by time traces (bottom panels) for a single representative electrode across the range of dopamine concentrations. In the color plots, the x-axis is time (s), the y-axis is applied potential to the electrode (V) and current is coded by pseudocolor (nA, scale on right). The chemical signature of dopamine can be seen as a specific change in current at its oxidation (~0.60 V) and reduction (~−0.21 V) potentials. The dashed white lines in the left-hand color plot show the data from which the cyclic voltammograms (a) and the current by time traces (b) are derived. (B) Data were obtained for five electrodes, shown in different colors. Data are mean ± SEM for three trials at each concentration; errors are too small to be visible. (C) When normalized to account for differences in maximum amplitude, slopes for each electrode were close to 1 (range: 0.918–1.083; mean: 0.985) indicating excellent linearity. Data shown are mean ± SEM for the five electrodes shown in B.
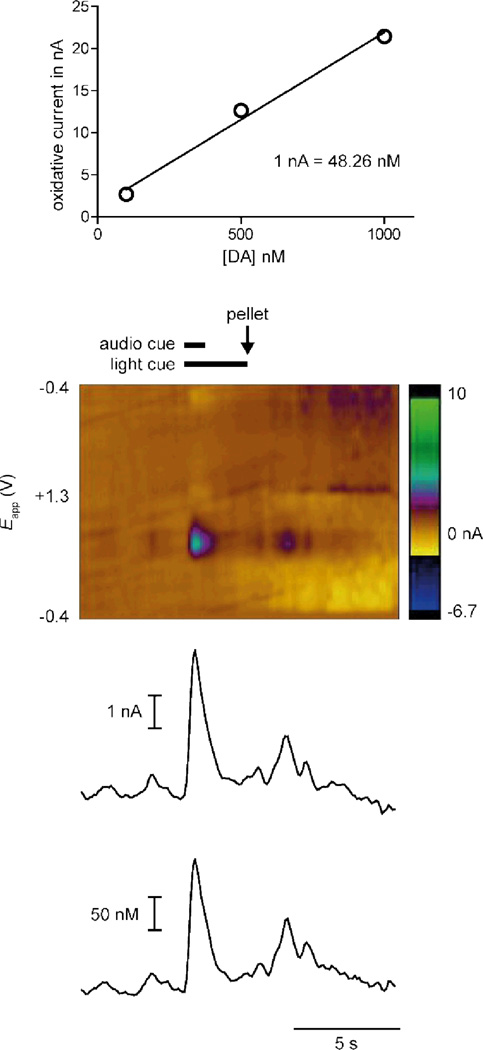
The µFC is able to provide accurate calibrations for electrodes used in FSCV studies in awake and behaving animals in vivo. The small size of the micro flow cell is an advantage since the calibrations can be conducted in the same cage as the in vivo measurements, which allows for better standardization of the environment between the experiment and the calibrations. Fig. 5a displays a concentration curve for an individual electrode. As before, the curve shows excellent linearity and determined that 1 nA corresponds to 48.26 nM dopamine. After calibration, the same electrode was placed in the nucleus accumbens core of a rat, a brain region that receives dense dopamine input and is engaged in behaviors that involve learning about food and other rewards. Current responses across all voltages of the electrode were measured using FSCV in response to sensory stimuli that the rat had been trained to associate with food delivery. Specifically, a compound (tone/light) stimulus preceded the delivery of a rewarding sugar pellet by 3 s. Single dopamine release events, identified by the specific potentials at which oxidative current was observed, were evoked by both the compound cue and the delivery of the sugar pellet and were evident in the color plot (Fig. 5b). A scan of the current response against time (monitored at the peak of the oxidative current, 0.65 V) is shown in Fig. 5c. An increase in current was apparent at the onset of the compound cue and a second peak in current occurred after delivery of the pellet. In this trial, the cues evoked a greater increase in oxidative current than pellet delivery, consistent with existing literature.18 Principal component analysis was used with the calibration constant obtained by the µFC to convert the observed current into dopamine concentration19, and this concentration is plotted in Fig. 5c.
Figure 5.
Dopamine calibration for in vivo measurements. (A) The µFC produced a calibration curve to relate recorded current to dopamine concentration (1 nA= 48.26 nM) for a single electrode. Data shown are mean ± SEM for three trials at each concentration; errors are too small to be visible. (B) This same electrode was lowered into the nucleus accumbens core of an awake, behaving rat and used for in vivo measurements. A color plot (as described in detail in Fig. 4) shows dopamine release in vivo while the rat responded to food-predictive cues and pellet delivery. (C) The calibration curve is used in conjunction with principal component analysis to derive concentration of dopamine from current produced.
Electrode calibrations are essential for studies employing FSCV. While analyte identification can be performed in situ, understanding the relationship between observed current and concentration requires electrode calibration. The µFC permits accurate calibrations that can be performed before and/or after in vivo recordings. Accurate calibrations provide confidence that concentration values assigned to current changes match true concentrations of dopamine encountered in the brain. In addition, the µFC is applicable for other neurotransmitters, chemical species, and the measurement of a solution’s pH.
4. Conclusion
The µFC is a simple device that permits rapid switching between solutions exposed to electrodes used in analytical chemistry and neuroscience. Relative to other devices, the removal of external components not only simplified the setup, but the reservoirs of buffer and dopamine solutions also allowed for numerous repetitions of calibrations without frequent preloading. Importantly, values obtained in the µFC exhibited faster rise times and a shallower slope near the peak current. The current response of the µFC maintained its step-like shape over a large range of concentrations and produced linear calibration curves, which are essential for accurate modeling of in vivo dopamine concentrations. The µFC is a device that can be easily integrated in many laboratory setups and is a simple solution for electrode calibrations.
Supplementary Material
Acknowledgements
Support for this work was provided by NIH MH085073 and NIH R01 DA025634 to MFR.
References
- 1.Millar J, Stamford JA, Kruk ZL, Wightman RM. Eur J Pharmacol. 1985;109:341–348. doi: 10.1016/0014-2999(85)90394-2. [DOI] [PubMed] [Google Scholar]
- 2.May LJ, Kuhr WG, Wightman RM. J Neurochem. 1988;51:1060–1069. doi: 10.1111/j.1471-4159.1988.tb03069.x. [DOI] [PubMed] [Google Scholar]
- 3.Phillips PEM, Stuber GD, Heien MLAV, Wightman RM, Carelli RM. Nature. 2003;422:614–618. doi: 10.1038/nature01476. [DOI] [PubMed] [Google Scholar]
- 4.Wightman RM, Amatorh C, Engstrom RC, Hale PD, Kristensen EW, Kuhrand WG, May LJ. Neuroscience. 1988;25:513–523. doi: 10.1016/0306-4522(88)90255-2. [DOI] [PubMed] [Google Scholar]
- 5.Garris PA, Kilpatrick M, Bunin MA, Michael D, Walker QD, Wightman RM. Nature. 1999;398:67–69. doi: 10.1038/18019. [DOI] [PubMed] [Google Scholar]
- 6.Kristensen EW, Wilson RL, Wightman RM. Anal Chem. 1986;54:986–988. [Google Scholar]
- 7.John CE, Budygin EA, Mateo Y, Jones SR. J Neurochem. 2006;96:267–282. doi: 10.1111/j.1471-4159.2005.03557.x. [DOI] [PubMed] [Google Scholar]
- 8.Roitman MF, Stuber GD, Phillips PE, Wightman RM, Carelli RM. J Neurosci. 2004;24:1265–1271. doi: 10.1523/JNEUROSCI.3823-03.2004. [DOI] [PMC free article] [PubMed] [Google Scholar]
- 9.Fu L, Yang R, Lee G. Anal Chem. 2003;75:1905–1910. doi: 10.1021/ac020741d. [DOI] [PubMed] [Google Scholar]
- 10.Fan L, Liu L, Chen H, Chen X, Hu Z. J Chromatogr. A. 2005;1062:133–137. doi: 10.1016/j.chroma.2004.11.035. [DOI] [PubMed] [Google Scholar]
- 11.Moehlenbrock MJ, Price AK, Martin RS. Analyst. 2006;131:930–937. doi: 10.1039/b605136g. [DOI] [PubMed] [Google Scholar]
- 12.Moehlenbrock MJ, Martin RS. Lab Chip. 2007;7:1589–1596. doi: 10.1039/b707410g. [DOI] [PubMed] [Google Scholar]
- 13.Blankenstein G, Larsen UD. Biosens. Bioelectron. 1998;13:427–438. [Google Scholar]
- 14.Lee GB, Hung CI, Ke BJ, Huang GR, Hwei BH. J Micromech Microeng. 2001;11:567–573. [Google Scholar]
- 15.Lee GB, Hwei BH, Huang GR. J Micromech Microeng. 2001;11:654–661. [Google Scholar]
- 16.Sinton D, Ren L, Li D. J Colloid Interf Sci. 2003;266:448–456. doi: 10.1016/s0021-9797(03)00630-1. [DOI] [PubMed] [Google Scholar]
- 17.Ebner SR, Roitman MF, Potter DN, Rachlin AB, Chartoff EH. Psychopharmacology. 2010;210:241–250. doi: 10.1007/s00213-010-1836-5. [DOI] [PMC free article] [PubMed] [Google Scholar]
- 18.Day JJ, Roitman MF, Wightman RM, Carelli RM. Nat Neurosci. 2007;10:1020–1028. doi: 10.1038/nn1923. [DOI] [PubMed] [Google Scholar]
- 19.Heien ML, Johnson MA, Wightman RM. Anal Chem. 2004;76:5697–5704. doi: 10.1021/ac0491509. [DOI] [PubMed] [Google Scholar]
Associated Data
This section collects any data citations, data availability statements, or supplementary materials included in this article.


