

Abstract
Targeted cancer therapies offer renewed hope for an eventual "cure for cancer". At present, however, their success is often compromised by the emergence of resistant tumor cells. In many cancers, patients initially respond to single therapy treatment but relapse within months. Mathematical models of somatic evolution can predict and explain patterns in the success or failure of anti-cancer drugs. These models take into account the rate of cell division and death, the mutation rate, the size of the tumor, and the dynamics of tumor growth including density limitations caused by geometric and metabolic constraints. As more targeted therapies become available, mathematical modeling will provide an essential tool to inform the design of combination therapies that minimize the evolution of resistance.
Targeted Cancer Therapy
Targeted cancer therapies are drugs that interfere with specific molecular structures implicated in tumor development [1]. In contrast to chemotherapy, which acts by killing both cancer cells as well as normal cells that divide rapidly, targeted therapies are a much sharper instrument and offer the prospect of more effective cancer treatment, with fewer side effects. Most targeted therapies are either small-molecule drugs that act on targets found inside the cell (usually protein tyrosine kinases) or monoclonal antibodies directed against tumor-specific proteins on the cell surface [2].
The first drug that was rationally developed to block a known oncogene was imatinib, a small molecule drug that effectively blocks the activity of the BCR-ABL kinase protein in chronic myeloid leukemia (CML) [3]. The success of imatinib for treating CML is striking: the response rate to imatinib treatment is 90% compared with 35% that can be achieved with conventional chemotherapy [4]. Moreover, most patients taking imatinib achieve complete cytogenetic remission and those who do have an overall survival rate similar to the general population [5, 6]. Unfortunately, many of the more recent targeted therapies are not as successful over time. An example is the EGFR tyrosine kinase inhibitor gefitinib, used to treat the 10% of patients with non-small cell lung cancer (NSCLC) who have EGFR-activating mutations. Patients taking gefitinib have a higher response rate and longer progression-free survival (75% and 11 months, respectively) compared with those treated with standard chemotherapy (30% and 5 months); however, after two years, disease progresses in more than 90% of patients who initially responded to gefitinib treatment [7].
The failures of targeted therapies in patients who initially respond to treatment are usually due to acquired resistance. This resistance is often caused by a single genetic alteration in tumor cells, arising either before or during treatment [8, 9]. In the case of CML, several mutations in the BCR-ABL kinase domain have been shown to cause resistance to imatinib [10]. In the case of NSCLC, a mutation in EGFR is observed in approximately 50% of patients [11, 12]. The mutation that confers resistance to targeted therapy does not necessarily arise in the gene that is targeted. For example, resistance to BRAF inhibitor PLX4032 (vemurafinib), used in the treatment of melanomas, does not occur via mutations in the BRAF gene [13].
The current situation has interesting parallels to the treatment of HIV with AZT (coincidentally, a failed cancer drug) in the 1990s. AZT impedes HIV progression, but during prolonged treatment the virus usually develops resistance. It was only after the introduction of combination therapies with several HIV inhibitors that the disease became controllable in most patients. The hope for cancer is that similarly, as more targeted therapies become available, combination targeted therapies will be able to achieve indefinite remission in most cancer patients. However, the situation in cancer is more complicated than in HIV: because every cancer is genetically unique, many targeted therapies are needed for effective combination therapies to be available for all cancers.
To understand why some targeted therapies succeed while others ultimately fail, it is important to study the evolutionary process by which resistance arises. Mathematical evolutionary models have previously provided great insight into the gradual escape of HIV from the immune system [14–18] and the response of HIV to treatment [19–21], and similar models can be applied to the evolution of tumors.
Modeling the Evolution of Resistance to Cancer Therapy
Evolutionary modeling of cancer has a rich history dating to the 1950s, when Nordling [22] and Armitage and Doll [23, 24] showed how patterns in the age incidence of cancer could be explained by somatic evolutionary processes involving multiple mutations. Mathematical evolutionary models have elucidated important patterns in the genetic and clinical progression of cancer [25–32] and its response to treatment [33–36]. Attolini and Michor [37] provide a comprehensive review of the history and development of this field.
Evolutionary modeling is particularly useful for understanding the emergence of acquired resistance to treatment, either conventional chemotherapy or targeted therapy (Table 1). Investigations of this question usually model tumor growth and evolution as a branching process—a stochastic process in which cells divide and die at random. Mutations that confer resistance appear at random during cell divisions. In most models, the tumor and its clonal subpopulations (including those resistant to treatment) grow exponentially on average. However, many clones that arise subsequently disappear due to stochastic drift—fluctuations caused by randomness in cell division and death.
Table 1.
Models of the evolution of resistance to cancer therapy
| Event of interest | Model of tumor dynamicsa | Refs. |
|---|---|---|
| Resistant cells exist when tumor reaches detectable size | 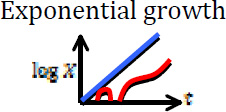 |
[33, 36, 38, 40, 41, 43, 45] |
| Treatment fails due to resistance acquired during treatment | 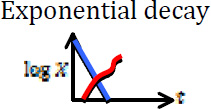 |
[47, 48] |
| Treatment fails due to resistance acquired before or during treatment | 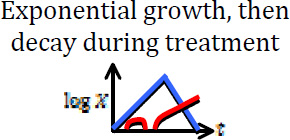 |
[35, 50] |
| Treatment fails due to resistance acquired before or during treatment |  |
This work |
Blue curves show the dynamics of sensitive cells, whereas red curves show a possible (stochastic) trajectory of the resistant cell population. In some cases, resistant cells may arise and subsequently disappear due to stochastic drift.
Goldie and Coldman [38–44] were the first to mathematically investigate the evolution of resistance to cancer therapy (chemotherapy, in their case). Specifically, they calculated the probability that resistant cells exist in a tumor that has grown exponentially to a certain size. One assumption made in their models is that resistance mutations are neutral (that is, they have no effect on fitness in the absence of treatment). Later work by Iwasa et al. [36], Haeno et al. [45], and Durrett and Moseley [46] relaxed this assumption by including the possibility that resistance mutations also confer a fitness advantage or disadvantage. A common feature of these investigations is their focus on the question of whether resistant cells exist in a tumor of detectable size. While this is a valuable question, it does not fully address whether treatment will eradicate the tumor because resistant cells may disappear during treatment due to stochastic drift, especially if they are only present in small numbers when treatment begins.
More recent work [47–49] has addressed the probability that a treatment will eradicate a tumor, if a given number of resistant cells are present at the start of treatment. In these models, the number of sensitive cells declines exponentially due to treatment. The number of resistant cells is expected to grow exponentially on average, but they may be eliminated due to stochastic drift. In these studies, the probability of eradication was calculated in a variety of situations, including cases in which multiple mutations are required for resistance (e.g. when combination therapies are used). The formulas derived there provide an important component for calculating the overall probability of tumor eradication.
Komarova and Wodarz [35, 50] derived an overall formula for the probability of tumor eradication in a fully stochastic model. They considered a tumor cell population that grows exponentially up to a certain size until treatment begins. During treatment, the number of sensitive cells declines exponentially, as in previous models. In their model, resistance can arise either before or during treatment. The authors calculated the probability of tumor eradication, based on the size of the tumor at the start of treatment and the rate at which resistance mutations appear. They found that resistance is more likely to arise during tumor growth rather than treatment. This effect is magnified if resistance requires multiple mutations (e.g. in the case of several drugs). A limiting assumption in this model is that tumors grow exponentially until treatment is initiated. While tumors are believed to initially grow exponentially, their growth can slow as they expand, due to nutrient shortages or geometric constraints [51–53]. Because of these restrictions, tumors often reach a steady state, with little or no tumor growth until further mutations arise [54–56].
Effects of Density Dependence on the Evolution of Resistance
We present a method for quantifying the evolution of resistance in tumors that grow subject to density limitations. We assume that tumor growth is initially exponential, but this growth slows as the tumor size increases, and the tumor eventually reaches a steady state. In this steady state, density constraints prevent further growth, unless new mutations arise that allow the tumor to overcome these constraints. The key parameters of our model are the number N of tumor cells at steady state; the time T that the tumor remains at steady state before treatment; the initial rates of division (r) and death (d) of tumor cells; the rate u at which resistance mutations are produced; and the division and death rates (r’ and d’ respectively) of sensitive cells under treatment, in the absence of density constraints.
Mathematically, this method is based on a density-dependent branching process model of tumor growth. In this model, tumor evolution starts with a single sensitive cell. Sensitive cells divide at rate r/(1+ηX) and die at rate d, where X is the current total number of cells in the tumor and η = (r − d)/Nd. From these formulas we can see that tumor growth is initially exponential with rate r − d, but that the division rate decreases as the tumor approaches size N. The net growth rate, r/(1+ηX) − d, is positive for X < N and negative for X > N, thus the tumor will remain at approximately size N (steady state), with small fluctuations, until treatment starts. At every division, one of the daughter cells will, with probability u, receive a mutation conferring resistance to treatment. We initially assume that resistance mutations are selectively neutral prior to treatment. After the tumor has been at steady state for time T, treatment is initiated. We assume that treatment affects only sensitive cells, reducing their division rate to r’/(1+ηX) with r’ ≤ r, and increasing the death rate to d’ ≥ d. We assume that r’ < d’, so that the sensitive cell population declines approximately exponentially during treatment (otherwise the treatment is ineffective).
The dynamics of tumor size in this model can be approximately described by three phases: (1) expansion (up to size N), (2) steady state (for time T), and (3) treatment (Figure 1).
Figure 1. Density-dependent model of the evolution of acquired resistance.

Sensitive cells (blue) initially grow exponentially, but this growth slows due to density constraints. Resistant cells (red) arise through mutation. When treatment begins, the sensitive cells decline, leaving room for resistant cells to grow.
Resistance mutations can arise during any of the three phases. However, the majority of resistance mutations will die out shortly after being produced, due to stochastic drift. For example, during the expansion and treatment phases, new resistance mutations disappear with probability approximately d / r, and those resistance mutations that do not survive drift have a median lifetime of log(2-d/r)/(r−d) days [57]. For the parameter values r = 0.25/day, d = 0.24/day [31, 54], only one out of every 25 resistance mutations survives stochastic drift, and the majority disappear within five days. Even resistant clones that grow to 20 cells still have a 44% [= (d / r)20] chance of disappearing due to drift. Resistance mutations arising during steady state have even slimmer chances: such a mutation has probability 1 / (1+dt) of surviving for t days after being produced. This probability decreases to zero as t increases.
Treatment will eradicate the tumor as long as no resistance mutations survive long enough to cause treatment failure. Considering that resistance mutations can arise during any phase, we write the overall probability P of tumor eradication as
Here P1, P2, and P3 are the probabilities that no resistance mutations leading to treatment failure arise during expansion, steady state, and treatment, respectively.
P1, the probability that no resistance mutation leading to treatment failure arises during expansion, is calculated in the Supplementary Material as
P2, the probability that no resistance mutation leading to treatment failure arises during steady state, is also calculated in the Supplementary Material as:
P3, the probability that no resistance mutation leading to treatment failure arises during treatment, was calculated in previous work [47–49]:
The accuracy of our formula for the probability of tumor eradication, using the above expressions for P1, P2, and P3, is verified by simulations in the Supplementary Material (Figure S1).
The formulas above apply to the case that resistance mutations are selectively neutral. In the Supplementary Material, we also consider resistance mutations that carry a fitness cost, so that resistant cells divide at a reduced rate r̂/(1+ηX), with r̂ < r. The analysis is similar in this case, but the formulas for P1, P2, and P3 are more complicated.
These formulas allow us to compare the relative importance of the three phases to the overall probability of eradication (Figure 2). Suppose, for example, that a tumor remains in steady state for a long period of time (T → ∞). In this case, if resistance mutations are neutral (prior to treatment), P1 increases to 1 and P2 decreases to zero, while P3 remains constant. Thus treatment failure is likely in this case, due to resistance acquired during steady state. The outcome is similar if resistance mutations are costly, except that P2 decreases not to zero, but to an intermediate value:
Figure 2. Treatment failure due to resistance acquired during three phases of tumor dynamics.

Top: Sample growth trajectories of three tumors, which spend different amounts of time at steady state (N=109) prior to treatment. Bottom: Probabilities of treatment failure due to resistance acquired during each of the three phases, and overall probability of treatment success, for these three trajectories. As more time is spent in steady state, treatment failure becomes increasingly likely, due to resistance acquired during this phase.
In the opposite scenario, if treatment begins while the tumor is expanding (i.e. T = 0 and there is no steady state), our method reproduces results obtained by Komarova and Wodarz [35] using their biphasic (expansion then treatment) model. Their results (and ours) indicate that acquired resistance leading to treatment failure is more likely to arise during expansion than during treatment (in symbols, P3 > P1).
This is true as long as the decline of sensitive tumor cells during treatment is faster than their growth during the expansion phase—a reasonable assumption for most targeted cancer therapies.
A common feature of all our results is that the probability of tumor eradication can be expressed as M−Nu, where M is a positive quantity that depends on T, r, ρ, and d, but not on N or u. From this insight we reason that (a) for Nu ≪ 1, tumor eradication is almost certain, (b) for Nu ≫ 1, treatment failure is almost certain, and (c) in between these two regimes, the probability of eradication declines sharply as Nu increases. A useful rule of thumb is that doubling the value of Nu has the effect of squaring the probability of treatment success. (For example, a 60% success probability would become 36% if Nu were doubled.) This exponential dependence on the product of tumor size and mutation rate was first noticed by Goldie and Coldman [38], who considered only the more limited question of whether resistant cells exist after a tumor grows exponentially up to a certain size. Our findings extend this principle to the entire process of density-dependent tumor growth and treatment.
In Table 2 we show numerical results for the probability of treatment success as a function of the number of cells at steady state, N, and time spent there, T. These results illustrate points (a), (b), and (c) above. Additionally, they show that when N and 1/u are of similar orders of magnitude, the time spent at steady state has a significant effect on probability of treatment success. For example, when N = 109 (which corresponds to a tumor of approximately 1 cm3) and resistance mutations arise at rate u = 10−9, waiting to treat for a year after the tumor reaches the carrying capacity decreases the probability of treatment success from 36% to 14%. Waiting for nine more years further decreases this chance to only 2%. This result reveals that treatment success depends critically not only on the size of the tumor, but also its age, underscoring the importance of early detection and treatment.
Table 2.
The probability of treatment success, depending on tumor size and time spent at steady stateb
| T=0 | T=1 year | T=10 years | |
|---|---|---|---|
| Neutral | |||
| N=107 | 0.990 | 0.981 | 0.964 |
| N=108 | 0.902 | 0.822 | 0.690 |
| N=109 | 0.357 | 0.140 | 0.024 |
| N=1010 | 0.0 | 0.0 | 0.0 |
| Deleterious | |||
| N=107 | 0.992 | 0.987 | 0.986 |
| N=108 | 0.925 | 0.881 | 0.867 |
| N=109 | 0.459 | 0.283 | 0.241 |
| N=1010 | 0.0 | 0.0 | 0.0 |
Parameter values: r=0.25, r’=0.1, d=d’=0.24, u=10−9. A deleterious resistant cell has a fitness disadvantage of 1% before treatment compared to sensitive cells (r̂= 0.99 r).
Another important question is how long the treatment should last in order to eradicate all sensitive cells in the tumor. In the Supplementary Material we calculate the time until there is probability p that all sensitive cells have been eradicated:
For example, in a tumor with N = 109 cells, using parameter values r’ = 0.22, d’ = 0.24, it will take 3.1 years of treatment to achieve a 99% probability that all sensitive cells have been eradicated. If treatment effectiveness is increased so that r’ = 0.1, d’ = 0.24, it will only take 0.5 years to achieve a 99% probability of eradication of sensitive cells. We caution, however, that eradication may take significantly longer if there are latent tumor cells unaffected by treatment.
Applications and Extensions
We believe our model may be useful in understanding resistance to many targeted therapies, and provides an important correction to models that assume exponential growth. The parameter values, including the division rate, death rate, rate of resistance mutation, and tumor size at steady state, may vary significantly among different types of cancer. Additionally, it may be appropriate to vary the functional form of the density limitation depending on the type of cancer (e.g., density limitations may apply differently in liquid versus solid tumors). However, our results remain applicable to other forms of density dependence as long as the three-phase approximation (exponential growth, steady state, treatment) is reasonably accurate.
Another important consideration in applying our model to different treatments is that some tumor cells may be incapable of regrowing a tumor, even if they carry a resistance mutation. This situation can be addressed by considering an “effective population size”—equal to the number of cells that could seed or regrow a tumor— in place of the actual number of cells.
We note that many of our results can also be applied to the evolution of resistance to conventional chemotherapy. However, failures of chemotherapy are often due to factors other than acquired resistance, such as toxicity to the patient.
The quantitative predictions of our model are empirically testable. For instance, our model predicts a negative exponential relationship between the number of tumor cells and the probability of tumor eradication. This can be tested using data on treatment success rates for different tumor sizes. If tumor age [32], resistance mutation rate, and other parameters can be estimated, the formulas we present for tumor eradication probabilities can be tested directly.
Concluding Remarks and Future Perspectives
Mathematical modeling is an important tool for understanding the failure of targeted cancer therapies due to acquired resistance. Previous research on this question has focused mostly on resistance arising either during exponential tumor growth or during treatment. We show that phases of slow or no tumor growth are also clinically important in that they present an opportunity for resistance mutations to arise, thereby decreasing the chance of treatment success. Future models might incorporate more complex tumor dynamics, including different forms of density dependence [51, 52] and/or alternating phases of growth and stasis.
As in the case of HIV, successful treatment of most cancers will likely require combination targeted therapy [58–61]. As more and more targeted therapies become available, the major challenge will be formulating effective combination therapies that minimize both the likelihood of resistance and toxicity to the patient. Mathematical models can help predict the success of potential combination therapies in advance of clinical trials.
Supplementary Material
Footnotes
Publisher's Disclaimer: This is a PDF file of an unedited manuscript that has been accepted for publication. As a service to our customers we are providing this early version of the manuscript. The manuscript will undergo copyediting, typesetting, and review of the resulting proof before it is published in its final citable form. Please note that during the production process errors may be discovered which could affect the content, and all legal disclaimers that apply to the journal pertain.
References
- 1.Sawyers C. Targeted cancer therapy. Nature. 2004;432:294–297. doi: 10.1038/nature03095. [DOI] [PubMed] [Google Scholar]
- 2.Imai K, Takaoka A. Comparing antibody and small-molecule therapies for cancer. Nat Rev Cancer. 2006;6:714–727. doi: 10.1038/nrc1913. [DOI] [PubMed] [Google Scholar]
- 3.Gambacorti-Passerini C. Part I: Milestones in personalised medicine--imatinib. The Lancet Oncology. 2008;9:600. doi: 10.1016/S1470-2045(08)70152-9. [DOI] [PubMed] [Google Scholar]
- 4.Gerber DE, Minna JD. ALK Inhibition for Non-Small Cell Lung Cancer: From Discovery to Therapy in Record Time. Cancer Cell. 2010;18:548–551. doi: 10.1016/j.ccr.2010.11.033. [DOI] [PMC free article] [PubMed] [Google Scholar]
- 5.Druker BJ, et al. Five-Year Follow-up of Patients Receiving Imatinib for Chronic Myeloid Leukemia. New England Journal of Medicine. 2006;355:2408–2417. doi: 10.1056/NEJMoa062867. [DOI] [PubMed] [Google Scholar]
- 6.Gambacorti-Passerini C, et al. Multicenter Independent Assessment of Outcomes in Chronic Myeloid Leukemia Patients Treated With Imatinib. Journal of the National Cancer Institute. 2011;103:553–561. doi: 10.1093/jnci/djr060. [DOI] [PubMed] [Google Scholar]
- 7.Maemondo M, et al. Gefitinib or chemotherapy for non-small-cell lung cancer with mutated EGFR. New England Journal of Medicine. 2010;362:2380–2388. doi: 10.1056/NEJMoa0909530. [DOI] [PubMed] [Google Scholar]
- 8.Pao W, et al. Acquired Resistance of Lung Adenocarcinomas to Gefitinib or Erlotinib Is Associated with a Second Mutation in the EGFR Kinase Domain. PLoS Med. 2005;2:e73. doi: 10.1371/journal.pmed.0020073. [DOI] [PMC free article] [PubMed] [Google Scholar]
- 9.Antonescu CR, et al. Acquired Resistance to Imatinib in Gastrointestinal Stromal Tumor Occurs Through Secondary Gene Mutation. Clinical Cancer Research. 2005;11:4182–4190. doi: 10.1158/1078-0432.CCR-04-2245. [DOI] [PubMed] [Google Scholar]
- 10.O'Hare T, et al. Bcr-Abl kinase domain mutations, drug resistance, and the road to a cure for chronic myeloid leukemia. Blood. 2007;110:2242–2249. doi: 10.1182/blood-2007-03-066936. [DOI] [PubMed] [Google Scholar]
- 11.Ercan D, et al. Amplification of EGFR T790M causes resistance to an irreversible EGFR inhibitor. Oncogene. 2010;29:2346–2356. doi: 10.1038/onc.2009.526. [DOI] [PMC free article] [PubMed] [Google Scholar]
- 12.Turke AB, et al. Preexistence and Clonal Selection of MET Amplification in EGFR Mutant NSCLC. Cancer Cell. 2010;17:77–88. doi: 10.1016/j.ccr.2009.11.022. [DOI] [PMC free article] [PubMed] [Google Scholar]
- 13.Nazarian R, et al. Melanomas acquire resistance to B-RAF(V600E) inhibition by RTK or N-RAS upregulation. Nature. 2010;468:973–977. doi: 10.1038/nature09626. [DOI] [PMC free article] [PubMed] [Google Scholar]
- 14.Nowak MA, et al. Antigenic diversity thresholds and the development of AIDS. Science. 1991;254:963–969. doi: 10.1126/science.1683006. [DOI] [PubMed] [Google Scholar]
- 15.Nowak MA, May RM. Mathematical biology of HIV infections: antigenic variation and diversity threshold. Mathematical Biosciences. 1991;106:1–21. doi: 10.1016/0025-5564(91)90037-j. [DOI] [PubMed] [Google Scholar]
- 16.Ho DD, et al. Rapid turnover of plasma virions and CD4 lymphocytes in HIV-1 infection. Nature. 1995;373:123–126. doi: 10.1038/373123a0. [DOI] [PubMed] [Google Scholar]
- 17.Wei X, et al. Viral dynamics in human immunodeficiency virus type 1 infection. Nature. 1995;373:117–122. doi: 10.1038/373117a0. [DOI] [PubMed] [Google Scholar]
- 18.Nowak MA, May RM. Virus dynamics: mathematical principles of immunology and virology. USA: Oxford University Press; 2000. [Google Scholar]
- 19.Coffin JM. HIV population dynamics in vivo: implications for genetic variation, pathogenesis, and therapy. Science. 1995;267:483–489. doi: 10.1126/science.7824947. [DOI] [PubMed] [Google Scholar]
- 20.Bonhoeffer S, et al. Virus dynamics and drug therapy. Proceedings of the National Academy of Sciences. 1997;94:6971–6976. doi: 10.1073/pnas.94.13.6971. [DOI] [PMC free article] [PubMed] [Google Scholar]
- 21.Bonhoeffer S, Nowak MA. Pre-existence and emergence of drug resistance in HIV-1 infection. Proceedings of the Royal Society of London. Series B: Biological Sciences. 1997;264:631–637. doi: 10.1098/rspb.1997.0089. [DOI] [PMC free article] [PubMed] [Google Scholar]
- 22.Nordling CO. A new theory on the cancer-inducing mechanism. British Journal of Cancer. 1953;7:68–72. doi: 10.1038/bjc.1953.8. [DOI] [PMC free article] [PubMed] [Google Scholar]
- 23.Armitage P, Doll R. The age distribution of cancer and a multi-stage theory of carcinogenesis. British Journal of Cancer. 1954;8:1–12. doi: 10.1038/bjc.1954.1. [DOI] [PMC free article] [PubMed] [Google Scholar]
- 24.Armitage P, Doll R. A two-stage theory of carcinogenesis in relation to the age distribution of human cancer. British Journal of Cancer. 1957;11:161–169. doi: 10.1038/bjc.1957.22. [DOI] [PMC free article] [PubMed] [Google Scholar]
- 25.Moolgavkar SH, Knudson AG. Mutation and cancer: a model for human carcinogenesis. Journal of the National Cancer Institute. 1981;66:1037–1052. doi: 10.1093/jnci/66.6.1037. [DOI] [PubMed] [Google Scholar]
- 26.Moolgavkar SH, Luebeck EG. Multistage carcinogenesis and the incidence of human cancer. Genes, Chromosomes and Cancer. 2003;38:302–306. doi: 10.1002/gcc.10264. [DOI] [PubMed] [Google Scholar]
- 27.Beerenwinkel N, et al. Genetic Progression and the Waiting Time to Cancer. PLoS Comput Biol. 2007;3:e225. doi: 10.1371/journal.pcbi.0030225. [DOI] [PMC free article] [PubMed] [Google Scholar]
- 28.Dingli D, et al. Stochastic dynamics of hematopoietic tumor stem cells. Cell Cycle. 2007;6:461–466. doi: 10.4161/cc.6.4.3853. [DOI] [PubMed] [Google Scholar]
- 29.Gatenby RA, Gillies RJ. A microenvironmental model of carcinogenesis. Nat Rev Cancer. 2008;8:56–61. doi: 10.1038/nrc2255. [DOI] [PubMed] [Google Scholar]
- 30.Meza R, et al. Age-specific incidence of cancer: Phases, transitions, and biological implications. Proceedings of the National Academy of Sciences. 2008;105:16284–16289. doi: 10.1073/pnas.0801151105. [DOI] [PMC free article] [PubMed] [Google Scholar]
- 31.Bozic I, et al. Accumulation of driver and passenger mutations during tumor progression. Proceedings of the National Academy of Sciences. 2010;107:18545–18550. doi: 10.1073/pnas.1010978107. [DOI] [PMC free article] [PubMed] [Google Scholar]
- 32.Yachida S, et al. Distant metastasis occurs late during the genetic evolution of pancreatic cancer. Nature. 2010;467:1114–1117. doi: 10.1038/nature09515. [DOI] [PMC free article] [PubMed] [Google Scholar]
- 33.Goldie JH, Coldman AJ. Drug resistance in cancer: mechanisms and models. Cambridge University Press; 1998. [Google Scholar]
- 34.Michor F, et al. Dynamics of chronic myeloid leukaemia. Nature. 2005;435:1267–1270. doi: 10.1038/nature03669. [DOI] [PubMed] [Google Scholar]
- 35.Komarova NL, Wodarz D. Drug resistance in cancer: Principles of emergence and prevention. Proceedings of the National Academy of Sciences of the United States of America. 2005;102:9714–9719. doi: 10.1073/pnas.0501870102. [DOI] [PMC free article] [PubMed] [Google Scholar]
- 36.Iwasa Y, et al. Evolution of Resistance During Clonal Expansion. Genetics. 2006;172:2557–2566. doi: 10.1534/genetics.105.049791. [DOI] [PMC free article] [PubMed] [Google Scholar]
- 37.Attolini CS-O, Michor F. Evolutionary Theory of Cancer. Annals of the New York Academy of Sciences. 2009;1168:23–51. doi: 10.1111/j.1749-6632.2009.04880.x. [DOI] [PubMed] [Google Scholar]
- 38.Goldie JH, Coldman AJ. A mathematic model for relating the drug sensitivity of tumors to their spontaneous mutation rate. Cancer Treatment Reports. 1979;63:1727–1733. [PubMed] [Google Scholar]
- 39.Goldie JH, et al. Rationale for the use of alternating non-cross-resistant chemotherapy. Cancer Treatment Reports. 1982;66:439–449. [PubMed] [Google Scholar]
- 40.Coldman AJ, Goldie JH. A model for the resistance of tumor cells to cancer chemotherapeutic agents. Mathematical Biosciences. 1983;65:291–307. [Google Scholar]
- 41.Goldie JH, Coldman AJ. Quantitative model for multiple levels of drug resistance in clinical tumors. Cancer Treatment Reports. 1983;67:923–931. [PubMed] [Google Scholar]
- 42.Coldman AJ, et al. The effect of cellular differentiation on the development of permanent drug resistance. Mathematical Biosciences. 1985;74:177–198. [Google Scholar]
- 43.Coldman AJ, Goldie JH. A stochastic model for the origin and treatment of tumors containing drug-resistant cells. Bulletin of Mathematical Biology. 1986;48:279–292. doi: 10.1007/BF02459682. [DOI] [PubMed] [Google Scholar]
- 44.Goldie JH, Coldman AJ. Application of theoretical models to chemotherapy protocol design. Cancer Treatment Reports. 1986;70:127–131. [PubMed] [Google Scholar]
- 45.Haeno H, et al. The Evolution of Two Mutations During Clonal Expansion. Genetics. 2007;177:2209–2221. doi: 10.1534/genetics.107.078915. [DOI] [PMC free article] [PubMed] [Google Scholar]
- 46.Durrett R, Moseley S. Evolution of resistance and progression to disease during clonal expansion of cancer. Theoretical Population Biology. 2010;77:42–48. doi: 10.1016/j.tpb.2009.10.008. [DOI] [PubMed] [Google Scholar]
- 47.Iwasa Y, et al. Evolutionary dynamics of escape from biomedical intervention. Proceedings of the Royal Society of London. Series B: Biological Sciences. 2003;270:2573–2578. doi: 10.1098/rspb.2003.2539. [DOI] [PMC free article] [PubMed] [Google Scholar]
- 48.Iwasa Y, et al. Evolutionary dynamics of invasion and escape. Journal of Theoretical Biology. 2004;226:205–214. doi: 10.1016/j.jtbi.2003.08.014. [DOI] [PubMed] [Google Scholar]
- 49.Michor F, et al. Evolution of resistance to cancer therapy. Current Pharmaceutical Design. 2006;12:261–271. doi: 10.2174/138161206775201956. [DOI] [PubMed] [Google Scholar]
- 50.Komarova N. Stochastic modeling of drug resistance in cancer. Journal of Theoretical Biology. 2006;239:351–366. doi: 10.1016/j.jtbi.2005.08.003. [DOI] [PubMed] [Google Scholar]
- 51.Hart D, et al. The growth law of primary breast cancer as inferred from mammography screening trials data. British journal of cancer. 1998;78:382–387. doi: 10.1038/bjc.1998.503. [DOI] [PMC free article] [PubMed] [Google Scholar]
- 52.Spratt JA, et al. Decelerating growth and human breast cancer. Cancer. 1993;71:2013–2019. doi: 10.1002/1097-0142(19930315)71:6<2013::aid-cncr2820710615>3.0.co;2-v. [DOI] [PubMed] [Google Scholar]
- 53.Vaupel P, et al. Blood Flow, Oxygen and Nutrient Supply, and Metabolic Microenvironment of Human Tumors: A Review. Cancer Research. 1989;49:6449–6465. [PubMed] [Google Scholar]
- 54.Jones S, et al. Comparative lesion sequencing provides insights into tumor evolution. Proceedings of the National Academy of Sciences. 2008;105:4283–4288. doi: 10.1073/pnas.0712345105. [DOI] [PMC free article] [PubMed] [Google Scholar]
- 55.Jiang Y, et al. A Multiscale Model for Avascular Tumor Growth. Biophysical journal. 2005;89:3884–3894. doi: 10.1529/biophysj.105.060640. [DOI] [PMC free article] [PubMed] [Google Scholar]
- 56.Yun J, et al. Glucose Deprivation Contributes to the Development of KRAS Pathway Mutations in Tumor Cells. Science. 2009;325:1555–1559. doi: 10.1126/science.1174229. [DOI] [PMC free article] [PubMed] [Google Scholar]
- 57.Athreya KB, Ney P. Branching Processes. Dover Pubns; 2004. [Google Scholar]
- 58.Azad NS, et al. Combination Targeted Therapy With Sorafenib and Bevacizumab Results in Enhanced Toxicity and Antitumor Activity. Journal of Clinical Oncology. 2008;26:3709–3714. doi: 10.1200/JCO.2007.10.8332. [DOI] [PMC free article] [PubMed] [Google Scholar]
- 59.Komarova NL, et al. PLoS ONE. Vol. 4. Public Library of Science; 2009. Combination of two but not three current targeted drugs can improve therapy of chronic myeloid leukemia. [DOI] [PMC free article] [PubMed] [Google Scholar]
- 60.Sosman JA, et al. Opportunities and Obstacles to Combination Targeted Therapy in Renal Cell Cancer. Clinical Cancer Research. 2007;13:764s–769s. doi: 10.1158/1078-0432.CCR-06-1975. [DOI] [PubMed] [Google Scholar]
- 61.Nimeiri HS, et al. Efficacy and safety of bevacizumab plus erlotinib for patients with recurrent ovarian, primary peritoneal, and fallopian tube cancer: A trial of the Chicago, PMH, and California Phase II consortia. Gynecologic Oncology. 2008;110:49–55. doi: 10.1016/j.ygyno.2008.02.009. [DOI] [PMC free article] [PubMed] [Google Scholar]
Associated Data
This section collects any data citations, data availability statements, or supplementary materials included in this article.