

Abstract
BACKGROUND AND PURPOSE
Soluble epoxide hydrolase inhibitors (sEHIs) possess anti-inflammatory, antiatherosclerotic, antihypertensive and analgesic properties. The pharmacokinetics (PK) and pharmacodynamics in terms of inhibitory potency of sEHIs were assessed in non-human primates (NHPs). Development of a sEHI for use in NHPs will facilitate investigations on the role of sEH in numerous chronic inflammatory conditions.
EXPERIMENTAL APPROACH
PK parameters of 11 sEHIs in cynomolgus monkeys were determined after oral dosing with 0.3 mg·kg−1. Their physical properties and inhibitory potency in hepatic cytosol of cynomolgus monkeys were examined. Dose-dependent effects of the two inhibitors 1-trifluoromethoxyphenyl-3-(1-propionylpiperidin-4-yl) urea (TPPU) and the related acetyl piperidine derivative, 1-trifluoromethoxyphenyl-3-(1-acetylpiperidin-4-yl) urea (TPAU), on natural blood eicosanoids, were determined.
KEY RESULTS
Among the inhibitors tested, TPPU and two 4-(cyclohexyloxy) benzoic acid urea sEHIs displayed high plasma concentrations (>10 × IC50), when dosed orally at 0.3 mg·kg−1. Although the 4-(cyclohexyloxy) benzoic acid ureas were more potent against monkey sEH than piperidyl ureas (TPAU and TPPU), the latter compounds showed higher plasma concentrations and more drug-like properties. The Cmax increased with dose from 0.3 to 3 mg·kg−1 for TPPU and from 0.1 to 3 mg·kg−1 for TPAU, although it was not linear over this range of doses. As an indication of target engagement, ratios of linoleate epoxides to diols increased with TPPU administration.
CONCLUSION AND IMPLICATIONS
Our data indicate that TPPU is suitable for investigating sEH biology and the role of epoxide-containing lipids in modulating inflammatory diseases in NHPs.
Keywords: soluble epoxide hydrolase inhibitors, pharmacokinetics, cynomolgus monkeys, atherosclerosis
Introduction
The soluble epoxide hydrolase (sEH; EC 3.3.2.10) is responsible for the conversion of fatty acid and some other epoxides to their corresponding diols. In the arachidonic acid (AA) cascade, sEH converts epoxyeicosatrienoic acids (EETs) to dihydroxyeicosatrienoic acids (DHETs) (Newman et al., 2005). These endogenous lipid epoxides show anti-inflammatory (Node et al., 1999), antihypertensive (Fang et al., 2001), analgesic (Schmelzer et al., 2005; Inceoglu et al., 2006), angiogenic (Fleming, 2007) and antiatherosclerotic effects in rodents and humans (Pfister et al., 1991). It has been proposed that inhibition of sEH may have therapeutic effects in various inflammatory diseases, such as atherosclerosis, cardiac hypertrophy; hypertension-induced renal damage and inflammatory pain (Chiamvimonvat et al., 2007; Imig and Hammock, 2009). Supporting this hypothesis, sEH inhibitors (sEHIs) were shown to attenuate inflammation in various disease settings by stabilizing EET plasma concentrations in vivo (Dorrance et al., 2005; Imig et al., 2005; Fang, 2006; Inceoglu et al., 2006). Recently, we showed that inhibition of sEH, using 1-adamantanyl-3-{5-[2-(2-ethoxyethoxy) ethoxy] pentyl]} urea (AEPU), attenuated the progression of atherosclerosis in mice (Ulu et al., 2008), which was further supported with a structurally different sEHI (Zhang et al., 2009).
Numerous sEHIs with dramatic differences in potency (Morisseau et al., 1999; Kim et al., 2004) and pharmacokinetic (PK) properties were obtained, although these inhibitors possess selectivity across various species, including mice (Watanabe et al., 2006; Liu et al., 2009), rats (Kim et al., 2007) and dogs (Tsai et al., 2010). A general structure of these inhibitors was described in detail recently (Tsai et al., 2010). Promising pharmacokinetic properties were observed in mice (Liu et al., 2009) and rats (Kim et al., 2007) with urea sEHIs in piperidine, cyclohexyl ether, and cyclohexyl polyether series. The highly different PK profiles, observed between rodent species for these compounds highlights the importance of optimizing PK in non-human primates (NHPs) in order to study the role of sEH in chronic inflammatory conditions in primates.
Cynomolgus monkeys (Macaca fascicularis) are widely recognized models in atherosclerosis and inflammation research (Register, 2009). The similarity of the prognosis of cardiovascular diseases to humans makes it attractive to use these macaques as research models of inflammation and cardiovascular diseases (Clarkson and Mehaffey, 2009). For long-term expensive studies in NHPs, it is critical to select an investigational drug with high inhibitory potency, drug-like physicochemical properties, PK with high area under the curve (AUC) values, a relatively long half-life and a biomarker of the target engagement in vivo. To avoid the need for frequent dosing and to maintain relatively steady blood concentrations in our long-term studies with cynomolgus monkeys, we sought a compound with a relatively long half-life. In this study, we report our investigation of the pharmacokinetics of 11 orally bioavailable sEHIs in cynomolgus monkeys for future primate studies. Inhibitors were administered in two separate oral cassette doses to allow for rapid screening of a variety of compounds while using fewer animals. Possible drug–drug interactions due to competing clearance pathways or drug transporters, while possible, are expected to be small because of the low doses used in this study. Key compounds were re-evaluated in single dosing studies.
Methods
Animals
All animal care and experimental procedures were approved by the Wake Forest University Animal Care and Use Committee and complied with state and federal laws and the guidelines of the US Department of Health and Human Services. Female cynomolgus monkeys (M. fascicularis, long-tailed or crab-eating macaque), ranging in age between 16 and 18 years (based on their dental examination) and weighing between ∼2.5 and 4 kg, were used for the dosing of the sEHIs. Two groups of animals (n = 4 per group) were used for cassette dosing experiments at 0.3 mg·kg−1 of each compound. Individual compounds were dosed separately in the same way in subsequent studies but at varying doses. The animals were fasted during the experiments and were sedated with ketamine (15 mg·kg−1 i.m.) to administer the sEHIs by gastric intubation. In one study, the sEHIs were administered in the diet once a day for 5 days to reach steady state. Then, the drug administration was halted and elimination kinetics of the sEHI was determined.
sEH activity assays
Livers of cynomolgus macaques were obtained from Wake Forest University Primate Center and Department of Pathology Comparative Medicine. Three grams of monkey liver was homogenized in 10 mL of chilled sodium phosphate buffer (100 mM, pH 7.4) with a protease inhibitor (PMSF). Resulting liver homogenates were centrifuged first at 12 000×g for 10 min to separate cell membranes, nuclei, mitochondria and peroxisomes as the 12 000×g pellet fraction. This pellet was resuspended in 4 mL sodium phosphate buffer (100 mM, pH 7.4). Then, the remaining supernatant was centrifuged at 100 000×g for 1 h to obtain the microsomal pellet and the 100 000×g soluble fraction (cytosol). The 100 000×g pellet was resuspended in 3 mL sodium phosphate buffer (100 mM, pH 7.4). These subcellular fractions were flash frozen in liquid nitrogen and kept at −80°C until used.
trans-diphenyl propene oxide ([3H]-t-DPPO), trans-stilbene oxide ([3H]-t-SO) and cis-stilbene oxide ([3H]-c-SO) radioactive partition assays were performed to detect the sEH activity in these separated subcellular fractions (Morisseau and Hammock, 2007) (see Supporting Information Figure S1A for structures of the substrates). Samples (100 µL) of the diluted monkey liver fractions (5- to 50-fold in sodium phosphate buffer (100 mM, pH 7.4) containing 0.1 mg·mL−1 BSA) were incubated for 10 min at 30°C with the substrate ([S]final= 50 µM,) containing 104 cpm per assay. The reactions were stopped by extraction of the substrates as described (Borhan et al., 1995), and the activity evaluated by measuring the amount of radioactive diol formed in the buffer. For the natural substrate 14,15-EET, reactions were performed similarly; however diol formation was measured by LC/MS/MS analysis as described (Morisseau and Hammock, 2007). Inhibition potencies (IC50 values) were determined using the [3H]-t-DPPO assay, as well as with 14,15-EET in cytosolic fractions. Before introduction of the substrates, the inhibitor and enzyme were incubated for 10 min at 30°C.
The IC50 values are defined as inhibitor concentrations that reduced the enzymatic activity by 50% and were calculated in the linear range of the dose-response curve for log inhibitor concentration versus % inhibition. These values are the averages of three replicates, obtained from the experiments, which were performed with various concentrations of the inhibitors (1–50 000 nM) that include at least two datum points above and two datum points below the IC50. We previously showed a high z-value for the assay and the standard error for the IC50 values is between 10 and 20% for the assays performed here suggesting that the differences of twofold or greater would be significant (Jones et al., 2005; Rose et al., 2010).
PK studies
sEHIs were administered orally with two separate cassettes, all at a 0.3 mg·kg−1 dose. Selected inhibitors for each cassette were dissolved in PEG-400, which was added to safflower oil to give a total volume of 20 mL. The 10% PEG-400 formulations (v/v) in safflower oil yield true solutions of all compounds. Upon administration of sEHIs at a 0.3 mg·kg−1 dose, 10 µl blood samples were collected from the tail vein at time points of 0, 0.25, 0.5, 1, 2, 3, 4, 8, 24, 48 and 72 h, by a tip prerinsed with heparin to prevent blood coagulation. Collected blood samples were put into Eppendorf tubes containing 50 µl distilled water with two surrogate internal standards (Supporting Information Figure S1B, to measure the extraction efficiency and to correct for the calculated concentrations of sEHIs) and immediately shaken to prevent coagulation of the blood sample. Liquid–liquid extraction (repeated twice) of the blood samples were performed with 200 µl ethyl acetate (Liu et al., 2009). Collected organic phases were dried using a vacuum centrifuge and redissolved with an additional internal standard solution (Supporting Information Figure S1B) in methanol to allow us to distinguish between variation resulting from extraction and from instrumental analysis. All the analytes were quantified using liquid chromatography mass spectrometry (LC/MS) analysis (see Supporting Information for conditions) using a standard curve that ranged between 1.9 and 500 ng·mL−1 for each analyte. The HPLC solvent gradients are given in Supporting Information Table S1. Limit of detection values and mass transient specifications of each compound are given in the Supporting Information Table S2. Samples were run in triplicate on different days to test the reproducibility of the results.
Elimination half-lives and steady state concentrations at four doses were determined for the piperidine sEHI 1-trifluoromethoxyphenyl-3-(1-acetylpiperidin-4-yl) urea (TPAU), following dietary administration. TPAU was dissolved in safflower oil to give 0.9 mg·mL−1 stock solutions. Shortly before use, it was mixed into warm safflower oil followed by other contents of the diet of the cynomolgus monkeys to give the desired dose. After preparation, the diet was kept in cold and was given to the animals daily. Diet pellets containing TPAU were provided once per day, and the animals were watched to ensure total consumption. Four animals for each dose (0.1, 0.3, 1 and 3 mg·kg−1) were fed for 5 days with this diet, then TPAU administration was stopped. Blood samples were collected at 0, 4, 24, 48 and 72 h postdosing to determine steady-state concentrations (Css) at 0 time and elimination kinetics.
Dose escalation experiment
1-trifluoromethoxyphenyl-3-(1-propionylpiperidin-4-yl) urea (TPPU), was prepared in 0.3, 1 and 3 mg·kg−1 doses and was administered to four animals with 48 h dosing intervals based on the t1/2 of the compound obtained from the first cassette dosing. Blood was collected from animals at time points 0, 0.25, 0.5, 1, 2, 3, 4, 8, 24 and 48 h after each dosing.
PK methodology
The blood concentration–time course was fitted to a non-compartmental model using the WinNonlin software (Pharsight, Mountain View, CA, USA). The PK parameters were first calculated for each individual animal, then were averaged to obtain group AUC, Cmax and tmax values. The non-compartmental model gave the best correlation coefficient (r = 0.99) and Akaike information criterion (AIC) between the observed and predicted values. The model associated with the smallest AIC is considered to give the best fit to the model. AUC was calculated from time 0 to the last time point in the blood concentration–time curve, with no extrapolation to infinity by the linear/log trapezoidal rule. The time range that was used to calculate AUC (0-t) was 0–72 h for compounds that were included in one time cassette dosing experiments, and 0–48 h for dose escalation experiments.
Oxylipin analysis
Plasma oxylipins were isolated using solid phase extraction (SPE) followed by LC/MS analysis. Briefly, 250 µl plasma samples were put onto a C18 SPE cartridge with an antioxidant (butylated hydroxytoluene) and internal standard solution, and then pulled through the cartridge under low vacuum. After the samples were bound to the C18 cartridge (Waters Oasis HLB C18 cartridge, Waters Corporation, Milford, MA, USA), oxylipins were eluted by methanol, then ethyl acetate and evaporated to dryness with a vacuum centrifuge. The samples were then redissolved with 50 µl additional standard solution in methanol and measured using mass spectrometry (Yang et al., 2009). A more detailed procedure is given in the Supporting Information and structures of standards are given in Supporting Information Figure S1.
Data analysis
Results are expressed as mean ± SD. Analyte concentrations in blood obtained by LC/MS were evaluated for the PK parameters using the time–blood concentration course. Random effects, repeated measures, two-way anova was performed to determine differences between the epoxide: diol ratios at different time points and different dose groups. Ranking of the sEHI potencies between the cynomolgus and human sEH enzymes was evaluated using Spearman's rank correlation, where increasing positive P-values represent the agreement between two rankings.
Materials
Methanol, acetonitrile, ethyl acetate and ethanol were purchased from Fisher Scientific (Pittsburgh, PA, USA). Formic acid and polyethylene glycol-400 (PEG-400) were purchased from Sigma-Aldrich (St. Louis, NJ, USA). De-ionized water (18.3 MΩ) was obtained by a NANO pure system (Barnstead, Newton, MA, USA). The inhibitor compounds examined in these experiments were synthesized as described by Hwang et al., (2007), Jones et al., (2006) and Rose et al., (2010). Radiolabelled compounds were as follows: the [3H]-t-DPPO was prepared by Borhan et al. (1995) with an original specific activity of 2.5GBq and [3H]-c-SO was prepared by Hammock et al. (1984) with an original specific activity of 555GBq according to Gill et al. (1983).
Results
sEH activity in cynomolgus liver
The sEH activity was determined in the subcellular fractions of the monkey liver, using four different substrates (Table 1, Supporting Information Figure S1A) to characterize the cynomolgus enzyme. The total activities for [3H]-t-DPPO, [3H]-t-SO and 14,15-EETs, which are good sEH substrates (Newman et al., 2005), were the highest in the cytosolic fraction followed by the 12 000×g fraction, and were very low in the microsomal fraction. When comparing the cytosolic specific activities, the monkey liver yields the following substrate selectivity, which is similar to the one observed for the human sEH: [3H]-t-DPPO ≍ 14,15-EETs > [3H]-t-SO >> [3H]-c-SO. In contrast, the total activity for [3H]-c-SO, was very high in the microsomal fraction and 12 000×g fraction and very low in the cytosolic fraction. The microsomal fraction specific activities indicates a substrate selectivity ([3H]-c SO >> [3H]-t-DPPO ≍ 14,15-EETs ≍[3H]-t SO).
Table 1.
Substrate selectivity of the sEH activity in the subcellular fractions of monkey livera
| [3H]-t-DPPO | [3H]-t-SO | [3H]-c-SO | 14,15-EET | |||||||||
|---|---|---|---|---|---|---|---|---|---|---|---|---|
| Subcellular Fraction | SAb | TA | RA | SA | TA | RA | SA | TA | RA | SA | TA | RA |
| 12 000×g (debris, mitochondrial-peroxisomal)c | 1 | 37 | 13 | 0.3 | 10 | 22 | 47 | 1400 | 51 | 1 | 34 | 14 |
| Microsomal | 0.4 | 13 | 4 | 0.2 | 5 | 11 | 36 | 1300 | 47 | 0.4 | 14 | 6 |
| Cytosolic | 2 | 240 | 83 | 0.3 | 30 | 67 | 0.4 | 44 | 2 | 2 | 190 | 80 |
Activity was not determined with the fluorescent substrate cyano(2-methoxynaphthalen-6-yl)methyl (3-phenyloxiran-2-yl)methyl carbonate (CMNPC) in crude fractions because of competing chemical and enzymatic reactions.
SA, specific activity (nmol·min−1·mg−1); TA, total activity (nmol·min−1·g tissue−1); RA, relative activity (%) as a percent of total activity detected.
This subcellular fraction was not washed. The epoxide hydrolase activity in the 12 000 x g (debris/mitochondrial/peroxisomal) fraction contains a great deal of activity from the cytosolic and microsomal fractions as well as nuclei, cell membranes and debris. Much of the activity in the microsomal fraction on [3H]-t-DPPO, [3H]-t-SO and 14,15-EET is due to sEH trapped in the fraction (Borhan et al., 1995).
Potency of sEHIs in monkey hepatic cytosol
The chemical structures of the compounds selected for this study are given in Table 2. We selected these inhibitors from our small molecule library (Kim et al., 2004; Jones et al., 2006; Hwang et al., 2007; Rose et al., 2010; Tsai et al., 2010) (see Supporting Information for the synthesis of the inhibitors that were not published elsewhere). A schematic presentation of the two series of inhibitors studied is shown in Supporting Information Figure S1C. The inhibitors tested here, all contained urea as the central pharmacophore that binds to the active site of sEH. The initial selection of these compounds was based on adequate structural variation, PK data (relatively good AUC) in rodents and dogs (Liu et al., 2009; Tsai et al., 2010), and potencies on the affinity purified human recombinant sEH (IC50 < 20 nM).
Table 2.
Chemical structures and IC50 values of soluble epoxide hydrolase inhibitors in primates
| Compound number | Acronyma | Chemical structure | Monkey sEH IC50 (nM)%b | Human sEH IC50 (nM)%c | Cassette number# |
|---|---|---|---|---|---|
| 1 | AEPU |  |
310 ± 30 | 14 ± 1 (45)d | 1 |
| AEPU-Metabolite | 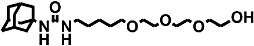 |
620 ± 60 | 63 | e | |
| APAU | 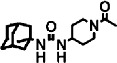 |
1000 ± 100 | 15 ± 1.5 (300) | f | |
| 2 | TPAU | 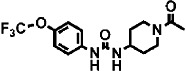 |
460 ± 50 | 12 ± 1 (160) | 1 |
| 3 | TPPU | 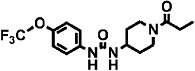 |
37 ± 4 | 3.7 ± 0.4 (48) | 1 |
| 4 | – | 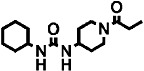 |
70 ± 7 | 12 ± 1 | 2 |
| 5 | – | 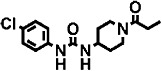 |
390 ± 40 | 10 ± 1 | 2 |
| 6 | t-TUCB | 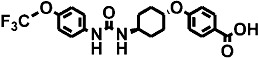 |
27 ± 3 | 1 ± 0.1 (9) | 2 |
| 7 | t-CPUB | 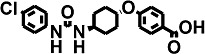 |
37 ± 4 | 6 ± 1 (22) | 2 |
| 8 | 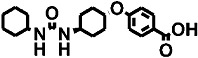 |
78 ± 8 | 4 ± 0.4 | 2 | |
| t-AUCB | 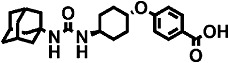 |
27 ± 3 | 2 ± 0.2 (5) | e | |
| 9 | – |  |
4 ± 0.4 | 3 ± 0.3 | 1 |
| 10 | – | 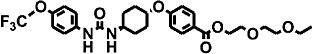 |
3 ± 0.3 | 5 ± 0.5 | 1 |
| 11 | TCC | 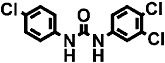 |
3500 ± 4 | 13 ± 1 (400) | 2 |
Data are mean ± SD.
Only compounds that were administered to the animals are numbered. Acronyms are given for the previously reported inhibitors as well as for the compounds that gave the best PK results.
IC50 in the hepatic cytosol of cynomolgus monkeys are obtained from the radioactive t-DPPO partition assay for sEH activity (Borhan et al., 1995). The standard error for the IC50 values is between 10 and 20% for the assays performed here, suggesting that the differences of twofold or greater would be significant.
IC50 of the recombinant human sEH are obtained using the fluorescent substrate, CMNPC (Jones et al., 2005). The standard error for the IC50 values is between 10 and 20% for the assays performed here suggesting that the differences of twofold or greater would be significant.
IC50s, obtained with the radioactive t-DPPO partition assay using recombinant human sEH are given in parentheses.
Detected only as a metabolite (not actually administered in this study) of AEPU and polyether ester of t-AUCB respectively.
Excluded from the cassette dosing due to its poor PK in rodents and dogs (see text). The structure and some data are included as a bridging compound (Jones et al., 2006).
Inhibitory potencies (as IC50) were determined with the monkey hepatic cytosol using [3H]-t-DPPO as the substrate (Table 2). In separate studies, IC50 values determined with [3H]-t-DPPO were found to be predictive of those determined with 14,15-EET (Borhan et al., 1995). For comparison, we added the results obtained for the purified recombinant human sEH with a fluorescent assay and, in some cases, the IC50 values determined with [3H]-t-DPPO are also shown. When we tested the inhibitors using the [3H]-t-DPPO assay (see parentheses for IC50 values for the human sEH in Table 2), the potencies were closer to the values obtained with cynomolgus sEH, which were also determined with the [3H]-t-DPPO assay. For instance, for three compounds [TPPU, trans-4-{4-[3-(4-trifluoromethoxy-phenyl)-ureido]-cyclohexyloxy}-benzoic acid (t-TUCB) and trans-4-{4-[3–4-chloro-phenyl)-ureido]-cyclohexyl}-benzoic acid (t-CPUB)], we found potencies similar to the ones obtained with the monkey enzyme (TPPU 55 vs. 37 nM, t-TUCB 9 vs. 27 nM and t-CPUB 43 vs. 37 nM).
The polyethoxylate compound AEPU showed moderate activity on the human enzyme (Table 2), and this activity is lower when [3H]-t-DPPO was used as substrate (IC50= 45 nM). The piperidine compounds [1-(1-acetypiperidin-4-yl)-3-adamantanylurea (APAU) and 2–5] showed a range of potencies with APAU being the weakest inhibitor tested with both the monkey and human sEH. The assays both showed TPPU (compound 3 in the Table) to be the most potent among the piperidine inhibitors. Among the cyclohexyl ethers, t-TUCB (compound 6) and trans-4-[4-(3-adamantan-1-yl-ureido)-cyclohexyloxy]-benzoic acid (t-AUCB) are the most potent inhibitors with the monkey enzyme. However, compounds 7 and 8 were also highly potent on both the monkey and human enzymes. Compared with these cyclohexyl ethers, the polyether ester pro-drugs, (compounds 9 and 10) showed better potency. The antimicrobial compound 3,4,4′-trichlorocarbanilide (TCC) showed very low potency against the monkey enzyme compared with the human enzyme.
Physicochemical properties, which included the water solubility, melting point, partition coefficient (log P) and plasma protein bindings were determined to investigate the drug-likeness of the sEHIs tested here. These detailed results are shown in Supporting Information Table S3 and the Supporting Information.
Pharmacokinetics of sEHIs
Compounds were administered orally to the monkeys in two cassettes (six compounds in each). The composition of the cassettes was chosen to ensure high structural variation in each cassette. Furthermore, each compound was given at a low dose (0.3 mg·kg−1) to reduce possible drug–drug interaction among compounds and to approximate an anticipated therapeutic dose. We previously showed that 10 µL blood is sufficient to measure the concentrations of the sEHIs for PK studies (Watanabe et al., 2006). Comparative concentrations for several compounds when determined in whole blood compared with plasma are shown in the Supporting Information (Supporting Information Figure S3). In addition, these small blood samples could be collected with minimal trauma to the animals. The blood concentration–time courses of the sEHIs are shown in Figure 1 for compounds giving the best results and Supporting Information Figure S2A–G for the other sEHIs. The PK parameters, shown in Table 3, were obtained from these PK profiles.
Figure 1.
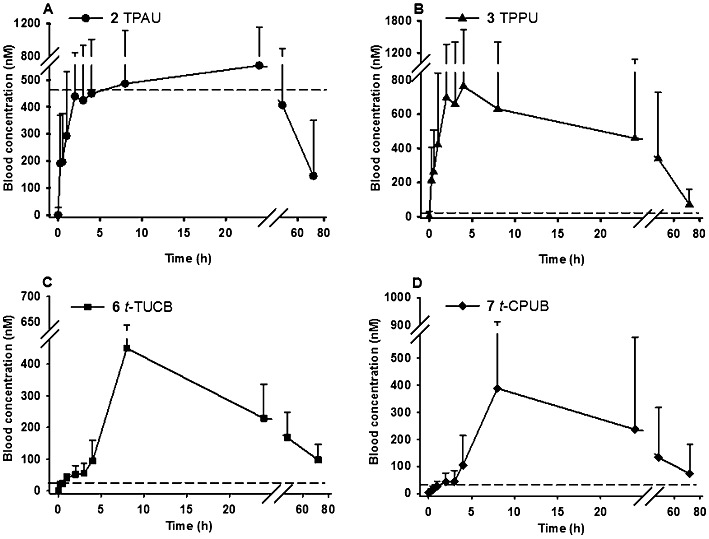
Blood concentration–time course of sEH inhibitors containing 1-N piperidyl urea moiety (A: TPAU and B: TPPU) and 4-(cyclohexyloxy) benzoic acid urea moiety (C: t-TUCB and D: t-CPUB). Blood was collected from tail vein of the four cynomolgus monkeys at time points 0, 0.25, 0.5, 1, 2, 3, 4, 8, 24, 48 and 72 h upon oral cassette dosing at 0.3 mg·kg−1. Each time point represents mean ± SD on all graphs. The dotted line represents the IC50 of each inhibitor in hepatic cytosol of cynomolgus monkeys (Table 2).
Table 3.
PK parameters of sEHIs in cynomolgus monkeys, determined by non-compartmental PK analysis at 0.3 mg·kg−1 in cassette dosing experiments
| AUCa (h.µM) | Cmax (nM) | tmax (h) | r2b | |
|---|---|---|---|---|
| 1 | <1c | 98 ± 18 | 0.25 ± 0.4 | NA |
| 2 | 30 ± 10 | 550 ± 600 | 24 ± 9 | 0.99 |
| 3 | 28 ± 23 | 760 ± 800 | 4 ± 3 | 0.97 |
| 4 | 4 ± 3 | 245 ± 70 | 4 ± 2 | 0.86 |
| 5 | 7 ± 7 | 450 ± 150 | 8 ± 3 | 0.97 |
| 6 | 15 ± 14 | 450 ± 190 | 8 ± 3.5 | 0.97 |
| 7 | 13 ± 18 | 390 ± 500 | 8 ± 3 | 0.99 |
| 8 | 1 ± 0.6 | 49 ± 10 | 8 ± 3.5 | 0.96 |
| 9 | <1c | 165 ± 130 | 0.25 ± 1.5 | NA |
| 10 | <1c | 96 ± 90 | 48 ± 10 | NA |
| 11 | 3 ± 2 | 190 ± 160 | 8 ± 3.5 | 1.00 |
Data shown in the Table are mean ± SD.
AUC was calculated from time 0 to 72 h. NA: not applicable.
The agreement between the non-compartmental analyses and blood concentrations.
These compounds with polyether chains were synthesized as pro-drugs to improve the ease of formulation. Therefore, PK parameters are based on blood levels of the free acid metabolites. No polyether esters were detected in the blood.
AEPU (compound 1 in Table 3) was rapidly metabolized, and its blood concentration was never above its IC50 concentration (Supporting Information Figure S2C). In fact, we obtained higher blood concentrations of the ω-hydroxylated metabolite than of the parent. We found that this metabolite is also slightly active against the cynomolgus sEH (Table 2). However, the metabolite concentrations remained below its IC50 concentration, suggesting that AEPU will not be effective at inhibiting sEH in the monkey unless applied locally or used at much higher doses.
For piperidine containing ureas (compounds 2 to 5 in Table 3), we observed that those with a trifluoromethoxyphenyl moiety on the 1-N urea position (TPAU and TPPU) showed similar PK profiles (Figures 1A and B) with high AUC values and long half-lives compared with a cyclohexyl moiety (compound 4) or a chlorophenyl moiety (compound 5), with the latter having a slightly longer half-life than the cyclohexyl moiety (see Supporting Information Figures S2A and B).
For compounds with a 4-(cyclohexyloxy) benzoic acid group (compounds 6–8 in Table 3), the presence of a 4-trifluoromethoxyphenyl (t-TUCB; Figure 1C) or 4-chlorophenyl (t-CPUB; Figure 1D) group on the 1-N urea position yielded PK profiles with similar high AUC values and long half-life compared with a cyclohexyl moiety (compound 8; Supporting Information Figure S2F). The AUC of 6 and 7 are roughly 10-fold greater than the AUC of compound 8. Compounds 6 and 7 displayed a slow absorption for the first few hours after dosing followed by a rapid increase and then a slow decline in blood concentrations. While their blood concentrations are not as high as the ones obtained with the corresponding piperidine-containing compounds 2 and 3, these 4-(cyclohexyloxy) benzoic acid-containing compounds 6 and 7 are an order of magnitude more potent against the monkey sEH (Table 2), and thus, their blood concentration is well above their IC50s (the dashed line of Figure 1) for the whole observation period of 72 h (Figure 2).
Figure 2.
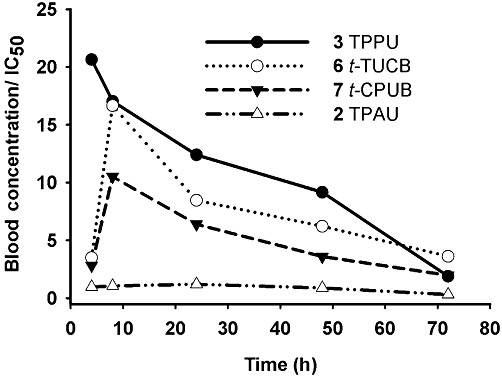
Blood concentrations of TPPU, t-TUCB, t-CPUB and TPAU normalized by their corresponding IC50 values for cynomolgus hepatic cytosol sEH (Table 2) as a function of the time after dosing with 0.3 mg·kg−1. Blood concentration data are from Figure 1.
The polyether esters, that is, compounds 9 and 10 (Table 3), showed PK profiles that are characterized by longer tmax and at least threefold less Cmax values compared with their acid derivatives, t-AUCB and compound 6 respectively. Comparing compound 10 with compound 6, the presence of the polyether ester yielded a longer tmax; however, the concentration of the parent acid ester was far lower than the ones obtained by giving the acid directly.
Finally, TCC was selected for the study due to its structural resemblance to 4-chlorophenyl-urea inhibitors (compounds 5 and 7) and due to its frequent exposure to humans through personal care products, in which it is used as an antimicrobial compound (Heidler et al., 2006). Overall, the presence of a 3,4-dichlorophenyl group instead of a piperidine moiety (compound 5) or 4-(cyclohexyloxy) benzoic acid group (compound 7) resulted in a compound with lower absorption and a smaller exposure (AUC) with an intermediate half-life (Supporting Information Figure S2G). The apparent half-lives of the inhibitors tested and the elimination time range of these half-lives are given in Supporting Information Table S4A.
Comparison of blood concentration and the potency of sEH inhibitors
While we do not know the minimum effective dose of each inhibitor, previous in vivo experiments suggest that blood concentrations in excess of fivefold the IC50 are sufficient to significantly inhibit sEH (Imig et al., 2005). Thus, we expressed blood concentrations as a function of IC50 over time following the administration of the compounds (Figure 2). After a 0.3 mg·kg−1 dosage, the blood concentration of TPPU was at least 10-fold over its IC50 for the first 48 h, while this criterion was met for only 24 h for t-TUCB and t-CPUB. Because of its high IC50 (Table 2), the blood levels of TPAU never reached even fivefold of its IC50. Since both this acetyl piperidine and TPPU shared similar PK and physicochemical properties, we selected these compounds for further analysis.
TPPU dose escalation and target engagement
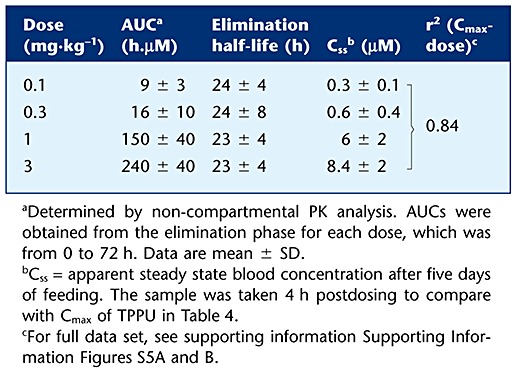
TPPU was administered in three escalating doses at 48 h intervals for the investigation of its dose linearity. The blood concentration–time profile of TPPU after dosing is given in Figure 3A. When the AUCs of each of the four animals receiving TPPU either in cassette or single dosing were compared, there was no difference detected by a t-test (P = 0.9) indicating that cassette dosing indeed predicts the PK profiles of the compounds tested with single compound dosing sufficiently for screening studies (Supporting Information Figure S4). The PK parameters calculated from the data shown in Figure 3A are presented in Table 4. We assessed the AUC and Cmax values to test whether these PK parameters were dose proportional. There was an increase in blood levels reflected by AUC and Cmax with dose from 0.3 to 3 mg·kg−1 oral dose. However, this increase was not absolutely linear (r2= 0.93). A particularly large increase in AUC and Cmax or Css (concentration at steady state with blood sample taken 4 h postdosing) was observed when the dose increased from 0.3 to 1 mg·kg−1 both with TPPU and TPAU (Tables 4 and 5). The elimination half-lives for each increasing dose are given in Supporting Information Table S4B. Similarly, when TPAU was administered in the diet at four different doses (Supporting Information Figure S5A), there was an increase in blood levels reflected by AUC and Css, with doses from 0.1 to 3 mg·kg−1. There was a large increase in blood levels when going from 0.3 to 1 mg·kg−1 per day doses. Again, the relationship between the administered dose and Css was not highly linear (Supporting Information Figure S5B), although the elimination half-life was constant among all four doses studied (Table 5). To test whether the observed AUC values maintained steady state concentrations of the inhibitor, we calculated the ratio of the AUC values from time 0 to 72 h and from time 0 to infinity (AUCt(0–72)/AUCt(0-∞)= 0.9), which reflected a close approximation to the steady-state concentrations for each dose administered.
Figure 3.
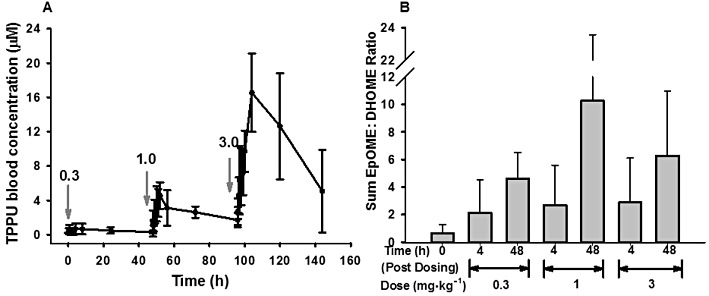
Blood concentration–time course of escalating doses of TPPU and plasma levels of LA epoxide and diols at 4 and 48 h after each dosing. (A) PK profile of TPPU upon consecutive oral dosing at 0.3, 1 and 3 mg·kg−1 with 48 h intervals. The dose was increased threefold at each time of dosing, after the initial dosing with 0.3 mg·kg−1 of TPPU. Blood was collected from animals at time points 0, 0.25, 0.5, 1, 2, 3, 4, 8, 24 and 48 h after each dosing. A single dose of TPPU was administered at each arrow, in 48 h dosing intervals. Each time point represents mean ± SD, n = 4. (B) The total LA (9, 10 and 12, 13 EpOME : DHOME ratios) epoxide to diol ratios, obtained from the plasma of animals, 4 and 48 h postdosing with TPPU. Blood was collected from tail vein at baseline (t = 0), and at 4 and 48 h postdosing for the analysis of oxylipins. Each bar represents mean ± SD. For primary data see Supporting Information Table S5.
Table 4.
The effects of escalating the dose of TPPU on its PK parameters
| Dose (mg·kg−1) | AUCa (h.µM) | Cmax (µM) | tmax (h) | r2 |
|---|---|---|---|---|
| 0.3 | 23 ± 17 | 0.7 ± 0.6 | 4 ± 3 | 0.99 |
| 1 | 120 ± 40 | 4.5 ± 1.5 | 4 ± 0 | 0.99 |
| 3 | 460 ± 260 | 16.5 ± 4.6 | 8 ± 0 | 0.98 |
Determined by non-compartmental PK analysis. AUC was calculated from time 0 to 48 h. Data are mean ± SD.
Table 5.
PK parameters of TPAU elimination after 5 days of daily dosing in the diet of cynomolgus monkeys
 |
To test if sEH was inhibited in vivo by TPPU, we measured the plasma concentration of the epoxides and their corresponding diols from AA and linoleic acid (LA) at 4 and 48 h after each dosage (Supporting Information Table S5A). If sEH is inhibited, one would expect the relative concentration of diols to decrease, and thus the ratio of epoxides to diols to increase. Compared with the ratio before treatment (t = 0), we did not see any significant changes for the cumulative EET : DHET ratios (Supporting Information Figures S6A), but we observed an increase at all the time points and all sEHI doses for the epoxyoctadenenoic acid (EpOME) : dihydroxyoctadecenoic acid (DHOME) ratios (Figure 3B). The absolute plasma levels of EETs and DHETs are given in Supporting Information Figures S6B and C. Consistent with the EET : DHET ratios in Supporting Information Figure S6A, the plasma levels of DHETs decreased at 48 h more than at 4 h after consecutive dosing of TPPU. However, this was not the case for plasma levels for each EET regioisomer. In contrast, the results from the linoleate metabolites EpOME and DHOME, which are present in larger concentrations in plasma (Supporting Information Table S5A), suggest a dose-dependent sEH inhibition in the animals following dosage with TPPU (Supporting Information Figures S6D and E). The EpOME : DHOME ratios (epoxide to diol ratios in the 18:2 fatty acid series) were all higher than in control (untreated) animals for all three doses and for both 4 and 48 h after dosing. However, no significant differences were observed in EpOME : DHOME levels using random effects, repeated measures, two-way anova (main effect of dose; F = 0.68, P > 0.4, main effect of time; F = 3.09, P > 0.1 and main effect of dose and time; F = 0.47, P > 0.5). These ratios at each dose of TPPU were higher at 48 h than at 4 h post-treatment. There is a clear dose response at 0.3 and 1 mg·kg−1 for the 48 h time points, but there is an apparent but not statistically significant decline in the ratio at 48 h for the 3 mg·kg−1 dose, cautioning against an overdose of sEHI. The same trends were observed when ratios were calculated based on the individual regioisomers (Supporting Information Figure S6D).
Although the sum of regioisomers of EET : DHET ratios failed to show a clear dose response or time response (Supporting Information Figure S6), the 8, 9 regioisomer ratios showed a relationship similar to that observed with the linoleate epoxides and diols (Figure 3). The ratio increased at both 4 and 48 h after dosing for 0.3 and 1 mg·kg−1 doses. Although the levels were above control values, the 3 mg·kg−1 dose was lower at both 4 and 48 h than was the 1 mg·kg−1 or 0.3 mg·kg−1 dose.
We also measured some COX and lipoxygenase (LOX) metabolites from arachidonic and linoleic acids (Supporting Information Table S5B and C). Some large changes were observed in the metabolites of the COX, LOX and CYP450 pathways. In particular, the pro-inflammatory COX-2 metabolites PGF2α and PGE2, the CYP450 metabolites 11, 12, 15- trihydroxyeicosatrienoic acid (TriHETrE) and 20-hydroxyeicosatetraenoic acid (HETE), and the pro-inflammatory LOX metabolite 20-carboxy-leukotrieneB4 (20-COOH-LTB4) were decreased. Similar changes were observed previously in rodents treated with sEHI (Schmelzer et al., 2005; Jung et al., 2010). Moreover, plasma concentrations of 20-HETE, the major vasoconstrictor metabolite in the AA cascade, were decreased with increasing doses of TPPU. However, we observed an increase in LOX products of AA, 11-HETE, 12-HETE and 15-HETE. From the LA metabolites, 9, 12, 13-trihydroxyoctadecenoic acid (TriHOME) and 9, 10, 13-TriHOME levels were reduced, whereas 9- and 13-hydroxyoctadecadienoic acid (HODE) levels were increased in plasma (Supporting Information Table S5C).
Discussion
The overall aim of this study was to identify a sEHI with high potency (IC50 in the low nM range), physicochemical properties consistent with drug-likeness, PK properties with relatively rapid absorption, high AUC, long t1/2 that would facilitate long-term interventional studies in NHPs. In addition, we determined the pharmacodynamics of selected sEHI, such as TPPU, by evaluating the effect of escalating doses on the epoxide-to-diol ratio in these animals.
Characterization of the sEH in cynomolgus monkeys
We investigated if the cynomolgus sEH was similar to the human enzyme. Based on the subcellular localization and substrate selectivity (Table 1), as well as the selectivity of the inhibitors (Table 2), the monkey and human sEH activities were very comparable. Thus, the NHP enzyme represented a good model for the inhibition of the human sEH, which is consistent with two closely related primate species. In addition, the hepatic cytosolic fraction is suitable to compare the potency of sEHI for use in cynomolgus monkeys. While the IC50 values differ between the human and cynomolgus sEH (Table 2), similar ranking of the inhibitors was obtained (Spearman's rank correlation coefficient P of 0.82). This indicates that the IC50 data obtained with the sEH from human is generally predictive of the activity on the monkey enzyme, and that both enzymes have similar selectivity. As a cautionary note, the fluorescent assay was recently reported to overestimate the IC50s for some piperidyl ureas compared with those of the inhibitors with 4-(cyclohexyloxy) benzoic acid (Tsai et al., 2010). This discrepancy also was observed for the human sEH (Table 2).
Structure-activity relationships among sEHIs
The 4-(cyclohexyloxy) benzoic acid containing compounds (6–10) are very potent sEHIs when tested with the monkey and human enzyme, and compare favourably with earlier sEHIs. Also, we observed that esters and amides of the urea inhibitors with cyclohexyl ethers are more potent than the free acids (data not shown). Docking experiments into the active site of the human sEH showed that the acid or ester function of 4-(cyclohexyloxy) benzoate-containing compounds make hydrogen bonds with Arg408 possibly contributing to their higher potency (Hwang et al., 2007). Both the cyclohexyl ethers and the piperidine derivatives have a polar group 7–8 Å away from the urea carbonyl, which contributes to water solubility and also to hydrogen bonding in the active site of the sEH. Data on the compounds AEPU, APAU, t-TUCB, and t–AUCB provide bridging data to previous publications (Tsai et al., 2010). With the [3H]-t-DPPO assay and monkey cytosol, the piperidine-containing compounds (APAU and compounds 2–5) varied widely in potency with TPPU (compound 3) being the most potent tested. For the piperidines, we previously observed that small variation in structure results in large changes in potency for the human, murine and canine sEHs. The addition of a methylene to the acyl moiety of APAU dramatically increased its potency on the human and canine enzyme but dramatically reduced its AUC in the dog (Jones et al., 2006; Rose et al., 2010; Tsai et al., 2010). However, when the metabolically labile adamantane moiety is replaced with a more stable group such as the trifluoromethoxyphenyl, one can both increase activity and improve AUC with larger acyl groups. Similarly, the addition of a methyl group in TPPU compared with TPAU resulted in a compound that was 10-fold more potent against the cynomolgus sEH, while retaining high blood levels (Table 2).
PK of sEHIs
The presence of a 4-trifluoromethoxy phenyl group on the 1-N urea position, with either a piperidine derivative or 4-(cyclohexyloxy) benzoic acid yields a higher AUC and a longer elimination half-life (Table 3), which is likely to be due to relatively slower metabolism and/or excretion. Such effects were observed recently in dogs with similar compounds (Tsai et al., 2010). Moreover, the piperidyl ureas have slightly more drug-like properties, as shown by their higher water solubility, lower melting point, moderate log P and lower plasma protein binding (more available free compound to tissues) compared with the 4-(cyclohexyloxy) benzoic acid urea series. The differences in PK among the piperidines did not seem to come from gross differences in their absorption, but was likely to derive from slower metabolism and/or elimination. This translated into a large difference in half-life (Supporting Information Table S4A), which is about three times longer for the trifluoromethoxyphenyl-containing compounds 2 and 3 than for the other two piperidines, as well as larger AUCs (∼5-fold larger). Furthermore, the time at which the elimination became apparent, started earlier for the piperidines (compounds 3–5) in the blood concentration–time course compared with that of 4-(cyclohexyloxy) benzoic acid compounds (compounds 6–8). Although these piperidines maintained longer elimination time range, the early elimination time range suggests faster absorption (Supporting Information Table S4A). As for the escalating doses of TPPU, the time range of elimination shortened, and accordingly the apparent half-life decreased, as if TPPU was eliminated faster (Supporting Information Table S4B). However, as the dose increased, tmax also increased (Table 4), suggesting slower absorption, which indicates delayed elimination phase rather than faster elimination.
Besides these differences, considering the time period that is above the IC50 concentration suggests that TPPU will be more effective for a longer time than TPAU (Figure 2). Effective blood concentration for an extended period is desirable for the planned long-term monkey experiments. The relative advantages of longer half-lives in man must be considered in the context of the targeted indication and safety profile of the sEHI.
The 4-chlorophenyl derivatives resulted in long t1/2 and AUC, but only in the 4-(cyclohexyloxy) benzoic acid series (t-CPUB, compound 7) (Supporting Information Table S4A). In addition, this modification can decrease the cost of synthesis compared with the trifluoromethoxyphenyl group and allow for less expensive drug candidates in the future. In an effort to simplify formulation and possibly reduce Cmax while retaining a large AUC of 4-(cyclohexyloxy) benzoic acid-containing compounds, we tested the effect of polyether esters on the PK profile (compounds 9 and 10 in Table 3). However, these compounds are quickly metabolized to their corresponding acid derivatives due to esterases and thus the presence of polyether ester did not improve PK.
Target engagement and dose linearity
TPPU demonstrated a dose-dependent increase in sEH inhibition in the ratio of linoleate epoxides to diols following oral dosage (Figure 3), although this change was only moderately dose linear. Similarly, excellent dose linearity in the 4-(cyclohexyloxy) benzoic acid series (t-AUCB) was shown in mice (Liu et al., 2009) and dogs (Tsai et al., 2010). Our results on the EET : DHET ratios are consistent with previous reports (Schmelzer et al., 2005; Inceoglu et al., 2006), showing that these ratios correlate well with doses in rodents with inflammation and, often, sEHI treatment results in little change in eicosanoids in non-inflamed animals. The lack of significant changes in the AA metabolites are probably due to their relatively low concentrations in plasma (Supporting Information Table S5A, Supporting Information Figure S6B and C), high variation among the animals and the alternate pathways for EET and DHET metabolism, particularly the rapid incorporation of EETs into the phospholipids. When administered in the diet, TPAU showed almost identical elimination half-lives at each of four doses (Table 5), also indicating that this compound is suitable for long-term studies. The data in Figures 1 and 3A indicate that some of the compounds have a long β elimination phase. For example, Figure 3A demonstrates that for TPPU (compound 2), a washout period significantly greater than 48 h in single multiple dosing studies are needed. Since the experiment was just to estimate AUCs and the dose was escalated, previous doses had little influence on the data from subsequent doses that were three times higher. In longer term studies, animals should be monitored for drug accumulation, although we did not observe any toxicity in our current studies.
Conclusions
The cynomolgus monkey is commonly used as a model for humans in therapies for atherosclerosis. Also, the gastrointestinal transit time in cynomolgus monkeys is similar to humans (Kondo et al., 2003), which helps making reliable predictions for oral dosage in human. The compounds selected as most appropriate for the atherosclerosis study in NHP may not be optimum for humans in part because extrapolation of doses to humans is never clear. Also, the long half-life that is preferred in this study in NHP may not be desirable for a first in class compound for humans.
In conclusion, we found four sEHIs [TPAU (compound 2), TPPU (compound 3), t-TUCB (compound 6) and t-CPUB (compound 7)] that were promising for long-term studies in NHP. Among these compounds, TPPU showed PK with high AUC and longer elimination half-life, high potency, drug-likeness, lower plasma protein binding and good target engagement based on epoxide-to-diol ratios in the linoleate series in NHPs. The other three compounds were good alternatives to TPPU for PK and potency, while providing structural diversity. In addition, these compounds were easy to formulate in a triglyceride solution for administration by gavage or for incorporation into the diet. Based on this study, further studies are underway using TPPU as a model compound to evaluate the role of EETs in a primate model of atherosclerosis.
Acknowledgments
This work was supported by NIEHS grant R01 ES002710, the National Institute of Environmental Health Sciences Superfund Basic Research Program, P42 ES004699, by the grant R24 RR022191 from the National Center for Research Resources (Kaplan, JR, Appt, SE); Grant R01 AG027847 from the National Institute on Aging (Kaplan JR, Appt, SE). We would like to acknowledge Christina Kennedy and Margaret May for their technical contributions as they performed all the time sampling. BDH is a George and Judy Marcus senior fellow of the American Asthma Foundation. PDJ was supported by an NIH/ NHLBI Ruth L. Kirchstein NRSA Grant (F32 HL078096).
Glossary
- 20-COOH-LTB4
20-carboxy-leukotrieneB4
- AEPU
1-adamantanyl-3-{5-[2-(2-ethoxyethoxy) ethoxy]pentyl}urea
- APAU
1-(1-acetypiperidin-4-yl)-3-adamantanylurea
- CMNPC
cyano(2-methoxynaphthalen-6-yl)methyl (3-phenyloxiran-2-yl)methyl carbonate
- t-DPPO
trans-diphenyl propene oxide
- EET
epoxyeicosatrienoic acid
- DHET
dihydroxyeicosatrienoic acid
- HETE
hydroxyeicosatetraenoic acid
- HODE
hydroxyoctadecadienoic acid
- LC/MS
liquid chromatography mass spectrometry
- t-AUCB
trans-4-[4-(3-adamantan-1-yl-ureido)-cyclohexyloxy]-benzoic acid
- TCC
3,4,4′-trichlorocarbanilide
- t-CPUB
trans-4-{4-[3–4-chloro-phenyl)-ureido]-cyclohexyl}-benzoic acid
- TPAU
1-trifluoromethoxyphenyl-3-(1-acetylpiperidin-4-yl) urea
- TPPU
1-trifluoromethoxyphenyl-3-(1-propionylpiperidin-4-yl) urea: TriHETrE, trihydroxyeicosatrienoic acid
- TriHOME
trihydroxyoctadecenoic acid
- t-TUCB
trans-4-{4-[3-(4-trifluoromethoxy-phenyl)-ureido]-cyclohexyloxy}-benzoic acid
- TXB2
thromboxane B2 : c-SO, cis-stilbene oxide
- t-SO
trans-stilbene oxide
Conflict of interest
The University of California has filed patents in the area of sEHIs for the treatment of several diseases.
Supporting information
Additional Supporting Information may be found in the online version of this article:
Figure S1 (A) Chemical structures of sEHsubstrates used in the sEH activity assays and their Km values for human sEH are shown. (B) The structures of the surrogate and additional internal standards that were used to quantify the sEHIs in blood by LC/MS. (C) Schematic structures of cyclohexyl ether and piperidyl urea inhibitors examined in this study are shown.
Figure S2 Blood concentration–time courseof sEHIs tested with oral cassette dosing, which did not fit our PKcriteria. Data are mean ± SD.
Figure S3 Comparison of the concentrations of the selected sEHIs in whole blood and plasma in cynomolgus monkeys.
Figure S4 Comparison of the bloodconcentration–time courses of TPPU when administered orallyat 0.3 mg·kg−1, via cassette versus singledosing is given. Data are mean ± SD, n = 4 for each experiment.
Figure S5 Blood concentration–time courseof TPAU in cynomolgus monkeys after 5 days of feeding at 0.1, 0.3,1 and 3 mg·kg−1 dose, n = 4/dose,data are mean ± SD.
Figure S6 (A) Plasma EET : DHET ratios ofindividual regioisomers 4 and 48 h postdosing with TPPU atconsecutive 0.3, 1 and 3 mg·kg−1 doses. (A)arachidonic acid EET : DHET ratio for each regioisomer (8, 9; 11,12; and 14,15-EET : DHET ratios), (B) absolute plasma levels ofeach regioisomer of EETs and (C) absolute plasma levels of eachregioisomers of DHETs. (D) linoleic acid EpOME : DHOME ratios and(E) absolute plasma levels of the epoxides and diols. Data are mean± SD.
Figure S7 Time course of plasma protein binding of TPPU in cynomolgus plasma.
Table S1 HPLC solvent gradient to separate sEHIs
Table S2 Optimum tandem mass conditions and key fragmentation of the sEHIs
Table S3 Physicochemical properties of compounds tested in monkeys
Table S4 (A) Half-life of the sEH inhibitorscalculated from blood concentration–time course. (B)Half-life of the sEH inhibitors obtained from the dose-escalationexperiment
Table S5 (A) Effects of escalating doses of TPPU on plasma concentrations of epoxides and diols of arachidonic and linoleic acids. (B) Effects of escalating doses of TPPU on plasma concentrations of arachidonic acid metabolites. (C) Effects of escalating doses of TPPU on plasma concentrations of linoleic acid metabolites
Please note: Wiley-Blackwell are not responsible for the content or functionality of any supporting materials supplied by the authors. Any queries (other than missing material) should be directed to the corresponding author for the article.
References
- Borhan B, Mebrahtu T, Nazarian S, Kurth MJ, Hammock BD. Improved radiolabeled substrates for soluble epoxide hydrolase. Anal Biochem. 1995;231:188–200. doi: 10.1006/abio.1995.1520. [DOI] [PubMed] [Google Scholar]
- Chiamvimonvat N, Ho CM, Tsai HJ, Hammock BD. The soluble epoxide hydrolase as a pharmaceutical target for hypertension. J Cardiovasc Pharmacol. 2007;50:225–237. doi: 10.1097/FJC.0b013e3181506445. [DOI] [PubMed] [Google Scholar]
- Clarkson TB, Mehaffey MH. Coronary heart disease of females: lessons learned from nonhuman primates. Am J Primatol. 2009;71:785–793. doi: 10.1002/ajp.20693. [DOI] [PubMed] [Google Scholar]
- Dorrance AM, Rupp N, Pollock DM, Newman JW, Hammock BD, Imig JD. An epoxide hydrolase inhibitor, 12-(3-adamantan-1-yl-ureido)dodecanoic acid (AUDA), reduces ischemic cerebral infarct size in stroke-prone spontaneously hypertensive rats. J Cardiovasc Pharmacol. 2005;46:842–848. doi: 10.1097/01.fjc.0000189600.74157.6d. [DOI] [PMC free article] [PubMed] [Google Scholar]
- Fang X. Soluble epoxide hydrolase: a novel target for the treatment of hypertension. Recent Pat Cardiovasc Drug Discov. 2006;1:67–72. doi: 10.2174/157489006775244227. [DOI] [PubMed] [Google Scholar]
- Fang X, Kaduce TL, Weintraub NL, Harmon S, Teesch LM, Morisseau C, et al. Pathways of epoxyeicosatrienoic acid metabolism in endothelial cells. Implications for the vascular effects of soluble epoxide hydrolase inhibition. J Biol Chem. 2001;276:14867–14874. doi: 10.1074/jbc.M011761200. [DOI] [PubMed] [Google Scholar]
- Gill SS, Ota K, Hammock BD. Radiometric assays for mammalian epoxide hydrolases and glutathione S-transferase. Anal Biochem. 1983;131:273–282. doi: 10.1016/0003-2697(83)90166-5. [DOI] [PubMed] [Google Scholar]
- Hammock BD, Loury DN, Moody DE, Ruebner B, Baselt R, Milam KM, et al. A methodology for the analysis of the preneoplastic antigen. Carcinogenesis. 1984;5:1467–1473. doi: 10.1093/carcin/5.11.1467. [DOI] [PubMed] [Google Scholar]
- Fleming I. Epoxyeicosatrienoic acids, cell signaling and angiogenesis. Prostaglandins Other Lipid Mediat. 2007;82:60–67. doi: 10.1016/j.prostaglandins.2006.05.003. [DOI] [PubMed] [Google Scholar]
- Heidler J, Sapkota A, Halden RU. Partitioning, persistence, and accumulation in digested sludge of the topical antiseptic triclocarban during wastewater treatment. Environ Sci Technol. 2006;40:3634–3639. doi: 10.1021/es052245n. [DOI] [PMC free article] [PubMed] [Google Scholar]
- Hwang SH, Tsai HJ, Liu JY, Morisseau C, Hammock BD. Orally bioavailable potent soluble epoxide hydrolase inhibitors. J Med Chem. 2007;50:3825–3840. doi: 10.1021/jm070270t. [DOI] [PMC free article] [PubMed] [Google Scholar]
- Imig JD, Hammock BD. Soluble epoxide hydrolase as a therapeutic target for cardiovascular diseases. Nat Rev Drug Discov. 2009;8:794–805. doi: 10.1038/nrd2875. [DOI] [PMC free article] [PubMed] [Google Scholar]
- Imig JD, Zhao X, Zaharis CZ, Olearczyk JJ, Pollock DM, Newman JW, et al. An orally active epoxide hydrolase inhibitor lowers blood pressure and provides renal protection in salt-sensitive hypertension. Hypertension. 2005;46:975–981. doi: 10.1161/01.HYP.0000176237.74820.75. [DOI] [PMC free article] [PubMed] [Google Scholar]
- Inceoglu B, Jinks SL, Schmelzer KR, Waite T, Kim IH, Hammock BD. Inhibition of soluble epoxide hydrolase reduces LPS-induced thermal hyperalgesia and mechanical allodynia in a rat model of inflammatory pain. Life Sci. 2006;79:2311–2319. doi: 10.1016/j.lfs.2006.07.031. [DOI] [PMC free article] [PubMed] [Google Scholar]
- Jones PD, Wolf NM, Morisseau C, Whetstone P, Hock B, Hammock BD. Fluorescent substrates for soluble epoxide hydrolase and application to inhibition studies. Anal Biochem. 2005;343:66–75. doi: 10.1016/j.ab.2005.03.041. [DOI] [PMC free article] [PubMed] [Google Scholar]
- Jones PD, Tsai HJ, Do ZN, Morisseau C, Hammock BD. Synthesis and SAR of conformationally restricted inhibitors of soluble epoxide hydrolase. Bioorg Med Chem Lett. 2006;16:5212–5216. doi: 10.1016/j.bmcl.2006.07.009. [DOI] [PMC free article] [PubMed] [Google Scholar]
- Jung O, Jansen F, Mieth A, Barbosa-Sicard E, Pliquett RU, Babelova A, et al. Inhibition of the soluble epoxide hydrolase promotes albuminuria in mice with progressive renal disease. PLoS ONE. 2010;5:e11979. doi: 10.1371/journal.pone.0011979. [DOI] [PMC free article] [PubMed] [Google Scholar]
- Kim IH, Morisseau C, Watanabe T, Hammock BD. Design, synthesis, and biological activity of 1,3-disubstituted ureas as potent inhibitors of the soluble epoxide hydrolase of increased water solubility. J Med Chem. 2004;47:2110–2122. doi: 10.1021/jm030514j. [DOI] [PubMed] [Google Scholar]
- Kim IH, Tsai HJ, Nishi K, Kasagami T, Morisseau C, Hammock BD. 1,3-disubstituted ureas functionalized with ether groups are potent inhibitors of the soluble epoxide hydrolase with improved pharmacokinetic properties. J Med Chem. 2007;50:5217–5226. doi: 10.1021/jm070705c. [DOI] [PMC free article] [PubMed] [Google Scholar]
- Kondo H, Watanabe T, Yokohama S, Watanabe J. Effect of food on gastrointestinal transit of liquids in cynomolgus monkeys. Biopharm Drug Dispos. 2003;24:141–151. doi: 10.1002/bdd.349. [DOI] [PubMed] [Google Scholar]
- Liu JY, Tsai HJ, Hwang SH, Jones PD, Morisseau C, Hammock BD. Pharmacokinetic optimization of four soluble epoxide hydrolase inhibitors for use in a murine model of inflammation. Br J Pharmacol. 2009;156:284–296. doi: 10.1111/j.1476-5381.2008.00009.x. [DOI] [PMC free article] [PubMed] [Google Scholar]
- Morisseau C, Hammock BD. Measurement of soluble epoxide hydrolase (sEH) activity. Curr Protocol Toxicol. 2007;33:1–18. doi: 10.1002/0471140856.tx0423s33. [DOI] [PubMed] [Google Scholar]
- Morisseau C, Goodrow MH, Dowdy D, Zheng J, Greene JF, Sanborn JR, et al. Potent urea and carbamate inhibitors of soluble epoxide hydrolases. Proc Natl Acad Sci U S A. 1999;96:8849–8854. doi: 10.1073/pnas.96.16.8849. [DOI] [PMC free article] [PubMed] [Google Scholar]
- Newman JW, Morisseau C, Hammock BD. Epoxide hydrolases: their roles and interactions with lipid metabolism. Prog Lipid Res. 2005;44:1–51. doi: 10.1016/j.plipres.2004.10.001. [DOI] [PubMed] [Google Scholar]
- Node K, Huo Y, Ruan X, Yang B, Spiecker M, Ley K, et al. Anti-inflammatory properties of cytochrome P450 epoxygenase-derived eicosanoids. Science. 1999;285:1276–1279. doi: 10.1126/science.285.5431.1276. [DOI] [PMC free article] [PubMed] [Google Scholar]
- Pfister SL, Falck JR, Campbell WB. Enhanced synthesis of epoxyeicosatrienoic acids by cholesterol-fed rabbit aorta. Am J Physiol. 1991;261(3 Pt 2):H843–H852. doi: 10.1152/ajpheart.1991.261.3.H843. [DOI] [PubMed] [Google Scholar]
- Register TC. Primate models in women's health: inflammation and atherogenesis in female cynomolgus macaques (Macaca fascicularis. Am J Primatol. 2009;71:766–775. doi: 10.1002/ajp.20722. [DOI] [PMC free article] [PubMed] [Google Scholar]
- Rose TE, Morisseau C, Liu JY, Inceoglu B, Jones PD, Sanborn JR, et al. 1-Aryl-3-(1-acylpiperidin-4-yl)urea inhibitors of human and murine soluble epoxide hydrolase: structure-activity relationships, pharmacokinetics, and reduction of inflammatory pain. J Med Chem. 2010;53:7067–7075. doi: 10.1021/jm100691c. [DOI] [PMC free article] [PubMed] [Google Scholar]
- Schmelzer KR, Kubala L, Newman JW, Kim IH, Eiserich JP, Hammock BD. Soluble epoxide hydrolase is a therapeutic target for acute inflammation. Proc Natl Acad Sci U S A. 2005;102:9772–9777. doi: 10.1073/pnas.0503279102. [DOI] [PMC free article] [PubMed] [Google Scholar]
- Tsai HJ, Hwang SH, Morisseau C, Yang J, Jones PD, Kasagami T, et al. Pharmacokinetic screening of soluble epoxide hydrolase inhibitors in dogs. Eur J Pharm Sci. 2010a;40:222–238. doi: 10.1016/j.ejps.2010.03.018. [DOI] [PMC free article] [PubMed] [Google Scholar]
- Ulu A, Davis BB, Tsai HJ, Kim IH, Morisseau C, Inceoglu B, et al. Soluble epoxide hydrolase inhibitors reduce the development of atherosclerosis in apolipoprotein e-knockout mouse model. J Cardiovasc Pharmacol. 2008;52:314–323. doi: 10.1097/FJC.0b013e318185fa3c. [DOI] [PMC free article] [PubMed] [Google Scholar]
- Watanabe T, Schulz D, Morisseau C, Hammock BD. High-throughput pharmacokinetic method: cassette dosing in mice associated with minuscule serial bleedings and LC/MS/MS analysis. Anal Chim Acta. 2006;559:37–44. doi: 10.1016/j.aca.2005.11.049. [DOI] [PMC free article] [PubMed] [Google Scholar]
- Yang J, Schmelzer K, Georgi K, Hammock BD. Quantitative profiling method for oxylipin metabolome by liquid chromatography electrospray ionization tandem mass spectrometry. Anal Chem. 2009;81:8085–8093. doi: 10.1021/ac901282n. [DOI] [PMC free article] [PubMed] [Google Scholar]
- Zhang LN, Vincelette J, Cheng Y, Mehra U, Chen D, Anandan SK, et al. Inhibition of soluble epoxide hydrolase attenuated atherosclerosis, abdominal aortic aneurysm formation, and dyslipidemia. Arterioscler Thromb Vasc Biol. 2009;29:1265–1270. doi: 10.1161/ATVBAHA.109.186064. [DOI] [PubMed] [Google Scholar]
Associated Data
This section collects any data citations, data availability statements, or supplementary materials included in this article.