

Abstract
Transcriptional profiling (TP) offers a powerful approach to identify genes activated during memory formation and, by inference, the molecular pathways involved. Trace eyeblink conditioning is well suited for the study of regional gene expression because it requires the hippocampus, whereas the highly parallel task, delay conditioning, does not. First, we determined when gene expression was most regulated during trace conditioning. Rats were exposed to 200 trials per day of paired and unpaired stimuli each day for 4 days. Changes in gene expression were most apparent 24 h after exposure to 200 trials. Therefore, we profiled gene expression in the hippocampus 24 h after 200 trials of trace eyeblink conditioning, on multiple arrays using additional animals. Of 1,186 genes on the filter array, seven genes met the statistical criteria and were also validated by real-time polymerase chain reaction. These genes were growth hormone (GH), c-kit receptor tyrosine kinase (c-kit), glutamate receptor, metabotropic 5 (mGluR5), nerve growth factor-β (NGF-β), Jun oncogene (c-Jun), transmembrane receptor Unc5H1 (UNC5H1), and transmembrane receptor Unc5H2 (UNC5H2). All these genes, except for GH, were downregulated in response to trace conditioning. GH was upregulated; therefore, we also validated the downregulation of the GH inhibitor, somatostatin (SST), even though it just failed to meet criteria on the arrays. By during situ hybridization, GH was expressed throughout the cell layers of the hippocampus in response to trace conditioning. None of the genes regulated in trace eyeblink conditioning were similarly affected by delay conditioning, a task that does not require the hippocampus. These findings demonstrate that transcriptional profiling can exhibit a repertoire of genes sensitive to the formation of hippocampal-dependent associative memories.
Keywords: eyeblink conditioning, delay conditioning, gene expression, cDNA array, growth hormone
Introduction
The synthesis of proteins from transcriptionally regulated genes is required for the long-term storage of memory (Davis and Squire, 1984; Barzilai et al., 1989). Gene expression may also be involved in the learning process itself, as suggested by the use of protein synthesis inhibitors in spatial navigation (Cavallaro et al., 1997; Guzowski and McGaugh, 1997), avoidance (Cammarota et al., 2000), contextual fear conditioning (Impey et al., 1998), and brightness discrimination (Tischmeyer et al., 1990). Despite the evidence for transcriptional activation during training on several different learning tasks, identifying those genes that are critical for learning has proved challenging. Nevertheless, genes have been identified that serve some aspects of memory formation. Using tractable systems such as Drosophila and Aplysia, genes involved in cAMP signaling (Dash et al., 1990; Bourtchouladze et al., 1998), a receptor tyrosine kinase (Dura et al., 1993, 1995), an integrin (Grotewiel et al., 1998), and ubiquitin C-terminal hydrolase (Hegde et al., 1997) have been associated with learning. With the advent of germline gene ablation or overexpression in mice, the list of genes implicated in learning and memory has grown to include CREB, Ca2+/calmodulin-dependent protein kinase II (CaM kinase II) (Silva et al., 1992), fyn (Grant et al., 1992), protein kinase A (PKA) (Abel et al., 1997), NMDAR2B (Tang and Sim, 1997), ryanodine receptor type 3 (Futatsugi et al., 1999), calcineurin (Mansuy et al., 1998; Winder et al., 1998), the transcription factor neuronal PAS domain protein 2 (Garcia et al., 2000), protein tyrosine phosphatase γ (Uetani et al., 2000), tissue plasminogen activator (TPA) (Madani et al., 1999), and c-kit receptor tyrosine kinase (c-kit), the receptor for the steel ligand (Motro et al., 1996; Katafuchi et al., 2000).
Although informative, these findings have shortcomings. Most importantly, manipulating one gene at a time fails to address the likelihood that multiple genes, each with a defined temporal profile of either activation or suppression, contribute to task acquisition. Furthermore, gene disruption experiments will not determine which genes are downregulated during learning. Moreover, information derived from mutant or ablated genes may be confounded by the disruption of developmental processes that indirectly impair performance. These difficulties are only partially mitigated by approaches that use conditional knockouts and regulated gene expression.
Transcriptional profiling (TP) is a procedure that uses arrays on which identified gene sequences are spotted to assay expression in samples of mRNA. Among its advantages, gene arrays are relatively unbiased in that many genes can be assayed simultaneously without a priori knowledge of their function. In the present study, we applied TP to the question of gene expression in learning. We selected classical eyeblink conditioning as especially well suited for analysis by TP because one can directly compare the effects of associative conditioning, in which two stimuli are paired in time, with those of pseudo-conditioning, in which the two stimuli are explicitly unpaired. Thus, both groups of animals are exposed to the same number and types of stimuli, but only one group has learned a positive association between the stimuli. We chose to evaluate two types of classical conditioning: delay and trace. During eyeblink conditioning, the animal learns that an auditory stimulus that serves as the conditioned stimulus (CS) predicts the occurrence of a periorbital shock to the eyelid. Eventually, the animal blinks in anticipation of the unconditioned stimulus (US) and elicits a conditioned response (CR). In trace conditioning, a time interval separates the CS and US, and acquisition of the task is dependent on an intact hippocampal formation (Solomon et al., 1986; Moyer et al., 1990; Clark and Zola, 1998; McEchron et al., 1998; Weiss et al., 1999; Beylin et al., 2001). In delay conditioning, CS and US overlap and the task is not dependent on the hippocampus (Schmaltz and Theios, 1972; McCormick et al., 1982).
In addition to suitable controls, eyeblink conditioning is useful for correlating gene expression with performance during specific stages of acquisition. We used transcriptional profiling first to determine changes in gene expression within the hippocampus after differing numbers of trials of trace eyeblink conditioning. We found gene expression changes to be most robust after 200 trials of training. Focusing on this initial interval of 200 trials, we increased the number of profiles performed and validated significant changes in gene expression by real-time polymerase chain reaction (PCR) to identify genes that were consistently affected by trace conditioning but that were not affected by delay conditioning.
Materials and Methods
Subjects and Surgical Procedures
Adult male Sprague-Dawley rats weighing 290–310 g were housed individually to prevent damage to the headstage. Rats were given unlimited access to laboratory chow and water and were maintained on a 14:10 light/dark cycle (lights on at 7:00 AM). On the day of surgery, rats were anesthetized with 50 mg/kg of Nembutal. Four electrodes (insulated silver wire; 0.05-inch diameter) were implanted through the ridge of the eyelid and deinsulated at the tips. Two electrodes were used to deliver the periorbital shock, a 0.7-mA shock to the eyelid, and two were used to detect eyeblinks via changes in electromyographic (EMG) activity in the orbicularis oculi. The electrodes were attached to gold amphenol pins; a strip connector headstage was then mounted to the head with acrylic. Rats were kept warm until recovery from anesthesia and were administered 0.3 ml of penicillin (250,000 U/ml) (Apothecon) intramuscularly. Rats were provided with acetaminophen (32 mg/ml) diluted 1:100 in drinking water for 24 h after surgery.
Acclimation Procedures
Rats were left undisturbed in their home cage for 5–7 days of recovery and then taken directly into the conditioning environment, which consisted of eight conditioning boxes in sound-attenuating chambers. Within the chamber was a lighted Skinner box with dark metal walls and floor grids (unconnected to shock) in which the rat was trained. The headstage of each rat was connected to a coiled cable that allowed free movement within the conditioning chamber for a time period equal to 100 paired trials (see below), except that no stimuli were presented. Rats were then taken back to their home cage.
Twenty-four hours later, rats were taken directly to the environment in which they had been acclimated. Spontaneous blink rate was recorded during a period of time equal to that recorded during 30 paired trials without the presentation of stimuli. As before, the number of blinks during the time period in which a CR would have been recorded (see below) was counted. To assess whether an animal would respond with a blink response to the CS alone before presentation of paired or unpaired stimuli, rats were exposed to 10 presentations of a white noise stimulus (320 ms, 83 dB, Intertrial Interval (ITI): 20 ± 10 s). An eyeblink during the first 100 ms of the white noise stimulus was considered a sensitized response to the CS. This procedure is used to detect nonassociative eyeblink responses to the white noise stimulus before training.
Classical Eyeblink Conditioning
Groups of rats were exposed to 200 trials per day for 1, 2, 3, or 4 days, for a total of 200, 400, 600, or 800 trials. The rats were trained with either a delay paradigm in which an 850-ms, 82-dB burst of white noise (CS) overlapped and co-terminated with a 100-ms, 0.7-mA periorbital shock (US), or a trace paradigm in which a 250-ms CS was separated from a 100-ms US by a 500-ms trace interval. For both paradigms, the interstimulus interval (ISI) was 750 ms and the intertrial interval was 20 ± 10 s. Every 10 trials consisted of a sequence of one CS-alone trial, four paired trials, a US-alone trial, and four paired trials. During unpaired training, rats received the same number of CS and US exposures, but in an explicitly unpaired manner. Two subsets of rats were anesthetized with nembutal (50 mg/kg) and decapitated immediately after exposure to 200 trials of paired or unpaired stimuli. The brain was removed, and the hippocampus was dissected. Tissue was kept on dry ice and stored at − 80°C. All other groups of rats were returned to their home cage; 24 h later, they were anesthetized and brains were prepared as described.
Eyeblink Detection and Analysis
EMG activity was filtered to pass 0.3–1.0 kHz and amplified (10 K) with a differential AC amplifier, and passed to a 16-bit A/D card (Keithley-Metrabyte). Eyelid EMG responses were scored as eye-blinks if they exceeded the maximum EMG value of the pre-CS baseline response, plus four times the standard deviation. Eye-blinks were considered CRs when they occurred 500 ms before US onset on paired trials and for an additional 250 ms on CS alone trials. For unpaired trials, eyeblinks during the 500 ms before the US were considered responses. By examining responses after the offset of the CS (>250 ms after CS onset), we avoid counting α responses as CRs as well as short latency CRs, which are considered nonadaptive during trace conditioning in the rabbit (Solomon et al., 1986).
RNA Isolation and Probe Preparation
Hippocampal tissue was collected either immediately after 200 (T200i) and 800 (T800i) trials or 24 h after 200 (T200), 400 (T400), 600 (T600), and 800 (T800) trials (Fig. 1). Total RNA was isolated from frozen hippocampal tissue with TRI reagent (Sigma, catalogue no. T9424) and radiolabeled cDNA probes were prepared according to the manufacturer specifications. Briefly, cDNA probes were synthesized from 2 μg of total RNA from each sample in the presence of 35 μCi of 33P dATP (NEN), using a primer mix supplied by Clontech. The primer mix consists of primers specific to the genes spotted on the array. Probes were then hybridized to matched Clontech, Atlas Rat 1.2 filter sets using ExpressHyb (Clontech). Matched filter sets are composed of four filter arrays from the same lot that were spotted at the same time. The filters were then washed and exposed to PhosphorImager screens for 3–5 days.
Figure 1.
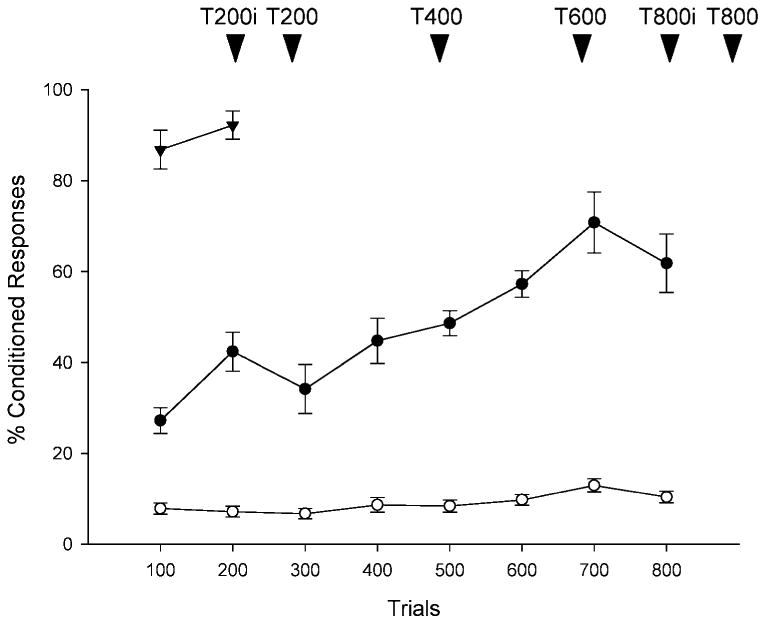
Acquisition of the classically conditioned eyeblink response. Graphic representation of the percentage of conditioned responses (CRs) that occurred during classical conditioning. Symbols designate groups of rats that were exposed to trace conditioning (●), unpaired stimuli (O), and delay conditioning (▾). Arrowheads indicate the number of trials (T) after which animals were sacrificed. Lowercase i denotes that sacrifice occurred immediately after training; its absence means that 24 h intervened. The number of animals used for each interval is as follows: for trace conditioning, T200i [n = 3, CRs = 65 ± 3.8], T200 [n = 5, CRs = 46.6 ± 7.1], T400 [n = 3], T600 [n = 3], T800i [n = 3, CRs = 69 ± 7.6], and T800 [n = 2, CRs = 56 ± 1.6]; for unpaired stimuli, T200i [n = 3, CRs = 5.3 ± 1.9], T200 [n = 4, CRs = 8.4 ± 2.9], T400 [n = 3], T600 [n = 3], T800i [n = 2, CRs = 12.5 ± 0.5], andT800 [n = 3, CRs = 9.0 ± 1.7]; and for delay conditioning, T200 [n = 5, CRs = 92.2 ± 3.1]. These group mean CRs are different from those depicted from the graph, since they represent on conditioning only in groups that were sacrificed at a specific time point after a specific number of trials.
cDNA Array Quantitation
The AtlasImage version 1.01 software package from Clontech was used to quantitate the expression level of 1,186 well-characterized genes on the cDNA filter arrays. Raw intensity data for each spot on the array were measured as the average intensity of the pixels within the spot. Background values were subtracted from each signal and filters were normalized to one another based on the sum of total signal detected on individual filters within a matched set. The background was determined from a measure of the median intensity values from the blank regions of the filter between the grids of arrayed genes. Plasmid and bacteriophage DNAs served as negative controls to confirm hybridization specificity. Pilot data sets were collected from a minimum of two animals after the numbers of trials described above. Data from each of five animals exposed to 200 trials of trace, delay, or four animals exposed to unpaired conditioning were collected for expanded analysis of the T200 interval. In all cases, experimental animals (trace and delay) were compared with their respective unpaired controls within a matched filter set. Relative expression levels were normalized to total signal on each array and averaged normalized intensity values (± SEM) for each gene were computed for the trace and unpaired conditioned animals at each time interval. If the expression level of a gene was below an experimentally determined threshold (see below), the value was set to zero. The ratio (fold-change) between the two conditions was then computed using the averaged intensity obtained from animals exposed to trace conditioning versus unpaired stimuli. For the comparison of five paired and four unpaired animals analyzed after 200 trials, a one-tailed Student's t-test was run to determine a P-value between the trace and pseudo conditioned animals. This analysis was chosen because a test for normal distribution showed that in most cases the data did not fit a normal curve. This is likely the result of setting all intensity values to zero when the values fell below the intensity threshold of 1,400. The error in gene expression data was not attributable to any specific animal or individual array, the variability we observed in the data is likely the result of variability in the performance of individual animals.
Real-Time PCR Quantification
Equal quantities of total RNA from the same samples used for the cDNA array analysis were pooled for each category of training (trace, unpaired, and delay conditioning). First-strand cDNA was synthesized from 50 ng of pooled total RNA in a reaction containing 1.3 μl of random hexamer (Promega, Madison, WI), 0.2 mM of each dNTP, 50 mM Tris, pH 8.3, 40 mM KCl, 6 mM MgCl2, 10 U of RNase inhibitor (Promega), and 10 U of avian myeloblastosis virus-RT (Promega) in a final volume of 20 μl. Total RNA and random hexamers were heated to 80°C for 5 min and snap-cooled on ice. Reaction components were added and allowed to proceed at 37°C for 1 h, followed by heat inactivation for 5 min at 75°C.
Real-time PCR was performed in the PE Biosystems Gene Amp 7700 sequence detection system (PE Applied Biosystems, Foster City, CA), using 1 μl of cDNA and the SYBR green PCR Core Reagents, as recommended by the manufacturer. Individual primer pairs were tested at concentrations of 50, 250, and 500 nM to optimize reactions and to ensure that no primer dimer formation occurred within the number of cycles required for quantification of cDNA levels. In addition, two different concentrations of input total RNA for the cDNA synthesis were used to ensure that the reactions were linear. Primers directed toward a strongly expressed mRNA (growth hormone [GH]) and a weakly expressed mRNA (c-Kit) returned the same ratio of trace conditioned to unpaired stimuli for both concentrations of starting mRNA (data not shown).
Data from the real-time PCR reactions were analyzed using the PE Biosystems GeneAmp 7700 sequence detection software. The data were plotted as ΔRn (fluorescence signal above the baseline and normalized for the internal reference dye ROX) versus cycle number. An arbitrary threshold was set at the midpoint of the log ΔRN versus cycle number plot, such that it was in the linear range for all samples analyzed. The Ct value is defined as the cycle number at which the fluorescence generated within reactions crosses the threshold. PCR reactions for each cDNA were performed simultaneously and normalized to 18S ribosomal RNA. In order to calculate fold change in gene expression a ΔCt value relative to 18S ribosomal RNA was first calculated for each cDNA and primer pair:
| (1) |
A ratio was then calculated as follows:
| (2) |
Reactions were repeated three times on two independently generated cDNA samples.
In Situ Hybridization
Digoxin-labeled RNA probes were transcribed from PCR-amplified templates. cDNAs for use in the PCR reaction were reverse transcribed from rat hippocampal total RNA using SuperScript II RNase H− reverse transcriptase (Gibco-BRL) according to manufacturer specifications. A 711-bp fragment of the presomatotropin cDNA was amplified using a sense primer containing the T7 promoter (GCAACTGCAGATCTAGCACCCTCGAAGCCCAGATTCC) and an antisense primer containing the SP6 promoter (CTAAGCATAGATCTAGAAAGCACAGCTTT CCG). In situ hybridization was done according to Schaeren-Wiemers and Gerfin-Moser (1993) except the hybridization buffer was used according to Ichikawa et al. (1997); 7-μm sections were prepared from frozen right hemispheres on a cryostat, placed directly on a slide, and kept at −80°C until use. Two repetitions of the in situ hybridization on two different trace conditioned and unpaired animals were performed.
Results
There was no difference between groups in spontaneous blink rate (P > 0.05) or sensitization (P > 0.05) before training. On average, rats blinked less than once every 5 s and responded to less than one out of 10 white noise stimuli before training. Groups of rats that were exposed to 200 trials (n = 8), 400 trials (n = 3), 600 trials (n = 3), or 800 trials (n = 5) of trace conditioning emitted more CRs than their respective control groups of unpaired stimuli that had been exposed to 200 trials (n = 8), 400 trials (n = 3), 600 trials (n = 3), or 800 trials (n = 5) of explicitly unpaired stimuli [F(1,36) = 79.15;P< 0.000001]. Analyzed separately, the groups of rats that were exposed to 200 paired trials emitted more CRs than those exposed to 200 trials of unpaired stimuli [(F(2,18) = 151; P < 0.000001]. The group exposed to 200 trials of delay conditioning (n = 5) emitted more CRs than did those exposed to unpaired stimuli (P < 0.0005), and the number of responses increased across trials for those exposed to paired, but not to unpaired, stimuli (P < 0.0002). Groups of rats that were trained for 200 or 800 trials of paired [T200i (n = 3), T200 (n = 5), T800i (n = 3), T800 (n = 2)] or unpaired [T200i (n = 3), T200 (n = 4), T800i (n = 2), T800 (n = 3)] training were sacrificed at the same time either immediately or 24 h later. There was no difference in the number of CRs between those sacrificed immediately and those sacrificed 24 h later [200 paired (P > 0.05) and unpaired trials (P > 0.05); 800 paired (P > 0.05) and unpaired trials (P > 0.05)].
We first attempted to identify the approximate number of trials and the interval after trace conditioning when regulated gene expression was most robust. After differing numbers of trials and intervals of time after training, left hippocampi from at least two animals were individually prepared for TP by using the set of cDNA probes to reverse transcribe the extracted total RNA. To establish the threshold level of change that was significantly above background noise in the arrays, we evaluated the reproducibility of the expression profiles from identical samples. Therefore, we reverse transcribed total RNA collected and pooled from the hippocampi of three home caged controls and applied this sample to two different matched filter arrays. A scatter plot of these two data sets showed that gene expression in the two samples was highly correlated at higher levels of expression and was less reproducible at lower levels of expression (Fig. 2A). With an intensity threshold of > 1,250, the average ratio between identical genes with expression values above the threshold was 1.2 ± 0.04 (n = 427, number of genes whose expression was above the set threshold). Thus changes greater than 1.2 ± 0.04 fold are likely to be valid. When the intensity threshold was set to 10,000, the average ratio between identical genes only improved to 1.1 ± 0.03 (n = 50). The average ratio (± SEM) of all genes above a set threshold were plotted versus threshold intensity (Fig. 2B). As a conservative estimate, the threshold was established at 1400.
Figure 2.
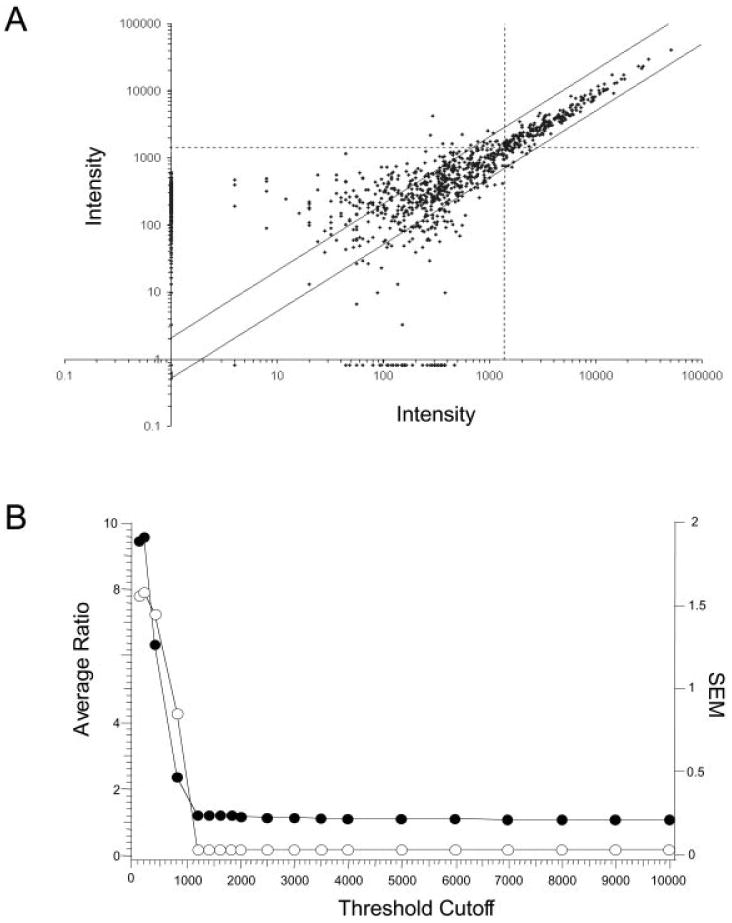
Error analysis. A: Scatter plot of pooled total RNA from home caged control animals hybridized to two different arrays. The dashed box represents genes with an intensity of <1400. Genes with intensity values of >1400 correlate strongly between identical replicates. The two parallel lines represent the twofold change range from the correlation mean. This comparison is representative of scatter plots between other identically treated animals. B: Graphic representation of the total error in the array. The average ratio between identical genes was plotted versus expression threshold for genes whose expression was above the threshold cutoff (●). The standard error of the mean (SEM) was also calculated for this subset of genes at each expression threshold (O). This graph confirms the observed threshold cutoff value of 1400 observed in the gross analysis of the scatter plot, with a data plateau at an average ratio of 1.2; SEM = 0.03.
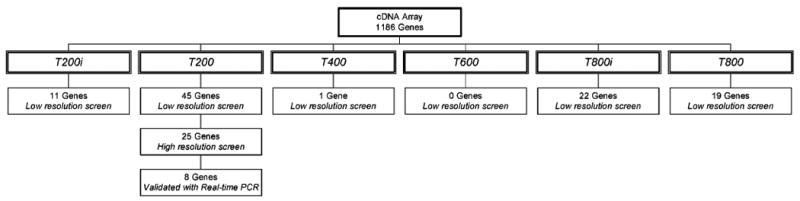
Genes were clustered using a Partitioning Around Medoids (PAM) algorithm (Kaufman and Rousseeuw, 1990) according to their patterns of activation and repression over the 800 trials of training on the trace eyeblink conditioning task (data not shown). Evaluating only those genes that belonged to clusters with a resulting change greater than twofold, the percentage of genes over all trial intervals that were either activated or suppressed by trace conditioning was 7.6% of the total number of genes on the array. These genes represented 25 clusters and contained 90 different genes. For each number of trials to which the animals were exposed the percentage of genes that achieved a threshold level of change ranged from 3.8% to 0.93%. The percentage of regulated genes reported is consistent with other studies that found 0.1–2% of the monitored genes changed by a factor of ≥ 1.8 in response to a specific manipulation (Lockhart and Winzeler, 2000). The animals exposed to 200 trials of trace conditioning and sacrificed 24 h after the end of training (T200) exhibited the highest percentage of gene expression changes with 14 clusters and 45 genes (Fig. 3). As illustrated in Figure 1, these animals were still acquiring the CR and thus changes in gene expression were occurring relatively early in the learning process.
Figure 3.
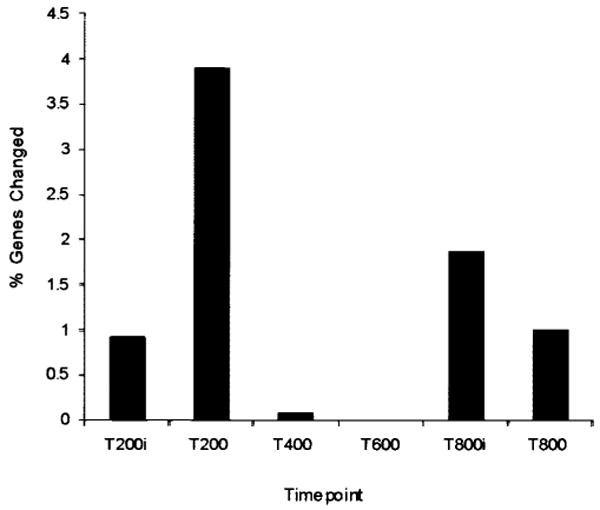
Percentage of genes regulated at each interval during the acquisition of a memory trace. Bars represent the percentage of the 1,186 genes on the array that changed in trace conditioning relative to the unpaired stimuli for that interval. Lowercase i denotes that animal was sacrificed immediately after training; its absence means that 24 h intervened.
Based on this evidence for robust transcriptional activity after 200 trials of training, additional groups of rats that were exposed to 200 trials of trace paired (n = 5) or unpaired stimuli (n = 4) and sacrificed them 24 h later. Their RNA was then prepared for TP as described. As reported, this number of animals provides a statistically powerful sample for transcriptional profiling (Lee et al., 2000). Total RNA was extracted from each of these samples. RNA from each animal was run on a separate array, five arrays for trace conditioning and four arrays for unpaired stimuli, from the same lot of arrays to minimize differences due to variation among the arrays. Mean intensity (±SEM) values for every gene were calculated, and ratios between the expression in response to trace versus pseudo- (unpaired stimuli presentations) conditioning were determined, as well as their representative P-values.
Comparison of the transcriptional profiles between trace and unpaired conditioning suggested the possibility of regulated expression in those genes which met the criteria for one of two categories (Table 1). Category 1 genes were induced or repressed at least twofold in trace conditioned animals relative to the unpaired animals with a P-value of ≤ 0.16. Furthermore, the gene had to be expressed above the threshold in at least four out of five trace animals or above the threshold in at least three out of four unpaired animals. Category 2 genes were reproducibly expressed closer to the same level in both conditions, but the smaller difference in expression was highly consistent (P < 0.05). Eleven genes met the first criterion, and 13 genes met the second for a total of 24 genes selected by analysis of the arrays (Table 1). By definition, category 1 genes showed greater variation (had higher P-values) in their actual expression levels but had changes that were greater in magnitude than category 2 genes, which by definition had highly significant P-values. In addition, GH was included on this list because it had the largest change observed in several trace conditioned animals and was frequently one of the most highly expressed genes on the trace conditioned arrays. Only 6.6% of the genes originally identified from the initial low-resolution pilot screen at the T200 interval of trace conditioning remained significant when greater numbers of animals were analyzed. These genes were GH, serum/glucocorticoid-regulated kinase (SGK), and UNC5H1.
Table 1. Regulated Genes in Trace Conditioning.
| Gene name | Fold changec | P-valued | Tracee | Unpairedf |
|---|---|---|---|---|
| Two-fold or greater changes | ||||
| Cathepsin Ka | 3.2 | 0.07 | 4 | 1 |
| Sodium/calcium exchanger (NCX2)a | 2.7 | 0.11 | 4 | 1 |
| Synaptotagmin Va | 2.4 | 0.14 | 4 | 1 |
| Serum/glucocorticoid-regulated serine/threonine protein kinase (SGK) | −2.0 | 0.16 | 2 | 3 |
| Receptor of steel ligand (c-kit)b | −2.0 | 0.04 | 3 | 4 |
| Netrin receptor (UNC5H1)b | −2.0 | 0.15 | 2 | 3 |
| Prohibitin (PHB) | −2.1 | 0.16 | 2 | 3 |
| β-Nerve growth factor (β-NGF)b | −2.1 | 0.11 | 3 | 4 |
| Netrin receptor (UNC5H2)b | −2.2 | 0.03 | 3 | 4 |
| Interleukin-8 receptor | −4.2 | 0.06 | 1 | 3 |
| Ribosomal protein S29 40S, RPS29 | −4.4 | 0.06 | 1 | 3 |
| Growth hormone (GH)b | 2.6 | 0.25 | 3 | 1 |
| Small changes with P-values <0.05 | ||||
| ATP synthase lipid-binding protein P1, ATP5G1 | 1.12 | 0.04 | 5 | 4 |
| Ribosomal protein L 13 | 1.11 | 0.04 | 5 | 4 |
| Extracellular signal-regulated kinase 1 (ERK1)a | 1.1 | 0.04 | 5 | 4 |
| Glyceraldehyde 3-phosphate dehydrogenase (GAPDH) | −1.15 | 0.04 | 5 | 4 |
| Metabotropic glutamate receptor 5 (MGLUR5)b | −1.16 | 0.04 | 5 | 4 |
| Proteasome component C2 | 1.15 | 0.03 | 5 | 4 |
| Myelin proteolipid protein (PLP) | −1.12 | 0.03 | 5 | 4 |
| Fructose-bisphosphate aldolase A (ALDOA) | 1.12 | 0.02 | 5 | 4 |
| Transcription factor AP-1, c-JUNb | −1.28 | 0.02 | 5 | 4 |
| Sodium/potassium-transporting ATPase β2 (ATP1B2)a | 1.23 | 0.01 | 5 | 4 |
| Dimeric acid glycoprotein (DAG) | 1.17 | 0.01 | 5 | 4 |
| GluT and GluT-R glutamate transporter | 1.13 | 0.01 | 5 | 4 |
| Ribosomal protein L11 | 1.09 | 0.01 | 5 | 4 |
Genes that were selected for analysis by real-time PCR, but not validated.
Genes that were validated by real-time PCR.
Fold changes are a ratio of trace over unpaired. Ratios that were <1.0 are represented by the equation: −1/(trace/unpaired).
P-values were calculated using Student's t-test.
The number of trace conditioned animals out of the group of 5 that had expression values above the 1400 threshold.
The number of unpaired conditioned animals out of the group of four that had expression values above the 1400 threshold. See results for GH inclusion criteria.
In the next set of studies, we determined whether the genes that were expressed during trace conditioning were unique to hippocampal-dependent learning; that is, would the same genes show changes in expression during acquisition of the hippocampal-in-dependent task: delay conditioning? Five animals were trained with delay conditioning (Fig. 1), and total RNA was extracted from hippocampal tissue from each animal. cDNA probes synthesized from these samples were hybridized to arrays in parallel with the samples isolated from the hippocampus of the four animals exposed to unpaired stimuli: five arrays for delay and five arrays for unpaired. The 25 genes that underwent gene expression changes in trace conditioning (Table 1) were analyzed by the same criteria from the delay-conditioned animals. None of these genes fulfilled the criteria for inclusion into category 1 or category 2 in response to 200 trials of delay conditioning. This difference in the profiles of category 1 genes for the two tasks is best illustrated using the TreeView (Eisen et al., 1998) (Fig. 4).
Figure 4.
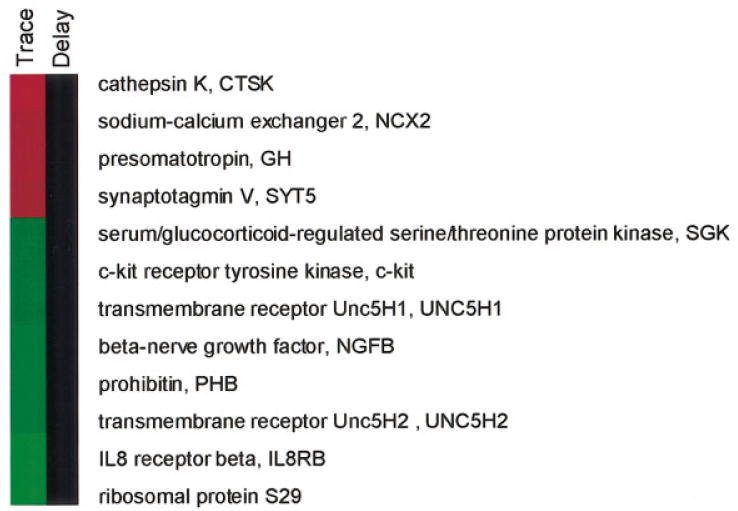
Specificity of category 1 gene expression changes in trace conditioning compared with delay conditioning. Log2 gene expression values for trace conditioned rats, which acquired the conditioned response (CR) (trace), and for delay conditioned rats (delay) were each computed relative to rats exposed to unpaired stimuli and displayed using TreeView (Eisen et al., 1998). The color scale ranged from saturated green for log ratios of ≤2.0 to saturated red for log ratios of ≥2.0. Black indicates a value of 0 and no change between either trace or delay relative to unpaired.
Transcriptional profiling simultaneously assays a vast number of genes and is susceptible to producing false-positive results because of the statistical issue of multiple testing. Approximately 300 genes fell above the threshold and, given the P-values for the genes listed in Table 1, we would expect some of the genes presented to represent false-positive values. To address this problem, we randomly selected 12 of the 25 genes that exhibited a change in expression in response to trace conditioning by TP and reanalyzed these genes using real-time PCR with SYBR green from PE Biosystems. Because the GH mRNA was dramatically increased in RNA obtained from rats exposed to trace conditioning, we also performed realtime PCR on somatostatin (SST), the direct antagonist of GH, even though the decrease in SST mRNA expression just failed to meet the statistical criteria for inclusion among the 25 genes. Realtime PCR was performed on cDNA synthesized from the same total RNA used as templates for the cDNA probes hybridized to the arrays. Of 13 genes (12 randomly selected and the SST mRNA), seven changed in the same direction and to a similar magnitude as they had on the arrays. These validated genes were GH, c-kit receptor tyrosine kinase (c-Kit), glutamate receptor metabotropic 5 (mGluR5), nerve growth factor-β (NGF-β), Jun oncogene (c-Jun), and transmembrane receptors Unc5H1 (UNC5H1) andUnc5H2 (UNC5H2) (Fig. 5B). In addition, SST mRNA was repressed as expected under conditions where GH mRNA is induced, further confirming the validity of the GH result. As a standard for the real-time PCR, the 18S ribosomal RNA was expressed at constant levels across all the conditions (Fig. 5A). Thus, more than one-half of the genes detected by transcriptional profiling were confirmed by real-time PCR.
Figure 5.
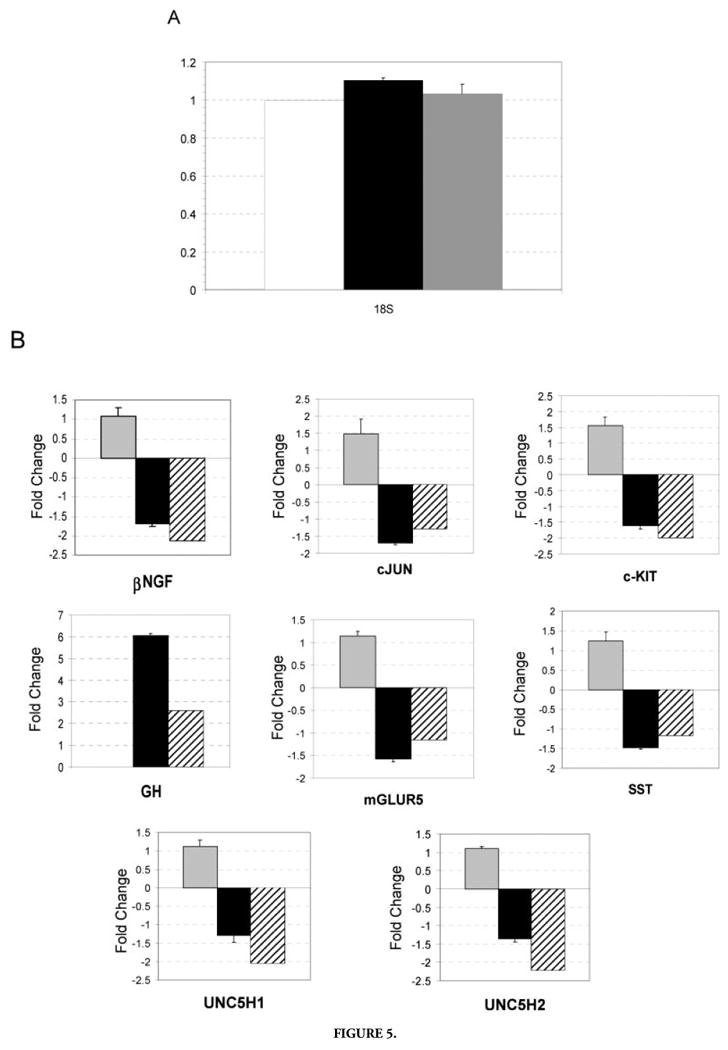
Real-time polymerase chain reaction (PCR). A: Primers specific for 18S rRNA were used to normalize levels of total RNA added to the reactions. Relative to RNA isolated from caged controls, unpaired (white), trace (black), and delay (gray) data were corrected by a factor of 1.00, 1.13, and 1.03, respectively. B: Graphs represent fold change of real-time PCR products for delay (gray filled), trace (filled) relative to unpaired. Hatched boxes refer to fold change as calculated from the array data. Trace over unpaired ratios that were <1.0 are represented by the equation: −1/(trace/unpaired). Realtime PCR results shown are the averaged fold change calculated from three independent experiments, the error bar represents the standard error of the mean (SEM).
Notably, expression of the identified genes (except for GH) decreased in response to trace conditioning. Because the changes were expressed as a ratio, it was possible that exposure to paired stimuli in a trace paradigm did not downregulate, but rather exposure to unpaired stimuli upregulated gene expression. To test this possibility, we performed real-time PCR on hippocampal mRNA obtained from naive cage controls and compared their response to RNA from rats exposed with unpaired stimuli. For every suppressed gene, expression in tissue obtained from the cage controls was either higher or equal to expression in tissue obtained from animals exposed to unpaired stimuli (data not shown). This result indicates that an authentic suppression occurred relative to the basal expression levels of these genes. Moreover, because animals exposed to unpaired stimuli “learn” that the conditioned and unconditioned stimuli do not occur together in time, these results suggest that acquisition of this type of conditioning does not involve the regulation of these particular genes. In addition, real-time PCR confirmed that delay conditioning did not result in the regulation of those genes expressed in trace conditioning (Fig. 5B). Thus, the genes identified during exposure to trace conditioning appear to be specific to hippocampal-dependent learning.
The gene for GH was dramatically induced during trace conditioning, and was not expressed during delay conditioning. The increase was evident by both TP and PCR methods (Fig. 5B). Since GH mRNA has not previously been characterized in the hippocampus, we further analyzed its expression pattern in the hippocampus using in situ hybridization. After 200 trials of trace conditioning, the signal for growth hormone in the hippocampus appeared (Fig. 6A,B) localized to the neuronal cytoplasm and evident throughout the CA fields and dentate gyrus of the hippocampus.
Figure 6.
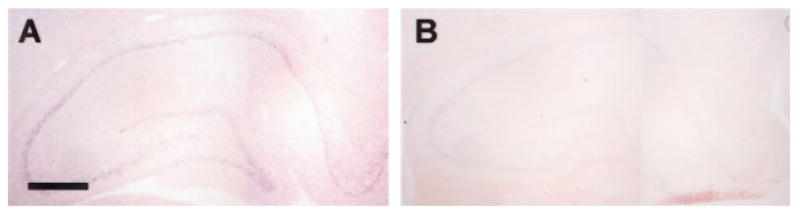
Hippocampal expression of growth hormone is enhanced during trace learning. In situ hybridization on a coronal section of a rat exposed to 200 trials of trace conditioning (A) or to the same number of unpaired stimuli (B). Digoxigenin-labeled RNA probes were used for growth hormone.
Discussion
We used transcriptional profiling to identify genes associated with hippocampal-dependent memory formation. Animals were exposed to varying numbers of trials of trace conditioning, a task that is dependent on the hippocampus for acquisition (Solomon et al., 1986; McEchron et al., 1998; Weiss et al., 1999; Beylin et al., 2001). Their responses were compared with delay conditioned animals, involving a similar associative task that is not dependent on the hippocampus (Schmaltz and Theios, 1972), and with pseudo-conditioned animals that received the same number of stimuli in an unpaired manner. Confounding factors, such as stress, novelty, and motor activity, were likely to be similar between groups. Thus, animals were exposed to similar stimuli and emit similar responses, yet only a subgroup acquires a hippocampal-dependent memory. Within the detection limits of TP and among the genes represented on the filter array, the most robust changes in gene expression occurred early in the training period before the conditioned response was acquired and 24 h after the last exposure to a training trial. Having identified the approximate number of trials and time after training when transcription was highly regulated, we evaluated the expression of 1,186 genes in response to trace conditioning. There were statistically significant changes in the expression of 25 genes on the array (Table 1). Of these 25 genes, 12 were randomly chosen for validation by real-time PCR. In addition, we chose to look at SST, the antagonist for GH, to validate further the changes in GH expression. Of these 13 genes, eight demonstrated changes in the same direction and of the same magnitude as they had by TP (Figs. 5B and 7). Importantly, none of these validated genes were similarly altered by exposure to the same number of trials of the hippocampal-independent task (i.e., delay conditioning).
Figure 7.
Layers of validation used to verify gene expression changes that correlate with the acquisition of trace eyeblink conditioning.
Setting inclusion criteria for array data is difficult because if set too stringently regulated genes will be excluded, but if set too loosely many unregulated genes will be included. Imperfections in the array technique and individual variation in behavioral performance will inevitably lead to some failures of gene inclusion or exclusion and, therefore, validation is essential. Our category 1 genes had the larger magnitude changes, but their large P-values suggested that 5–15% of the time, these changes would occur by chance. Variability in performance probably accounts for the chance component in these P-values. Animals were collected after only 200 trials when at most they have reached 30 – 40% criterion. Although the involvement of the hippocampus is most pertinent during acquisition, it is also the most difficult interval to judge performance. All animals for this study were chosen because they demonstrated an increase in conditioned responses from 100–200 trials and were therefore considered to be acquiring the task. However, it is possible that not all these animals would go on to learn and reach full criterion. During this dynamic time when individual potential varies, gene expression may be variable. The criteria we selected for validation were conservative and substantiated by the significant validation rate. Reducing the P-value for inclusion of category 1 genes would have eliminated a number of genes that were later validated, suggesting that a 5–15% noise level is inherent in the experimental paradigm. Using the criteria outlined here, of seven genes selected from category 1 for validation, four were validated; of four genes selected from category 2 for validation, two were validated. Thus, both approaches led to a reasonable percentage of validation given the degree of error in the array technology.
As discussed, gene expression changed as the animal acquired the conditioned response. In other words, the gene expression patterns changed as a function of the number of trials delivered to the animal. Interestingly, most of the genes evaluated in this limited data set were downregulated; however, this pattern appeared to reverse with continued training. Our preliminary data suggested that additional genes were upregulated in rats exposed to 800 trials (data not shown), but these data require additional validation. Genes that were downregulated during the early acquisition of trace memories included NGF-β, c-JUN, c-kit, mGLUR5, SST, UNC5H1, and UNC5H2 (Fig. 5B). A number of these genes have been associated with learning, while others have not. For example, c-Kit mRNA levels were reduced in trace conditioned animals after 200 trials, and it has been reported that mutations in both the c-kit receptor tyrosine kinase encoded by the white-spotting (W) gene and the Kit ligand, Steel factor, impair learning (Motro et al., 1996; Katafuchi et al., 2000). An analysis of the homozygous c-kit mutants deficient in spatial learning suggests c-kit signaling may be involved in synaptic potentiation (Katafuchi et al., 2000). The c-kit and steel genes are both highly expressed in the adult murine hippocampus: Steel is expressed in the dentate gyrus neurons whose mossy fiber axons synapse on CA3 pyramidal neurons, which express c-kit (Motro et al., 1996). Steel, also known as stem cell factor, can modulate neuron–neuron and neuron–microglia interactions (Zhang and Fedoroff, 1997, 1998).
In addition, c-Kit mRNA is downregulated when glial precursor cells differentiate into postmitotic oligodendrocytes (Ida et al., 1993). It is perhaps relevant that exposure to trace conditioning, but not delay conditioning, enhances the survival of adult-generated neurons in the dendate gyrus (Gould et al., 1999; Shors et al., 2001). The newly generated neurons become involved in trace conditioning at about one week of age, the time when they are also developing axons to CA3 (Hastings and Gould, 1999; Shors et al., 2001). Two of the genes, UNC5H1 and UNC5H2, that were repressed in response to trace conditioning are involved in axon guidance and belong to the Unc5 family of netrin-1 receptors. Netrins are chemoattractants, and Netrin-1 has been shown to attract neurites from the dentate gyrus to form ipsilateral connections via the netrin receptor, DCC (Livesey, 1999). Unc5H1 and Unc5H2 are considered repellant receptors converting DCC attractant receptors to repulsive receptors through an interaction between cytoplasmic domains (Stein and Tessier-Lavigne, 2001). In addition, as with the other genes discussed thus far, expression of mGluR5 mRNA was reduced in response to trace conditioning. It has been reported that antagonists to mGluR5 are neuroprotective (Bruno et al., 2000; Sommer et al., 2000; Movsesyan et al., 2001), suggesting that the reduction in mGluR5 levels may likewise be protective.
In contrast to the other validated genes, the mRNA encoding GH was dramatically upregulated during trace conditioning. This change occurred in mRNA obtained from animals exposed to 200 trials of trace conditioning relative to mRNA from animals exposed to unpaired stimuli and demonstrated by hybridization to an array, real-time PCR, and in situ hybridization (Figs. 5B). Further-more, somatostatin mRNA, which encodes a direct antagonist of GH, was reduced in response to trace conditioning (Fig. 5B). GH was not expressed at a detectable level in animals exposed to the delay paradigm. Although GH receptors exist in the hippocampus (Zhai et al., 1994), very little is known about the GH expression of itself outside the pituitary. It has been assumed that a source of GH lies outside the brain, or that the GH receptor in the brain has a ligand other than GH itself such as the GH-like substance which is sensitive to brain injury (reviewed in Scheepens et al., 2000). The GH mRNA is regulated by stress, at least in the hippocampus but again, the source of the endogenous ligand is unknown (Fujikawa et al., 2000). Finally, GH has been implicated in some memory processes (Schneider-Rivas et al., 1995; Thornton et al., 2000), as our results confirm. That GH would be preferentially regulated by associative learning was unexpected and thus exemplifies how TP can identify potentially important genes that might otherwise go uninvestigated.
Many genes that have been implicated in the acquisition of hippocampal-dependent memories were not revealed by TP in these experiments. Several factors may prevent their detection. First, many genes relevant to learning are not present on the Atlas Rat 1.2 array from Clontech, which is a broad coverage cDNA array with a relatively small representation of genes. Our data only reflect the expression of those 1,186 genes. Second, our threshold for detection omits genes whose expression does not meet criteria, and yet gene expression below the level of detection by TP may still be critical for learning. Third, classical conditioning does not necessarily activate all cells within the hippocampus to the same degree. Given the variety of neuronal populations and anatomical regions in the hippocampus, extraction of RNA from the total hippocampus may dilute gene expression changes that occur in subsets of cells. Fourth, individual differences in performance could lend variability to the sample. This potential source of variability would be especially true for those animals exposed to only 200 trials and thus at differing levels of acquisition at the time of sacrifice. In this study, we considered that an animal was “learning” if the number of CRs increased from 100 trials to 200 trials, yet most animals had not reached asymptotic performance at that stage. Finally, it may not be possible to compare genes identified with knockout or overexpression with those revealed under endogenous conditions.
As discussed, trace conditioning is dependent on the hippocampal formation for acquisition, whereas delay conditioning is not. However, the hippocampus is engaged by both types of training procedures (Berger et al., 1976; Weisz et al., 1984; Tocco et al., 1991; Moyer et al., 2000). Thus, it is curious that so few of the genes expressed in response to trace conditioning were also expressed in response to delay conditioning. It is noted that our procedures biased the data in this direction, as only those genes that were validated as being sensitive to trace conditioning were then tested for sensitivity to delay conditioning. However, this does not exclude the possibility that other genes are differentially activated in the hippocampus during delay conditioning. Nonetheless, these results demonstrate that the difference between these two paradigms at the anatomical level is supported by similar differences at the genetic level.
During trace conditioning, the animal learns to associate two stimuli that are discontiguous in time and to distinguish between the interstimulus interval, which is stable, and the intertrial interval, which varies. It is often assumed that the hippocampus is necessary for acquiring the trace conditioned response because it maintains a stimulus representation of the CS after it has ceased, so that it can be associated with the US later (Solomon et al., 1986). If this assumption is valid, these genes, which are uniquely expressed during trace conditioning, are potential candidates for involvement in the process of stimulus maintenance or their retrieval. They may also be candidates for explaining the observation that the trace conditioned response is often more difficult to acquire than the delay conditioned response. Indeed, recent data indicate that the hippocampus is involved in delay conditioning, provided the task is rendered sufficiently difficult to acquire (Beylin et al., 2001). In this study, we present data suggesting that at least eight genes are uniquely regulated during trace, but not during the hippocampal-independent version of delay conditioning. Further examination of the role of the genes found in the present study may lead to novel insights regarding the role of the hippocampus in the acquisition of trace memories.
Acknowledgments
The authors thank Howard Eichenbaum for critically reading the manuscript and Reisa Sperling for her suggestions. This work was supported by grants from the National Institutes of Health (MH 59970) (to T.J.S.) and NASA (NAG2-1362) and the Fidelity Foundation (to K.S.K.).
National Institutes of Health; Grant number: MH 59970; Grant sponsor: NASA; Grant number: NAG2-1362; Grant sponsor: Fidelity Foundation.
References
- Abel T, Nguyen PV, Barad M, Deuel TA, Kandel ER, Bourtchouladze R. Genetic demonstration of a role for PKA in the late phase of LTP and in hippocampus-based long-term memory. Cell. 1997;88:615–626. doi: 10.1016/s0092-8674(00)81904-2. [DOI] [PubMed] [Google Scholar]
- Barzilai A, Kennedy TE, Sweatt JD, Kandel ER. 5-HT modulates protein synthesis and the expression of specific proteins during long-term facilitation in Aplysia sensory neurons. Neuron. 1989;2:1577–1586. doi: 10.1016/0896-6273(89)90046-9. [DOI] [PubMed] [Google Scholar]
- Berger TW, Alger B, Thompson RF. Neuronal substrate of classical conditioning in the hippocampus. Science. 1976;192:483–485. doi: 10.1126/science.1257783. [DOI] [PubMed] [Google Scholar]
- Beylin A, Gandhi C, Talk A, Matzel LD, Shors TJ. The role of the hippocampus in trace conditioning: temporal incongruity or task difficulty? Neurobiol Learning Mem. 2001;76:447–461. doi: 10.1006/nlme.2001.4039. [DOI] [PubMed] [Google Scholar]
- Bourtchouladze R, Abel T, Berman N, Gordon R, Lapidus K, Kandel ER. Different training procedures recruit either one or two critical periods for contextual memory consolidation, each of which requires protein synthesis and PKA. Learn Mem. 1998;5:365–374. [PMC free article] [PubMed] [Google Scholar]
- Bruno V, Ksiazek I, Battaglia G, Lukic S, Leonhardt T, Sauer D, Gasparini F, Kuhn R, Nicoletti F, Flor PJ. Selective blockade of metabotropic glutamate receptor subtype 5 is neuroprotective. Neuropharmacology. 2000;39:2223–2230. doi: 10.1016/s0028-3908(00)00079-4. [DOI] [PubMed] [Google Scholar]
- Cammarota M, Bevilaqua LR, Ardenghi P, Paratcha G, Levi de Stein M, Izquierdo I, Medina JH. Learning-associated activation of nuclear MAPK, CREB and Elk-1, along with Fos production, in the rat hippocampus after a one-trial avoidance learning: abolition by NMDA receptor blockade. Brain Res Mol Brain Res. 2000;76:36–46. doi: 10.1016/s0169-328x(99)00329-0. [DOI] [PubMed] [Google Scholar]
- Cavallaro S, Meiri N, Yi CL, Musco S, Ma W, Goldberg J, Alkon DL. Late memory-related genes in the hippocampus revealed by RNA fingerprinting. Proc Natl Acad Sci U S A. 1997;94:9669–9673. doi: 10.1073/pnas.94.18.9669. [DOI] [PMC free article] [PubMed] [Google Scholar]
- Clark RE, Zola S. Trace eyeblink classical conditioning in the monkey: a nonsurgical method and behavioral analysis. Behav Neurosci. 1998;112:1062–1068. doi: 10.1037//0735-7044.112.5.1062. [DOI] [PubMed] [Google Scholar]
- Dash PK, Hochner B, Kandel ER. Injection of the cAMP-responsive element into the nucleus of Aplysia sensory neurons blocks long-term facilitation. Nature. 1990;345:718–721. doi: 10.1038/345718a0. [DOI] [PubMed] [Google Scholar]
- Davis HP, Squire LR. Protein synthesis and memory: a review. Psychol Bull. 1984;96:518–559. [PubMed] [Google Scholar]
- Dura JM, Preat T, Tully T. Identification of linotte, a new gene affecting learning and memory in Drosophila melanogaster. J Neurogenet. 1993;9:1–14. doi: 10.3109/01677069309167272. [DOI] [PubMed] [Google Scholar]
- Dura JM, Taillebourg E, Preat T. The Drosophila learning and memory gene linotte encodes a putative receptor tyrosine kinase homologous to the human RYK gene product. FEBS Lett. 1995;370:250–254. doi: 10.1016/0014-5793(95)00847-3. [DOI] [PubMed] [Google Scholar]
- Eisen MB, Spellman PT, Brown PO, Botstein D. Cluster analysis and display of genome-wide expression patterns. Proc Natl Acad Sci U S A. 1998;95:14863–14868. doi: 10.1073/pnas.95.25.14863. [DOI] [PMC free article] [PubMed] [Google Scholar]
- Fujikawa T, Soya H, Fukuoka H, Alam KS, Yoshizato H, McEwen BS, Nakashima K. A biphasic regulation of receptor mRNA expressions for growth hormone, glucocorticoid and mineralocorticoid in the rat dentate gyrus during acute stress. Brain Res. 2000;874:186–193. doi: 10.1016/s0006-8993(00)02576-2. [DOI] [PubMed] [Google Scholar]
- Futatsugi N, Hata M, Hoshino T, Tsuda M. Ab initio study of the role of lysine 16 for the molecular switching mechanism of Ras protein p21. Biophys J. 1999;77:3287–3292. doi: 10.1016/S0006-3495(99)77159-6. [DOI] [PMC free article] [PubMed] [Google Scholar]
- Garcia JA, Zhang D, Estill SJ, Michnoff C, Rutter J, Reick M, Scott K, Diaz-Arrastia R, McKnight SL. Impaired cued and contextual memory in NPAS2-deficient mice. Science. 2000;288:2226–2230. doi: 10.1126/science.288.5474.2226. [DOI] [PubMed] [Google Scholar]
- Gould E, Beylin A, Tanapat P, Reeves A, Shors TJ. Learning enhances adult neurogenesis in the hippocampal formation. Nat Neurosci. 1999;2:260–265. doi: 10.1038/6365. [DOI] [PubMed] [Google Scholar]
- Grant SG, O'Dell TJ, Karl KA, Stein PL, Soriano P, Kandel ER. Impaired long-term potentiation, spatial learning, and hippocampal development in fyn mutant mice. Science. 1992;258:1903–1910. doi: 10.1126/science.1361685. [DOI] [PubMed] [Google Scholar]
- Grotewiel MS, Beck CD, Wu KH, Zhu XR, Davis RL. Integrin-mediated short-term memory in Drosophila. Nature. 1998;391:455–460. doi: 10.1038/35079. [DOI] [PubMed] [Google Scholar]
- Guzowski JF, McGaugh JL. Antisense oligodeoxynucleotide-mediated disruption of hippocampal cAMP response element binding protein levels impairs consolidation of memory for water maze training. Proc Natl Acad Sci U S A. 1997;94:2693–2698. doi: 10.1073/pnas.94.6.2693. [DOI] [PMC free article] [PubMed] [Google Scholar]
- Hastings NB, Gould E. Rapid extension of axons into the CA3 region by adult-generated granule cells. J Comp Neurol. 1999;413:146–154. doi: 10.1002/(sici)1096-9861(19991011)413:1<146::aid-cne10>3.0.co;2-b. [DOI] [PubMed] [Google Scholar]
- Hegde AN, Inokuchi K, Pei W, Casadio A, Ghirardi M, Chain DG, Martin KC, Kandel ER, Schwartz JH. Ubiquitin C-terminal hydrolase is an immediate-early gene essential for long-term facilitation in Aplysia. Cell. 1997;89:115–126. doi: 10.1016/s0092-8674(00)80188-9. [DOI] [PubMed] [Google Scholar]
- Ichikawa T, Ajiki K, Matsuura J, Misawa H. Localization of two cholinergic markers, choline acetyltransferase and vesicular acetylcholine transporter in the central nervous system of the rat: in situ hybridization histochemistry and immunohistochemistry. J Chem Neuroanat. 1997;13:23–39. doi: 10.1016/s0891-0618(97)00021-5. [DOI] [PubMed] [Google Scholar]
- Ida JA, Jr, Dubois-Dalcq M, McKinnon RD. Expression of the receptor tyrosine kinase c-kit in oligodendrocyte progenitor cells. J Neurosci Res. 1993;36:596–606. doi: 10.1002/jnr.490360512. [DOI] [PubMed] [Google Scholar]
- Impey S, Smith DM, Obrietan K, Donahue R, Wade C, Storm DR. Stimulation of cAMP response element (CRE)-mediated transcription during contextual learning. Nat Neurosci. 1998;1:595–601. doi: 10.1038/2830. [DOI] [PubMed] [Google Scholar]
- Katafuchi T, Li AJ, Hirota S, Kitamura Y, Hori T. Impairment of spatial learning and hippocampal synaptic potentiation in c-kit mutant rats. Learn Mem. 2000;7:383–392. doi: 10.1101/lm.33900. [DOI] [PMC free article] [PubMed] [Google Scholar]
- Kaufman L, Rousseeuw PJ. Finding groups in data: An introduction to cluster analysis. New York: Wiley; 1990. [Google Scholar]
- Lee ML, Kuo FC, Whitmore GA, Sklar J. Importance of replication in microarray gene expression studies: statistical methods and evidence from repetitive cDNA hybridizations. Proc Natl Acad Sci U S A. 2000;97:9834–9839. doi: 10.1073/pnas.97.18.9834. [DOI] [PMC free article] [PubMed] [Google Scholar]
- Livesey FJ. Netrins and netrin receptors. Cell Mol Life Sci. 1999;56:62–68. doi: 10.1007/s000180050006. [DOI] [PMC free article] [PubMed] [Google Scholar]
- Lockhart DJ, Winzeler EA. Genomics, gene expression and DNA arrays. Nature. 2000;405:827–836. doi: 10.1038/35015701. [DOI] [PubMed] [Google Scholar]
- Madani R, Hulo S, Toni N, Madani H, Steimer T, Muller D, Vassalli JD. Enhanced hippocampal long-term potentiation and learning by increased neuronal expression of tissue-type plasminogen activator in transgenic mice. EMBO J. 1999;18:3007–3012. doi: 10.1093/emboj/18.11.3007. [DOI] [PMC free article] [PubMed] [Google Scholar]
- Mansuy IM, Mayford M, Jacob B, Kandel ER, Bach ME. Restricted and regulated overexpression reveals calcineurin as a key component in the transition from short-term to long-term memory. Cell. 1998;92:39–49. doi: 10.1016/s0092-8674(00)80897-1. [DOI] [PubMed] [Google Scholar]
- McCormick DA, Clark GA, Lavond DG, Thompson RF. Initial localization of the memory trace for a basic form of learning. Proc Natl Acad Sci USA. 1982;79:2731–2735. doi: 10.1073/pnas.79.8.2731. [DOI] [PMC free article] [PubMed] [Google Scholar]
- McEchron MD, Bouwmeester H, Tseng W, Weiss C, Disterhoft JF. Hippocampectomy disrupts auditory trace fear conditioning and contextual fear conditioning in the rat. Hippocampus. 1998;8:638–646. doi: 10.1002/(SICI)1098-1063(1998)8:6<638::AID-HIPO6>3.0.CO;2-Q. [DOI] [PubMed] [Google Scholar]
- Motro B, Wojtowicz JM, Bernstein A, van der Kooy D. Steel mutant mice are deficient in hippocampal learning but not long- term potentiation. Proc Natl Acad Sci U S A. 1996;93:1808–1813. doi: 10.1073/pnas.93.5.1808. [DOI] [PMC free article] [PubMed] [Google Scholar]
- Movsesyan VA, O'Leary DM, Fan L, Bao W, Mullins PG, Knoblach SM, Faden AI. mGluR5 antagonists 2-methyl-6-(phenylethynyl)-pyridine and (E)-2-methyl- 6-(2-phenylethenyl)-pyridine reduce traumatic neuronal injury in vitro and in vivo by antagonizing N-methyl-D-aspartate receptors. J Pharmacol Exp Ther. 2001;296:41–47. [PubMed] [Google Scholar]
- Moyer JR, Jr, Deyo RA, Disterhoft JF. Hippocampectomy disrupts trace eye-blink conditioning in rabbits. Behav Neurosci. 1990;104:243–252. doi: 10.1037//0735-7044.104.2.243. [DOI] [PubMed] [Google Scholar]
- Moyer JR, Jr, Power JM, Thompson LT, Disterhoft JF. Increased excitability of aged rabbit CA1 neurons after trace eyeblink conditioning. J Neurosci. 2000;20:5476–5482. doi: 10.1523/JNEUROSCI.20-14-05476.2000. [DOI] [PMC free article] [PubMed] [Google Scholar]
- Schaeren-Wiemers N, Gerfin-Moser A. A single protocol to detect transcripts of various types and expression levels in neural tissue and cultured cells: in situ hybridization using digoxigenin-labelled cRNA probes. Histochemistry. 1993;100:431–440. doi: 10.1007/BF00267823. [DOI] [PubMed] [Google Scholar]
- Scheepens A, Williams CE, Breier BH, Guan J, Gluckman PD. A role for the somatotropic axis in neural development, injury and disease. J Pediatr Endocrinol Metab. 2000;13:1483–1491. doi: 10.1515/jpem-2000-s623. [DOI] [PubMed] [Google Scholar]
- Schmaltz LW, Theios J. Acquisition and extinction of a classically conditioned response in hippocampectomized rabbits (Oryctolagus cuniculus) J Comp Physiol Psychol. 1972;79:328–333. doi: 10.1037/h0032531. [DOI] [PubMed] [Google Scholar]
- Schneider-Rivas S, Rivas-Arancibia S, Vazquez-Pereyra F, Vazquez-Sandoval R, Borgonio-Perez G. Modulation of long-term memory and extinction responses induced by growth hormone (GH) and growth hormone releasing hormone (GHRH) in rats. Life Sci. 1995;56:PL433–441. doi: 10.1016/0024-3205(95)00171-2. [DOI] [PubMed] [Google Scholar]
- Shors TJ, Miesegaes G, Beylin A, Zhao M, Rydel T, Gould E. Neurogenesis in the adult is involved in the formation of trace memories. Nature. 2001;410:372–376. doi: 10.1038/35066584. [DOI] [PubMed] [Google Scholar]
- Silva AJ, Paylor R, Wehner JM, Tonegawa S. Impaired spatial learning in alpha-calcium-calmodulin kinase II mutant mice. Science. 1992;257:206–211. doi: 10.1126/science.1321493. [DOI] [PubMed] [Google Scholar]
- Solomon PR, Vander Schaaf ER, Thompson RF, Weisz DJ. Hippocampus and trace conditioning of the rabbit's classically conditioned nictitating membrane response. Behav Neurosci. 1986;100:729–744. doi: 10.1037//0735-7044.100.5.729. [DOI] [PubMed] [Google Scholar]
- Sommer C, Roth SU, Kuhn R, Kiessling M. Metabotropic glutamate receptor subtypes are differentially expressed after transient cerebral ischemia without, during and after tolerance induction in the gerbil hippocampus. Brain Res. 2000;872:172–180. doi: 10.1016/s0006-8993(00)02529-4. [DOI] [PubMed] [Google Scholar]
- Stein E, Tessier-Lavigne M. Hierarchical organization of guidance receptors: silencing of netrin attraction by slit through a Robo/DCC receptor complex. Science. 2001;291:1928–1938. doi: 10.1126/science.1058445. [DOI] [PubMed] [Google Scholar]
- Tang FR, Sim MK. Metabotropic glutamate receptor subtype-1 alpha (mGluR1 alpha) immunoreactivity in ependymal cells of the rat caudal medulla oblongata and spinal cord. Neurosci Lett. 1997;225:177–180. doi: 10.1016/s0304-3940(97)00220-6. [DOI] [PubMed] [Google Scholar]
- Thornton PL, Ingram RL, Sonntag WE. Chronic [D-Ala2]-growth hormone-releasing hormone administration attenuates age-related deficits in spatial memory. J Gerontol A Biol Sci Med Sci. 2000;55:B106–112. doi: 10.1093/gerona/55.2.b106. [DOI] [PubMed] [Google Scholar]
- Tischmeyer W, Kaczmarek L, Strauss M, Jork R, Matthies H. Accumulation of c-fos mRNA in rat hippocampus during acquisition of a brightness discrimination. Behav Neural Biol. 1990;54:165–171. doi: 10.1016/0163-1047(90)91366-j. [DOI] [PubMed] [Google Scholar]
- Tocco G, Devgan KK, Hauge SA, Weiss C, Baudry M, Thompson RF. Classical conditioning selectively increases AMPA receptor binding in rabbit hippocampus. Brain Res. 1991;559:331–336. doi: 10.1016/0006-8993(91)90020-v. [DOI] [PubMed] [Google Scholar]
- Uetani N, Kato K, Ogura H, Mizuno K, Kawano K, Mikoshiba K, Yakura H, Asano M, Iwakura Y. Impaired learning with enhanced hippocampal long-term potentiation in PTPdelta-deficient mice. EMBO J. 2000;19:2775–2785. doi: 10.1093/emboj/19.12.2775. [DOI] [PMC free article] [PubMed] [Google Scholar]
- Weiss C, Bouwmeester H, Power JM, Disterhoft JF. Hippocampal lesions prevent trace eyeblink conditioning in the freely moving rat. Behav Brain Res. 1999;99:123–132. doi: 10.1016/s0166-4328(98)00096-5. [DOI] [PubMed] [Google Scholar]
- Weisz DJ, Clark GA, Thompson RF. Increased responsivity of dentate granule cells during nictitating membrane response conditioning in rabbit. Behav Brain Res. 1984;12:145–154. doi: 10.1016/0166-4328(84)90037-8. [DOI] [PubMed] [Google Scholar]
- Winder DG, Mansuy IM, Osman M, Moallem TM, Kandel ER. Genetic and pharmacological evidence for a novel, intermediate phase of long-term potentiation suppressed by calcineurin. Cell. 1998;92:25–37. doi: 10.1016/s0092-8674(00)80896-x. [DOI] [PubMed] [Google Scholar]
- Zhai Q, Lai Z, Roos P, Nyberg F. Characterization of growth hormone binding sites in rat brain. Acta Paediatr Suppl. 1994;406:92–95. doi: 10.1111/j.1651-2227.1994.tb13433.x. [DOI] [PubMed] [Google Scholar]
- Zhang SC, Fedoroff S. Cellular localization of stem cell factor and c-kit receptor in the mouse nervous system. J Neurosci Res. 1997;47:1–15. [PubMed] [Google Scholar]
- Zhang SC, Fedoroff S. Modulation of microglia by stem cell factor. J Neurosci Res. 1998;53:29–37. doi: 10.1002/(SICI)1097-4547(19980701)53:1<29::AID-JNR4>3.0.CO;2-L. [DOI] [PubMed] [Google Scholar]